WWLLN Global Stroke Density Climatology
These movies and plots were prepared by K. S. Virts working in collaboration with M. L. Hutchins, J. M. Wallace, and R. H. Holzworth
Documentation of this work is in Virts et al. (2013).
Other WWLLN climatological datasets can be found here.
Introduction
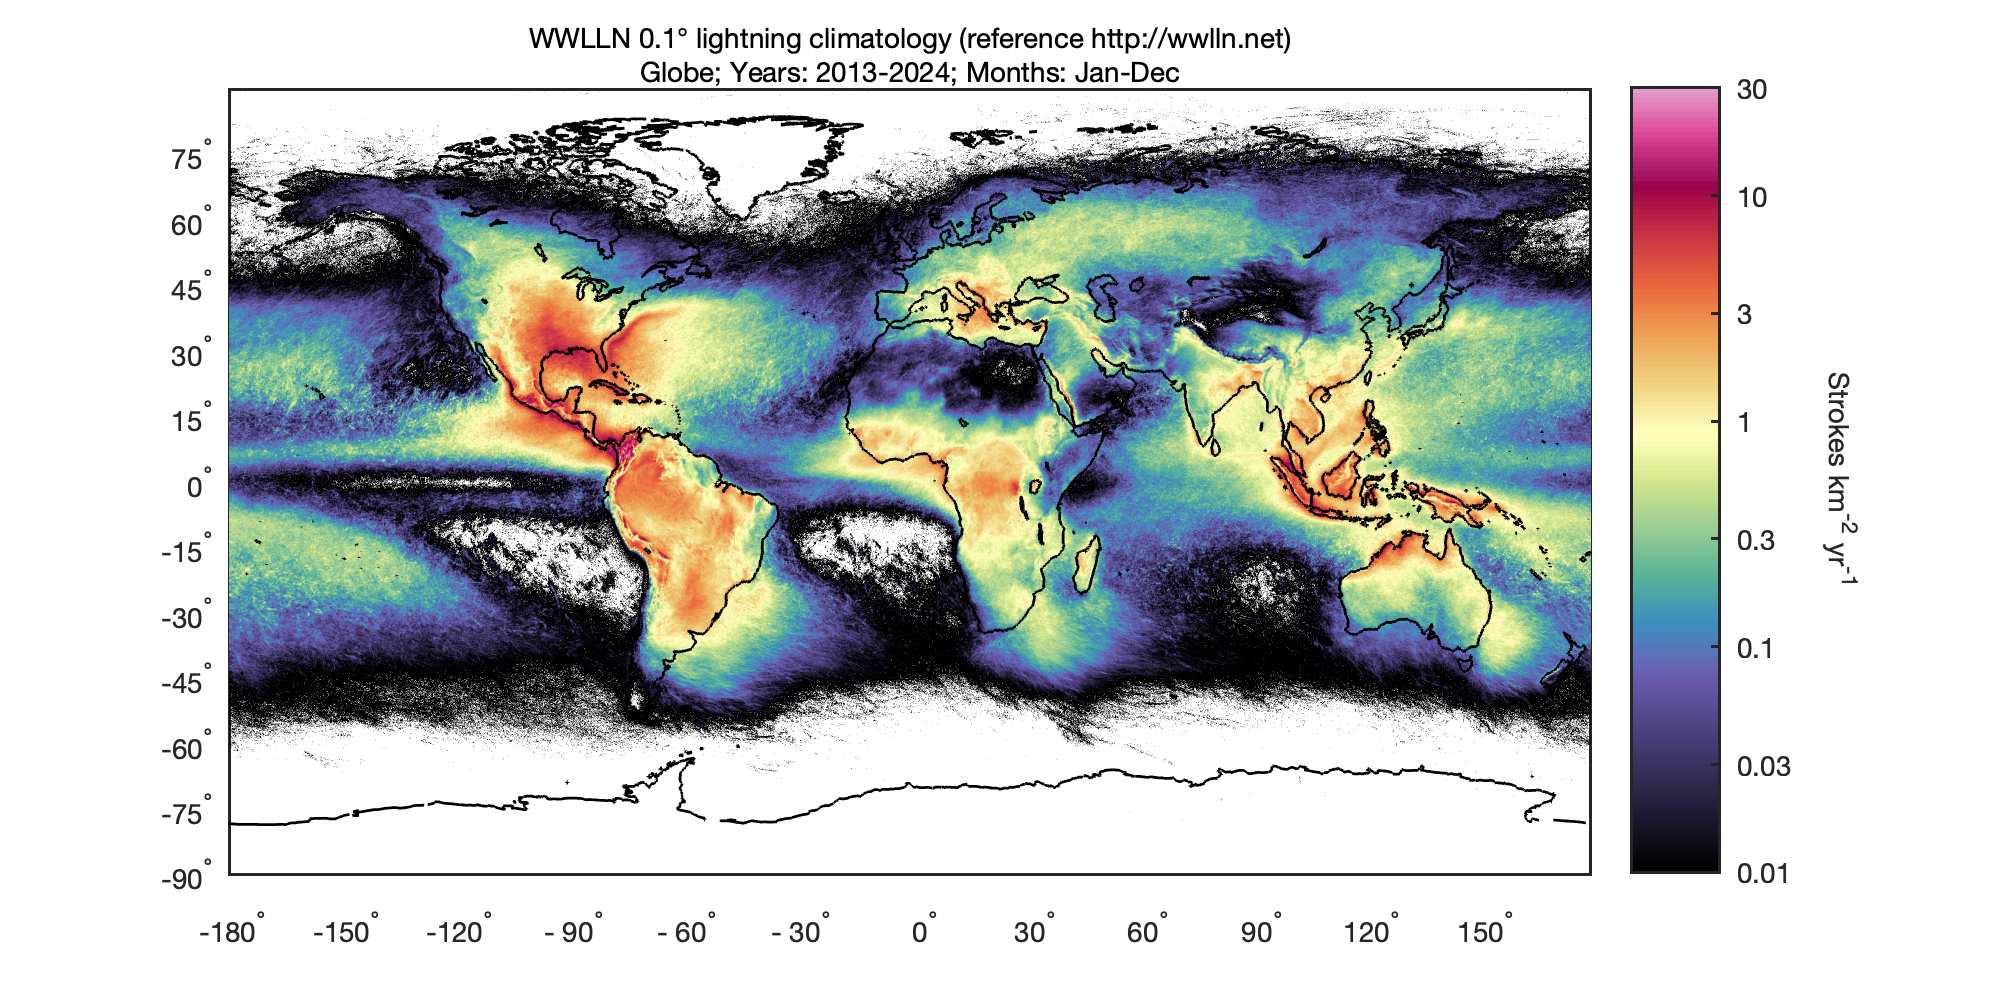
The ground-based World-Wide Lightning Location Network (WWLLN) has continuously monitored global lightning since 2004. We are pleased to make available a monthly and hourly climatology of lightning occurrence as detected by WWLLN. This climatology was originally presented in Virts et al. (2013), based on four years of WWLLN data. The climatology has been updated to include all lightning detected by WWLLN from 2013 to the present, during which period the number of WWLLN stations has been largely consistent.
What is stroke density?
Stroke density is the number of strokes detected at a particular location during a time period—that is, how much lightning is occurring. For this climatology, strokes are counted on a 0.1° or 1° latitude/longitude grid and averaged by month and/or hour of the day.
These stroke densities are as detected by WWLLN and are not corrected for relative detection efficiency, which varies with time and location. Comparisons between absolute intensities in different continental regions, using this work, could be misleading. However, regional patterns of diurnal or seasonal variations are relatively insensitive to geographical variations in detection efficiency.
See also WWLLN sensor locations as presented in Virts et al. (2013), with colors indicating when each station was established (note that some sensors were in place as early as 2004). Black stars indicate sensors added during 2012-2013.
Global diurnal lightning animations
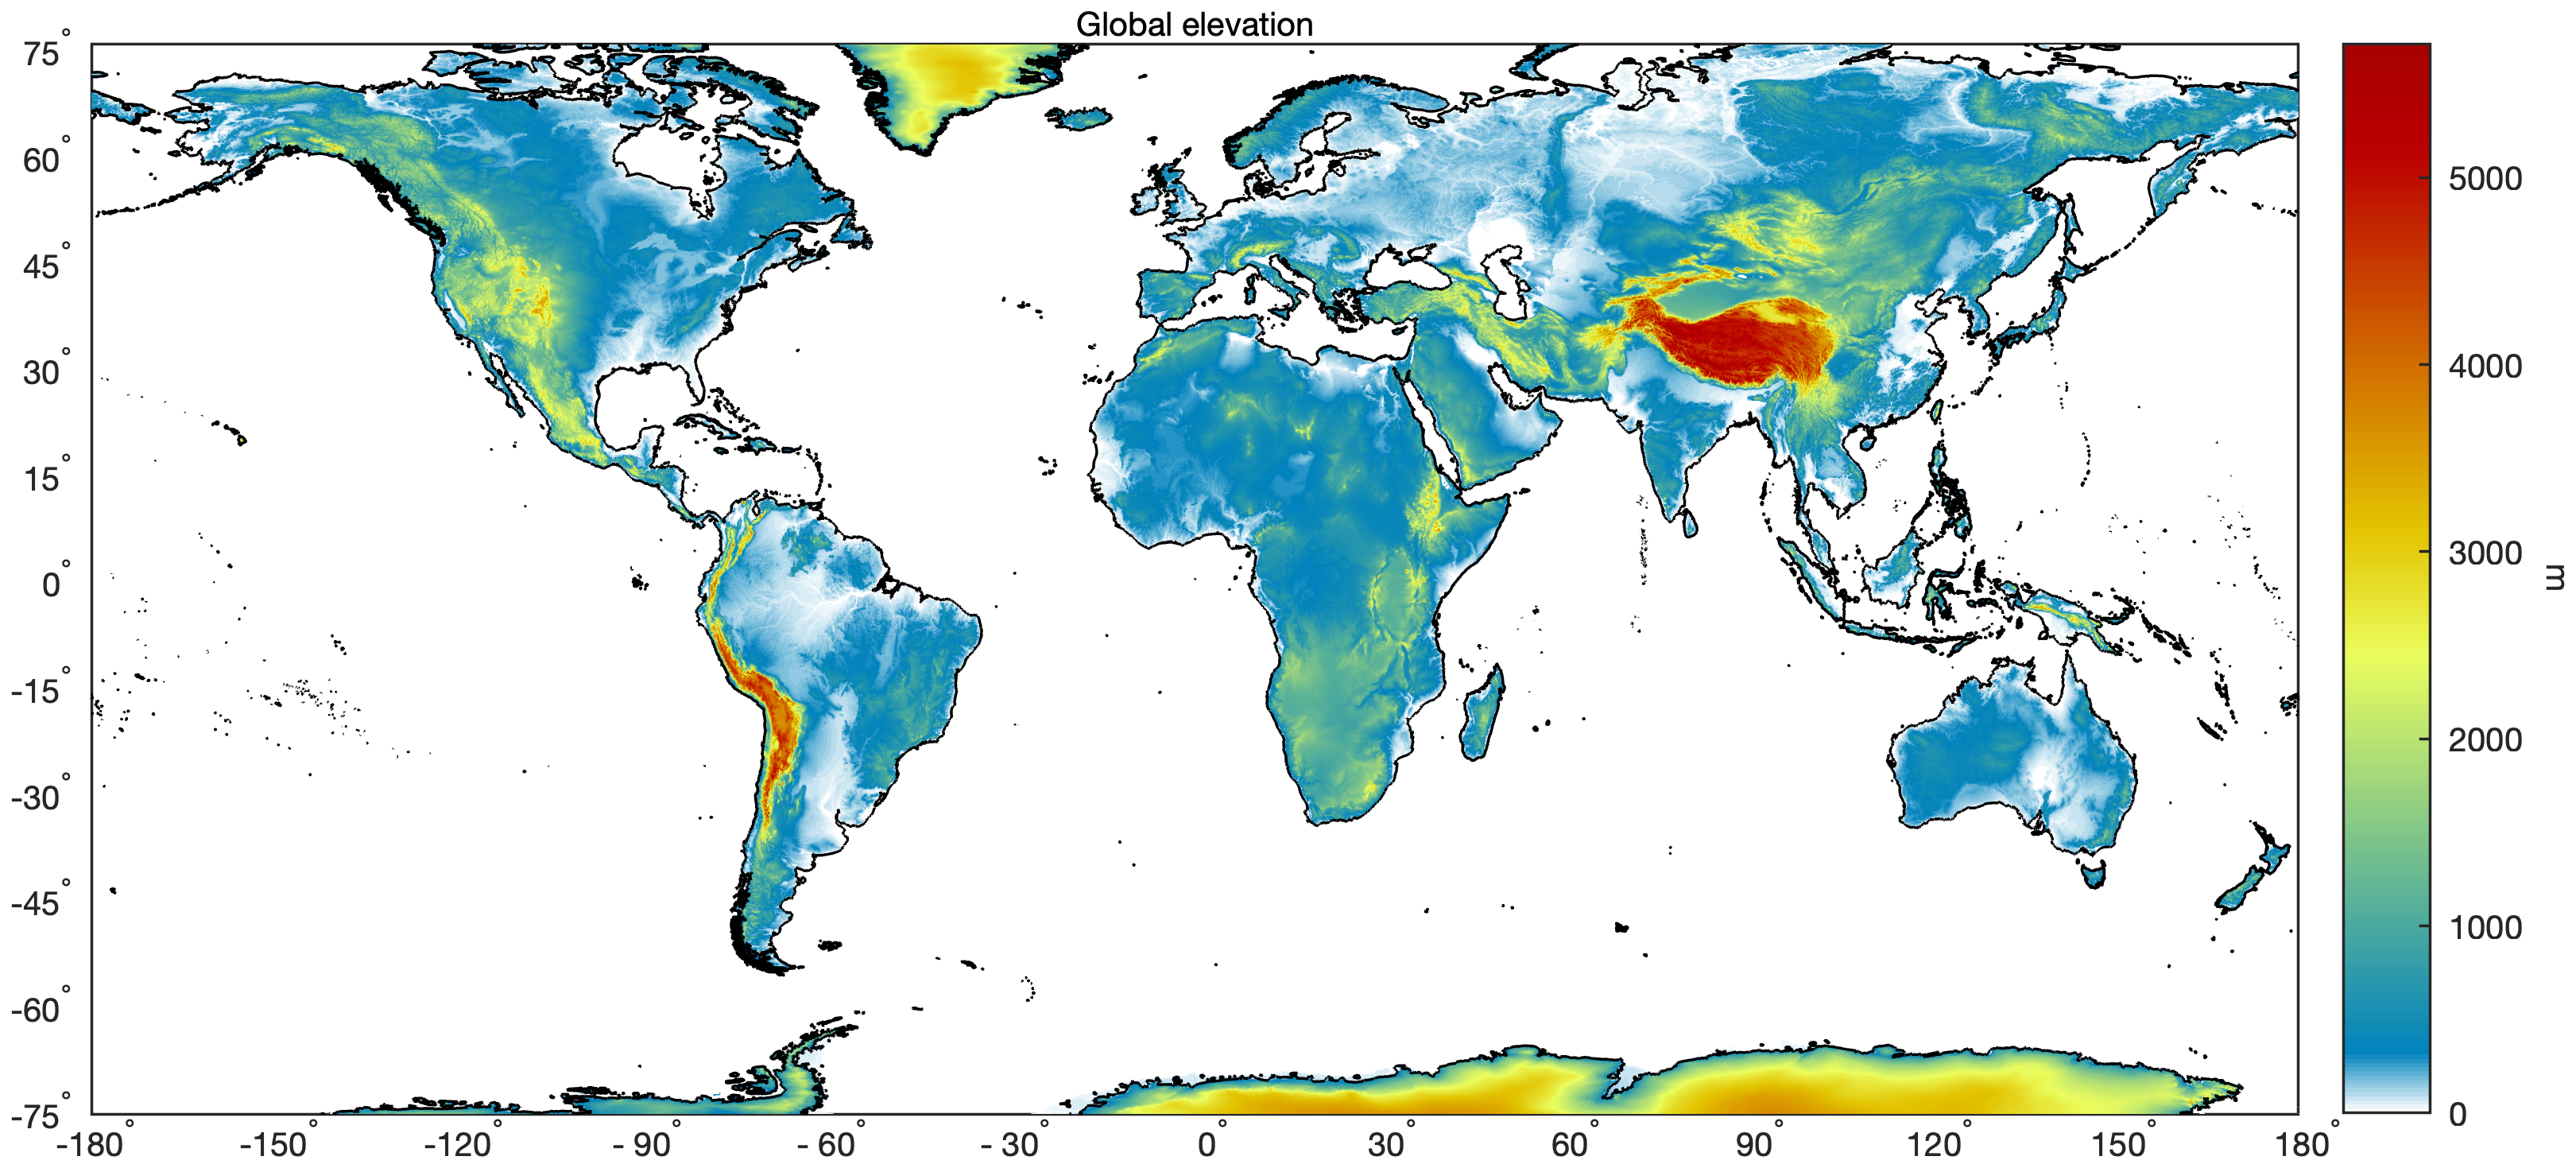
WWLLN’s annual-mean climatology illustrates the global distribution of lightning and its relationships with the underlying terrain. The impact of the diurnal cycle can be illustrated by an animation of WWLLN hourly-mean lightning frequency. To directly compare the diurnal cycle from one region to another, see an animation of lightning frequency as a function of local time rather than UTC. Diurnal animations of precipitation based on the Integrated Multi-satellitE Retrievals for GPM dataset (IMERG) are provided for comparison as a function of UTC or local time.
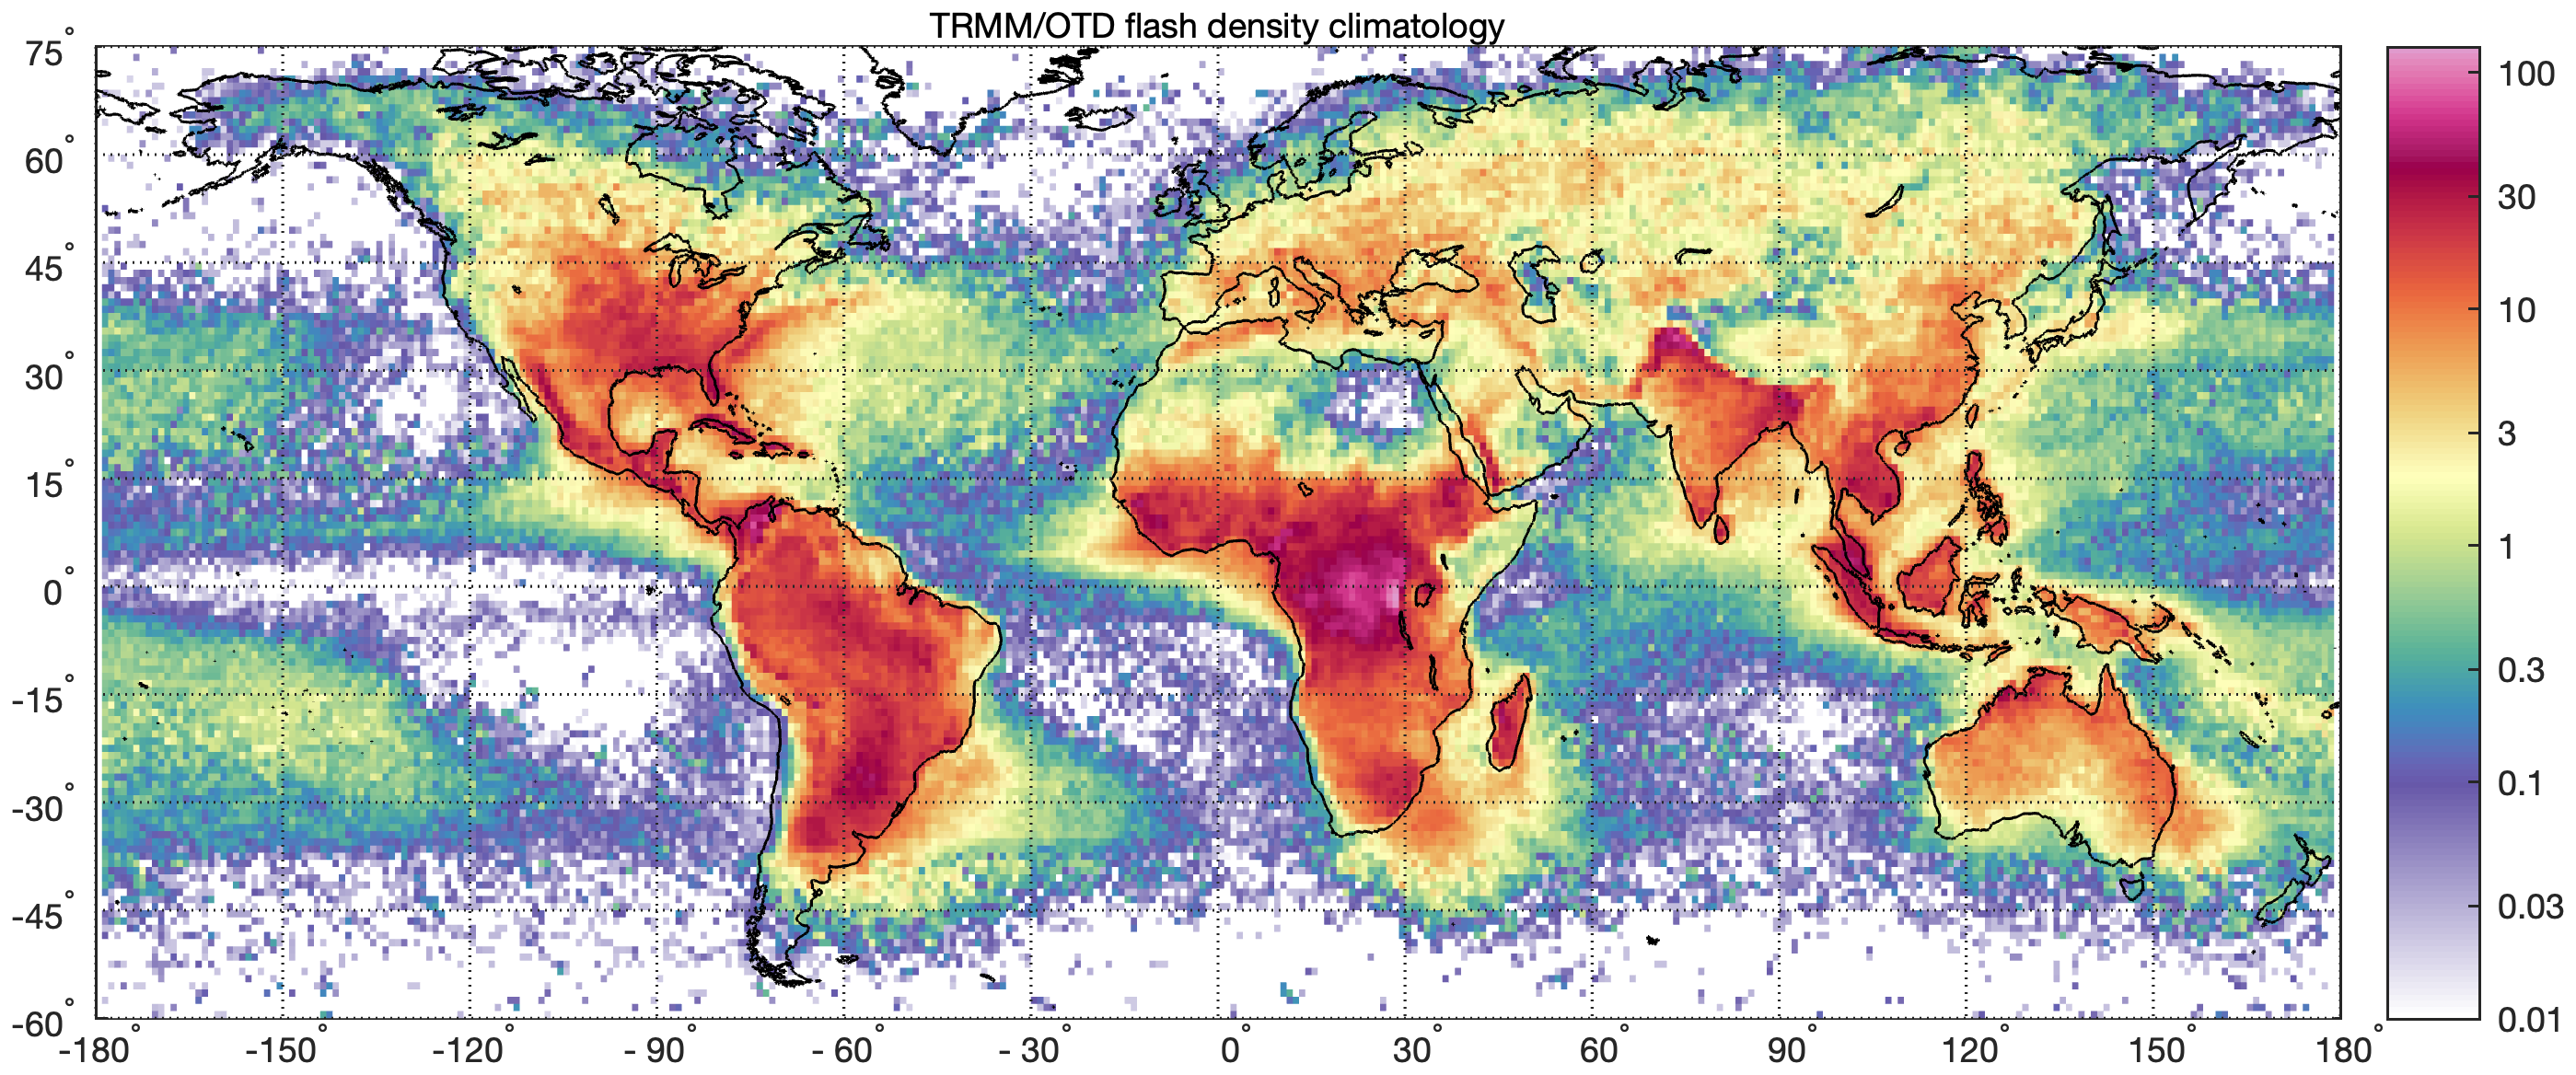
Long-term, global lightning observations are also available from two satellite-borne Lightning Imaging Sensors (LIS) along with the Optical Transient Detector (OTD). However, WWLLN samples ~100 times as many strokes per year as these satellites, permitting it to capture finer variations in both geography and time.
Continental and regional diurnal lightning animations
This section includes links to diurnal lightning animations organized by continent. The diurnal cycle of lightning is particularly fascinating in regions with both coastlines and topography, where both land/sea breezes and mountain/valley breezes modulate the convection. Here we provide high-resolution animations for many such regions. Favorites are marked with an *.
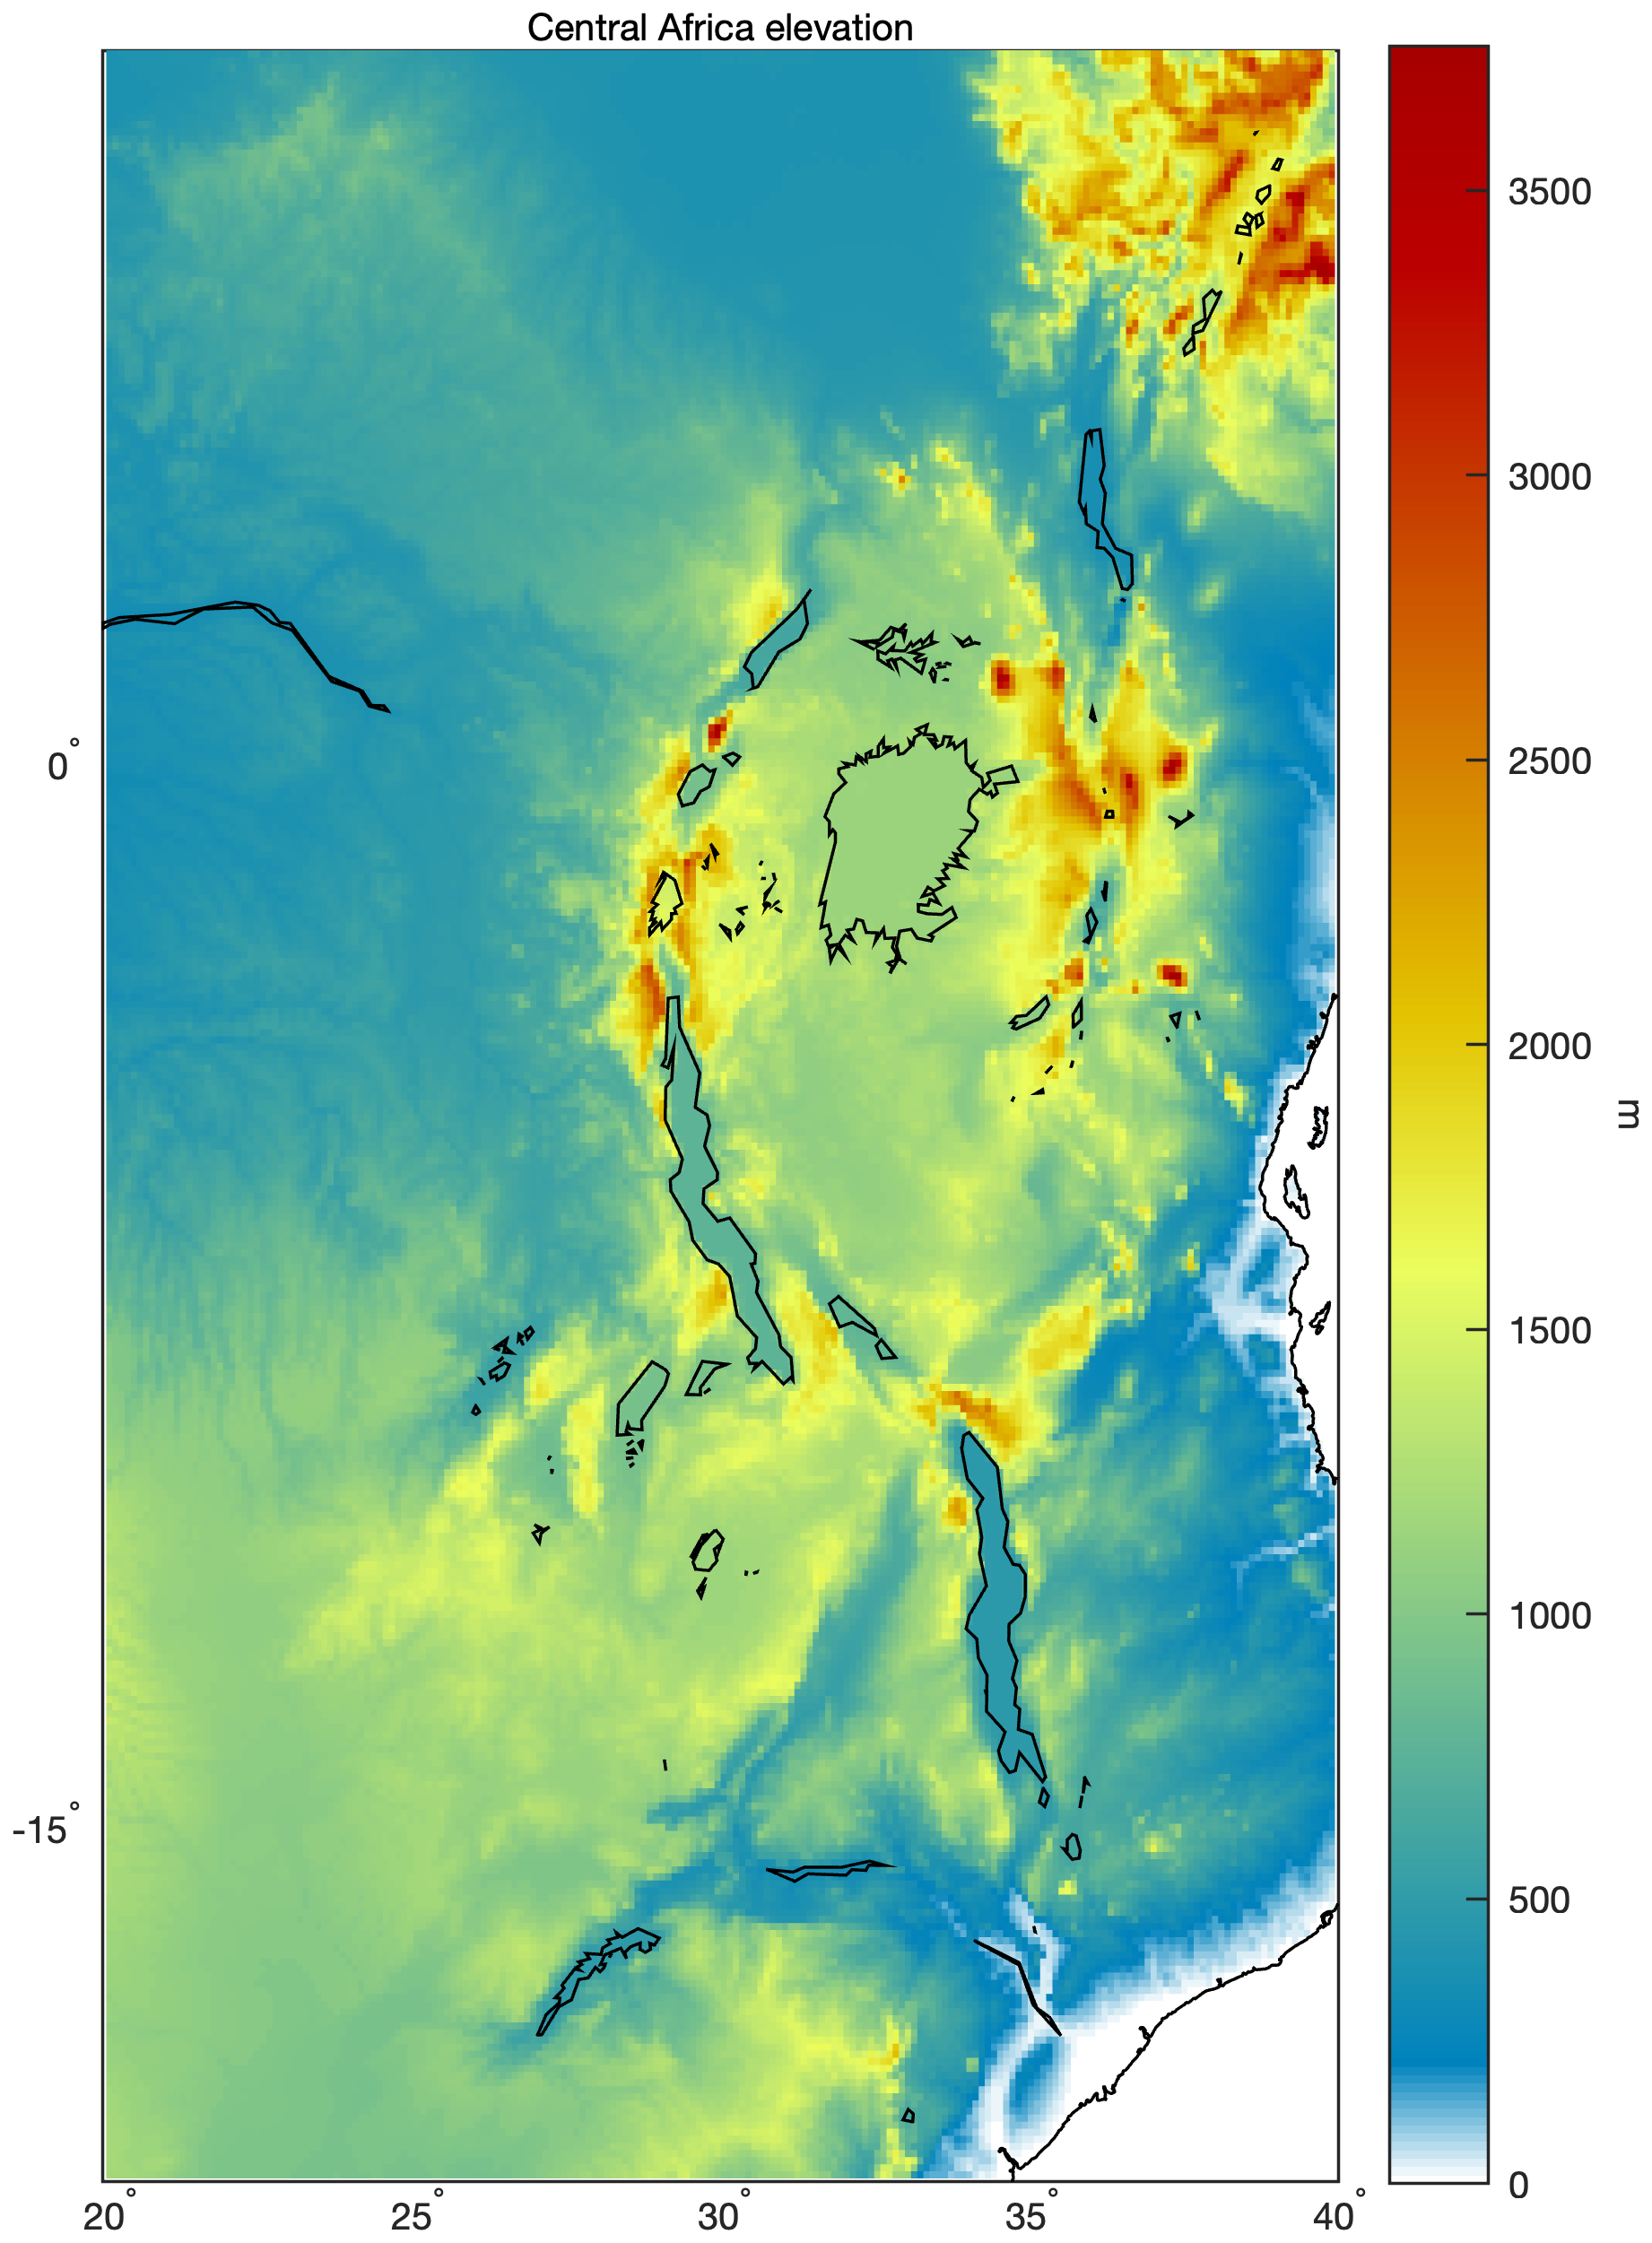
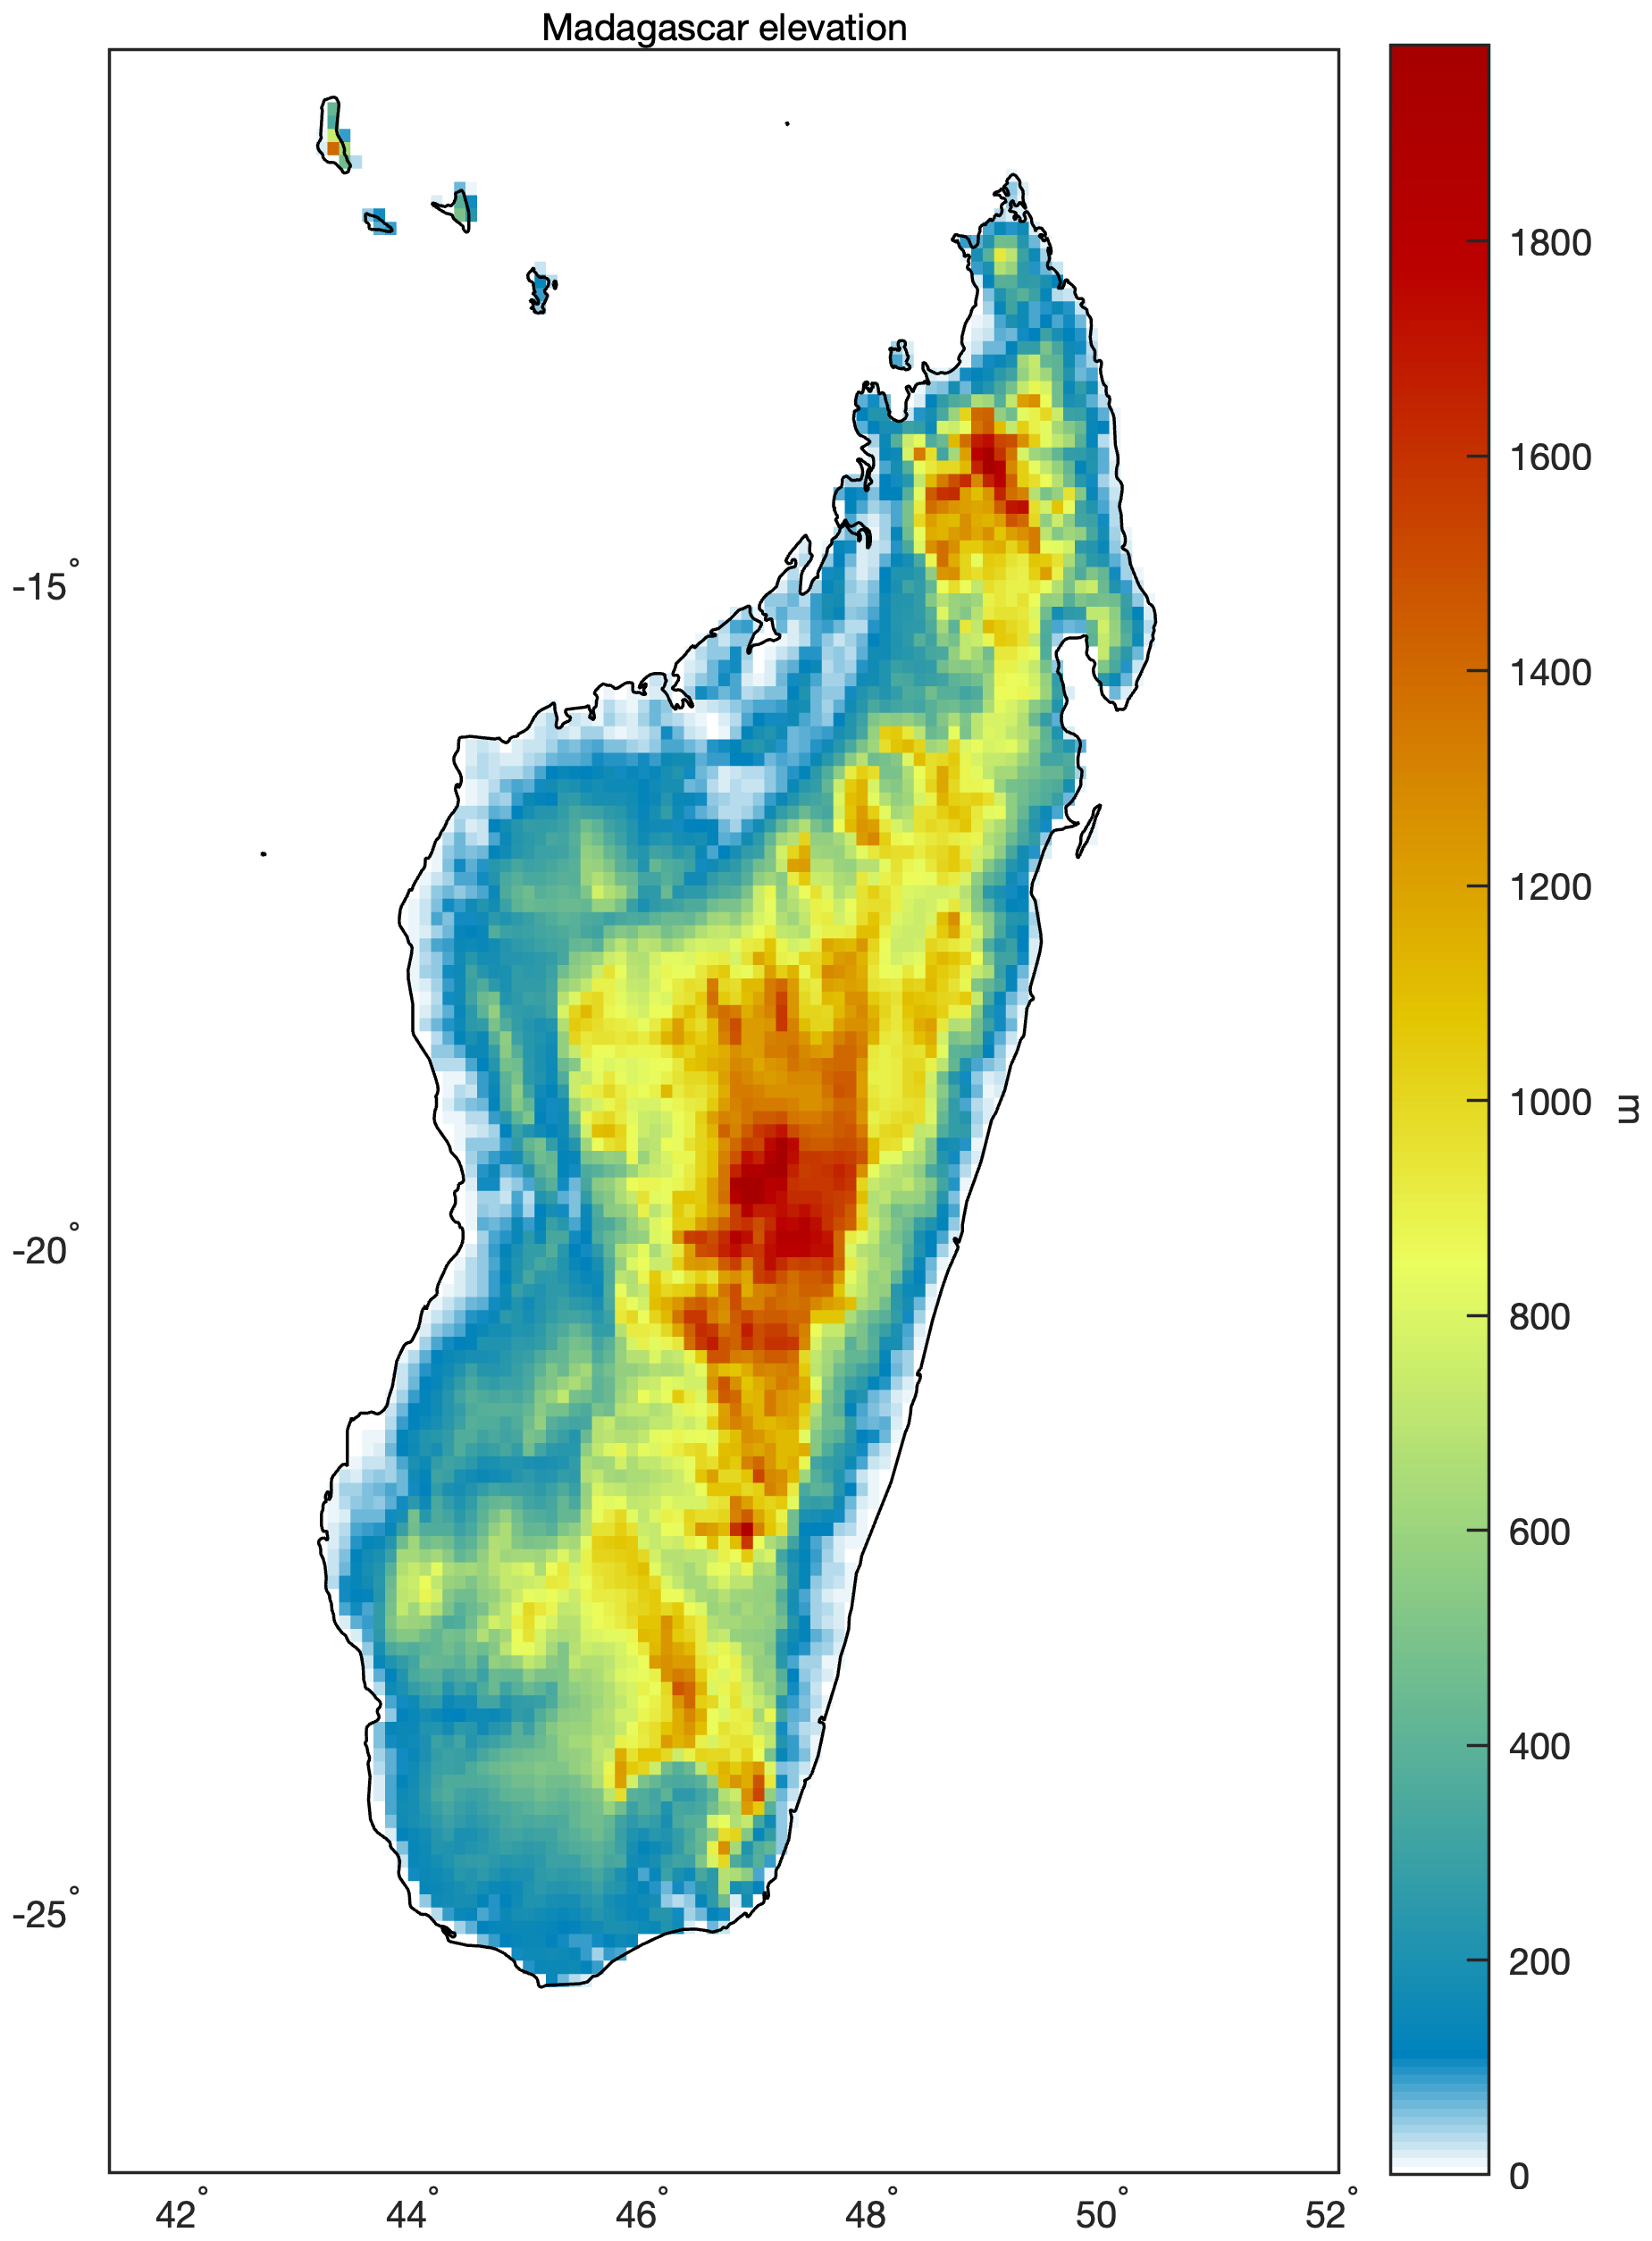
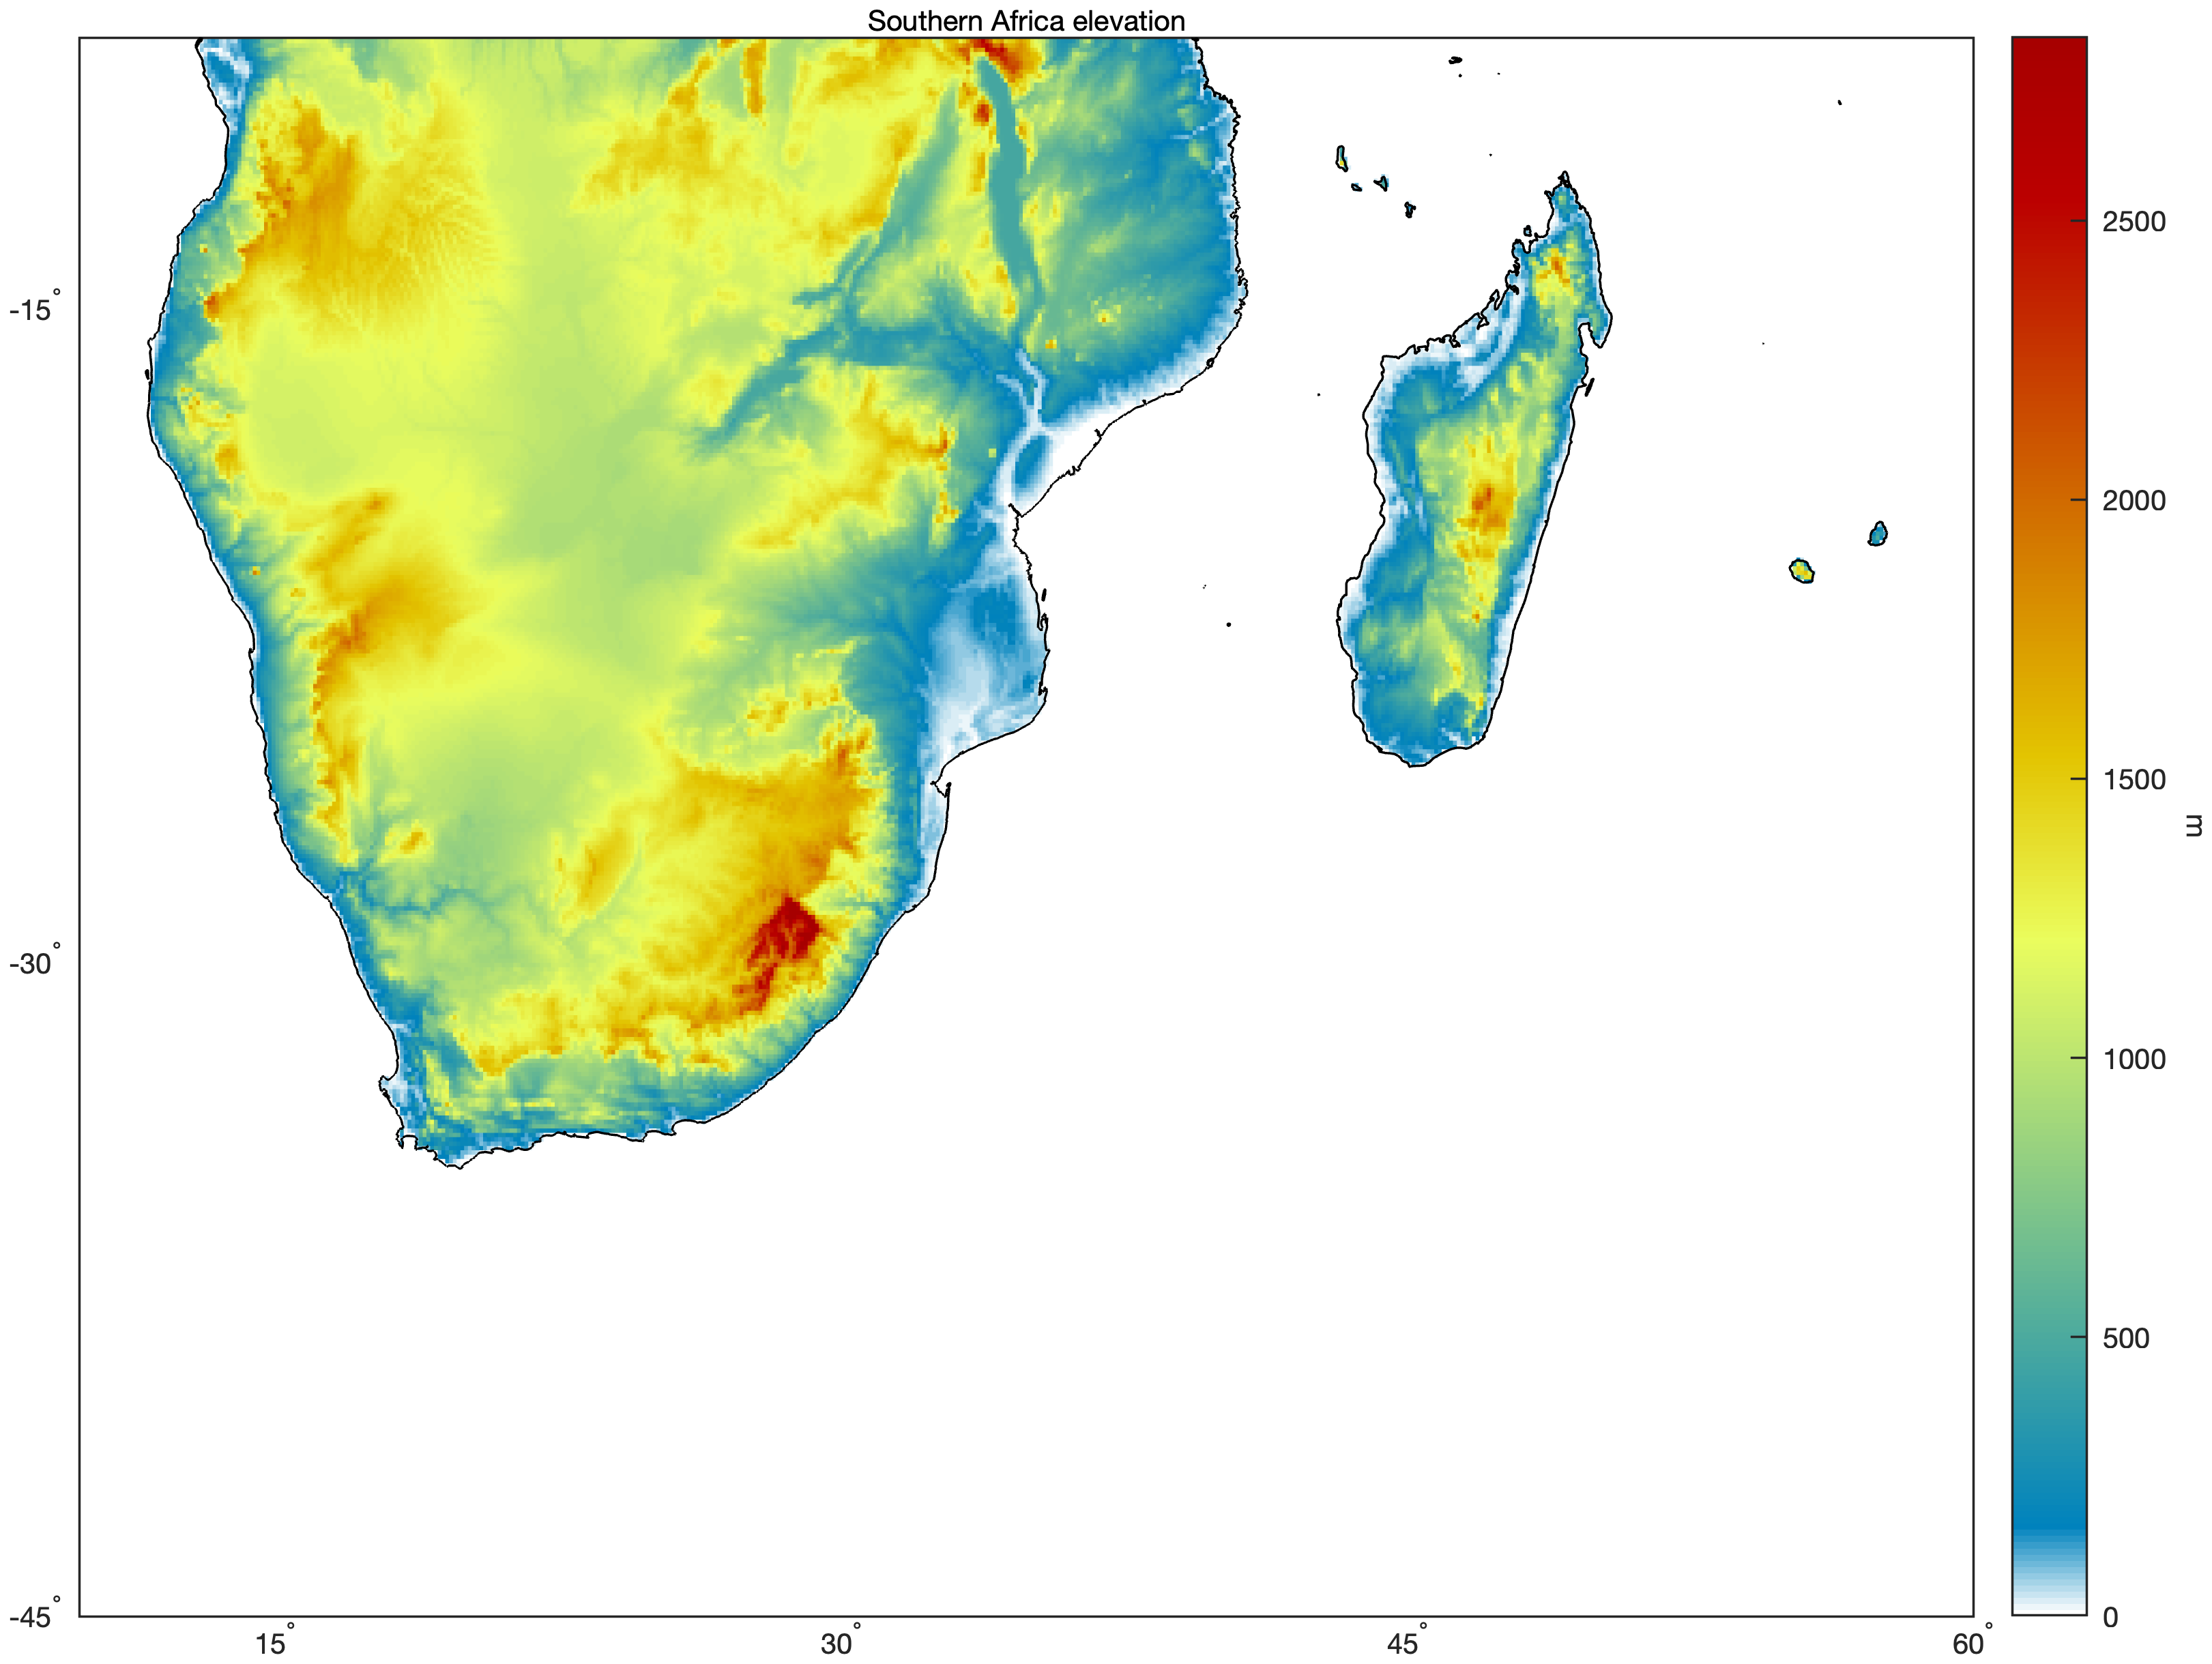
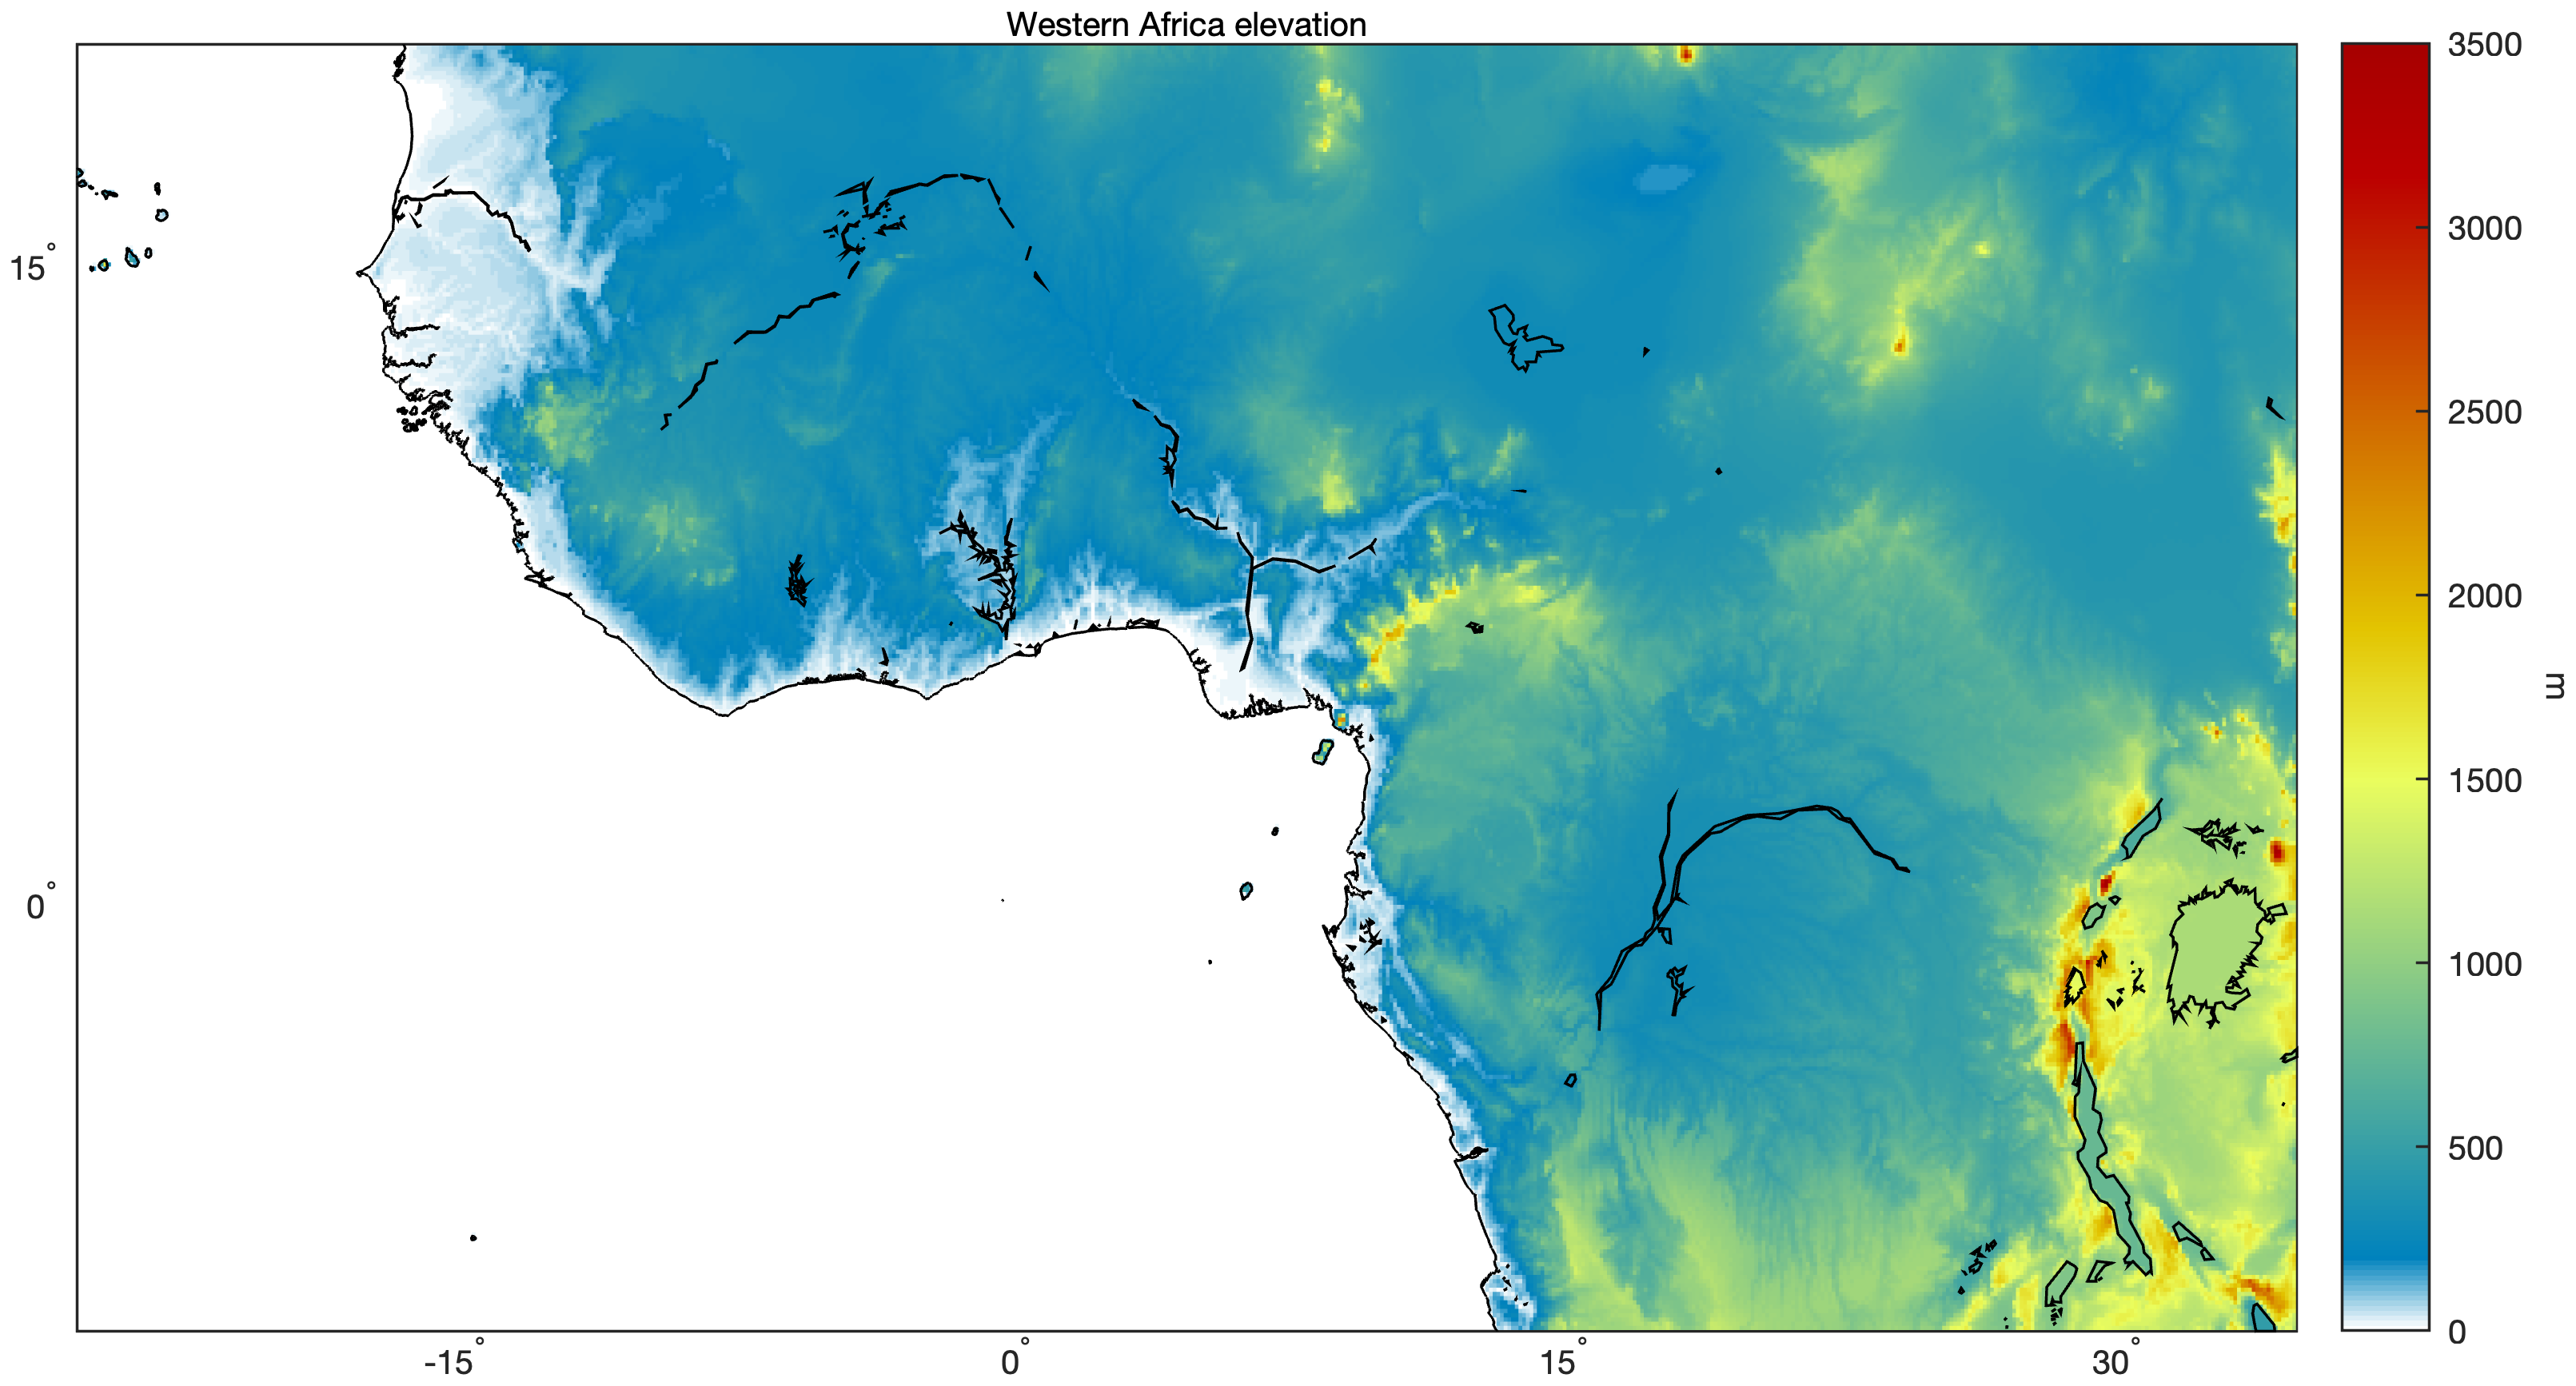
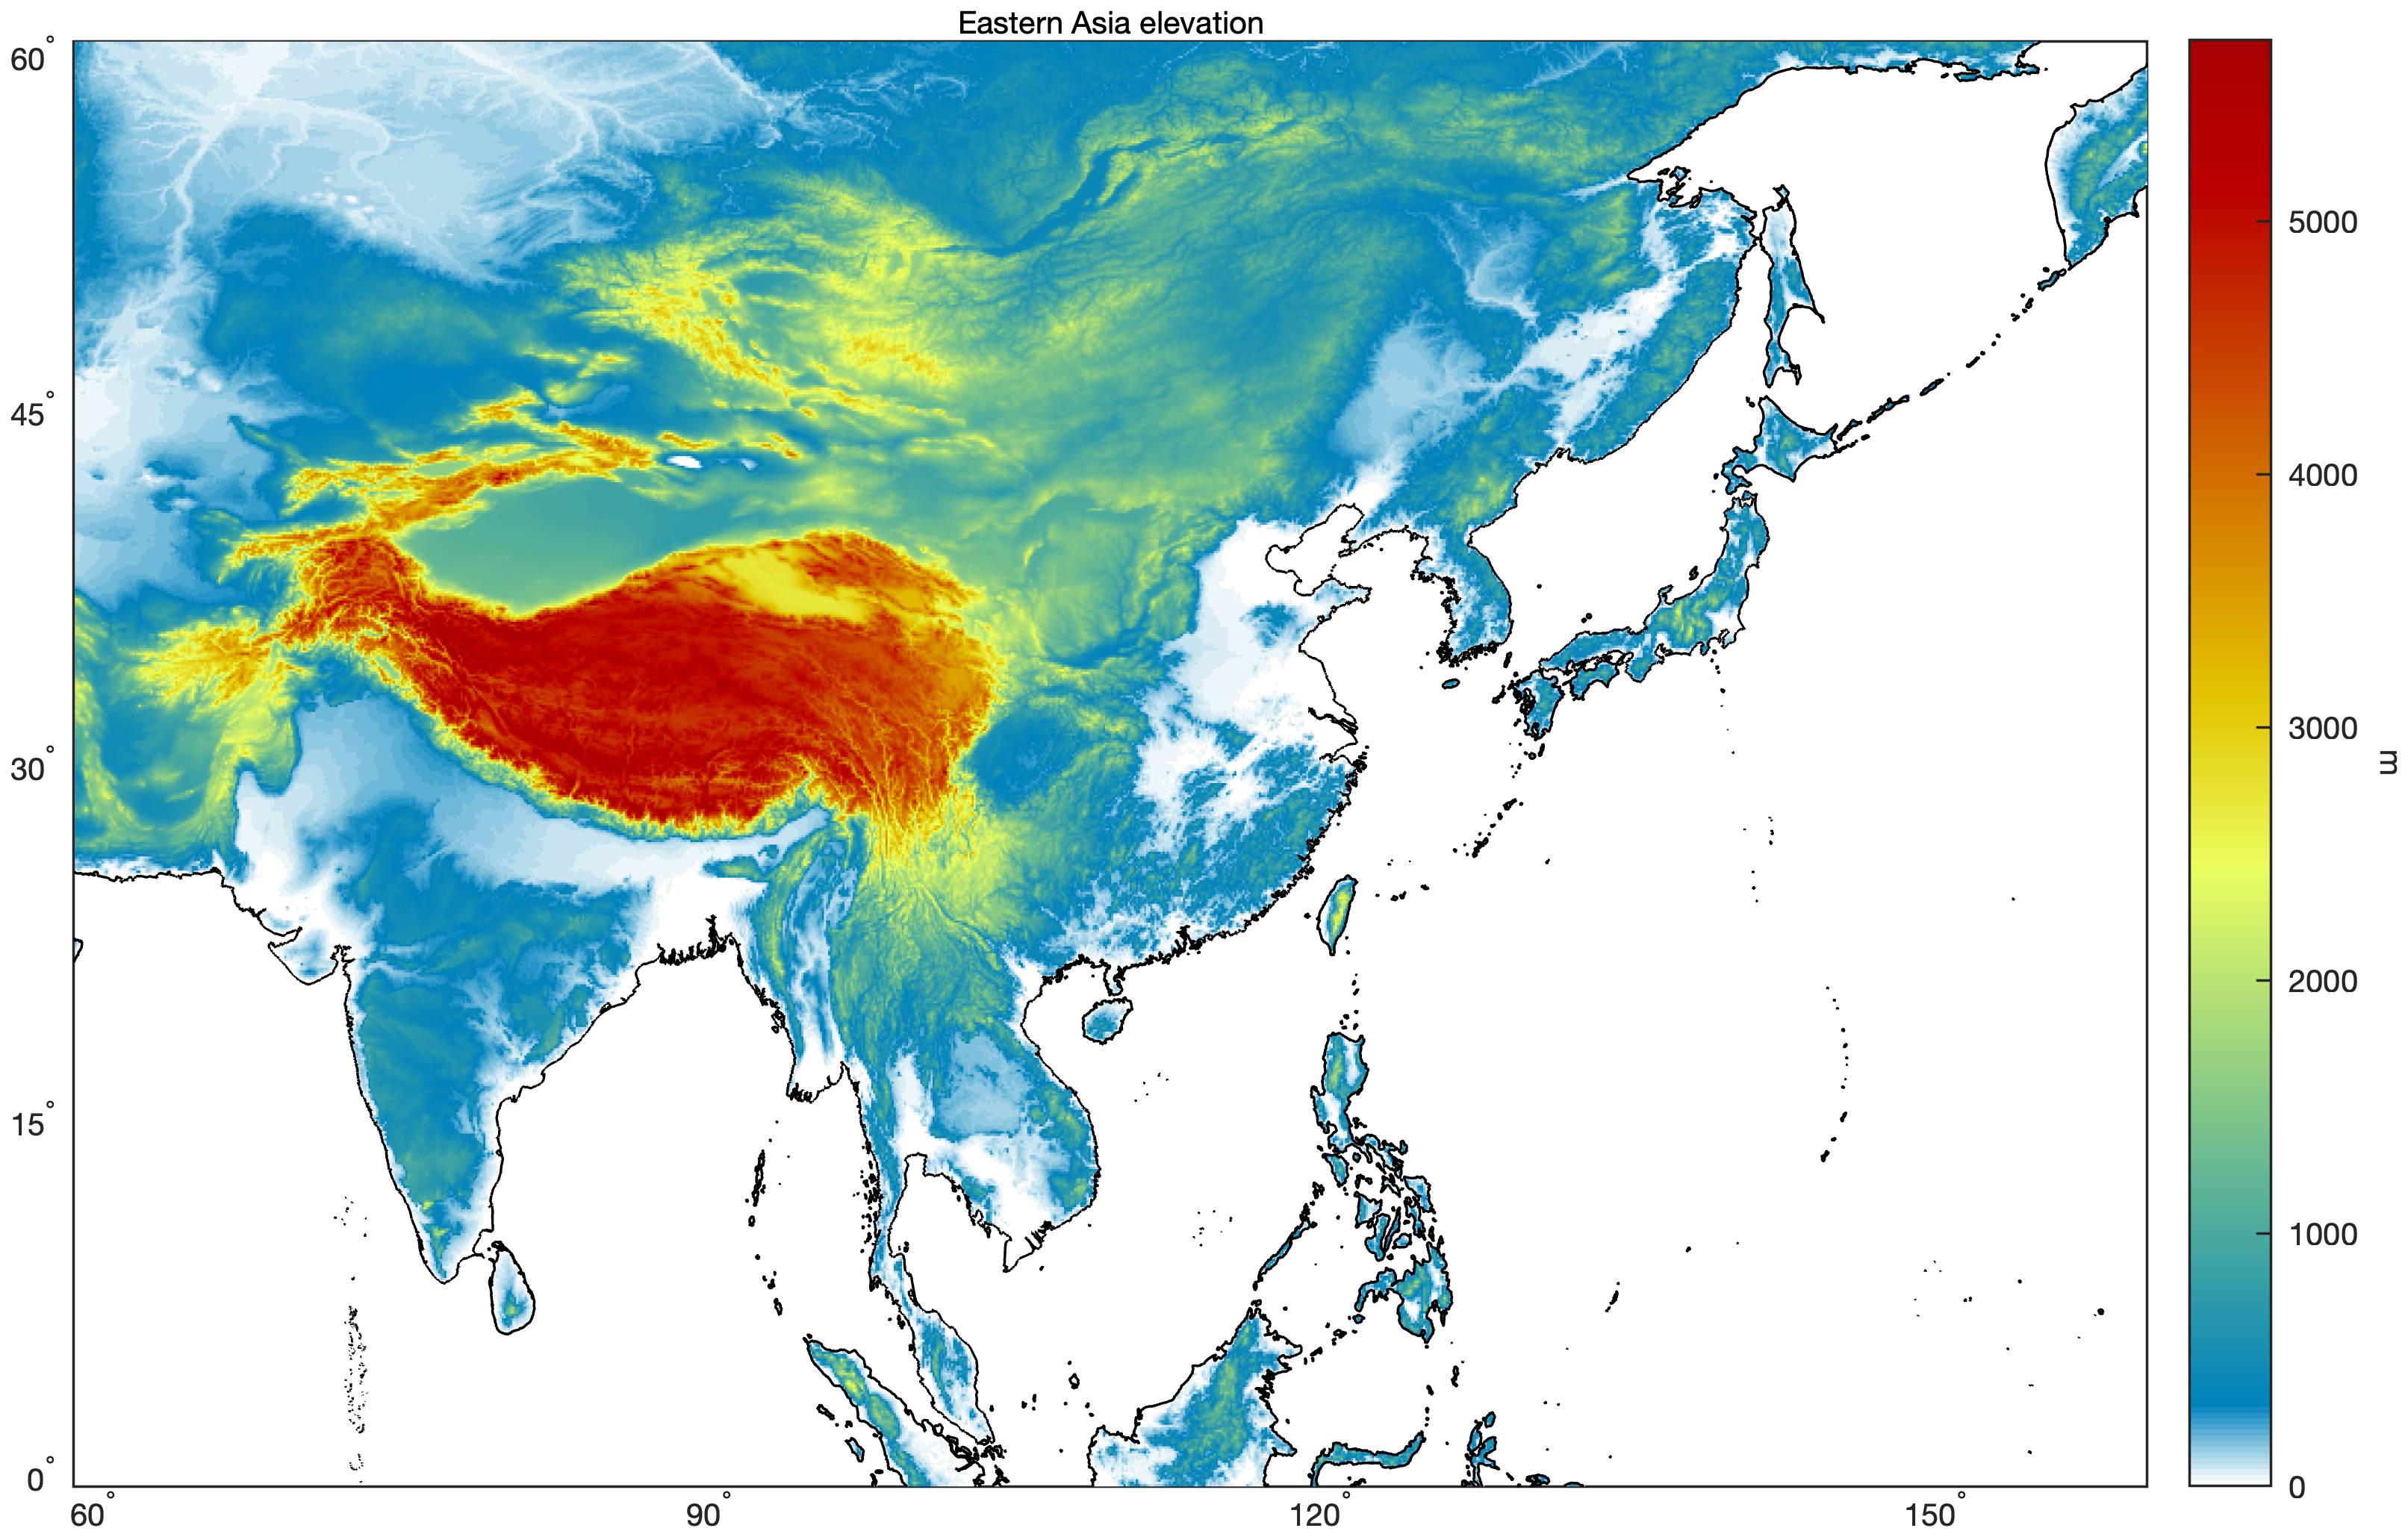
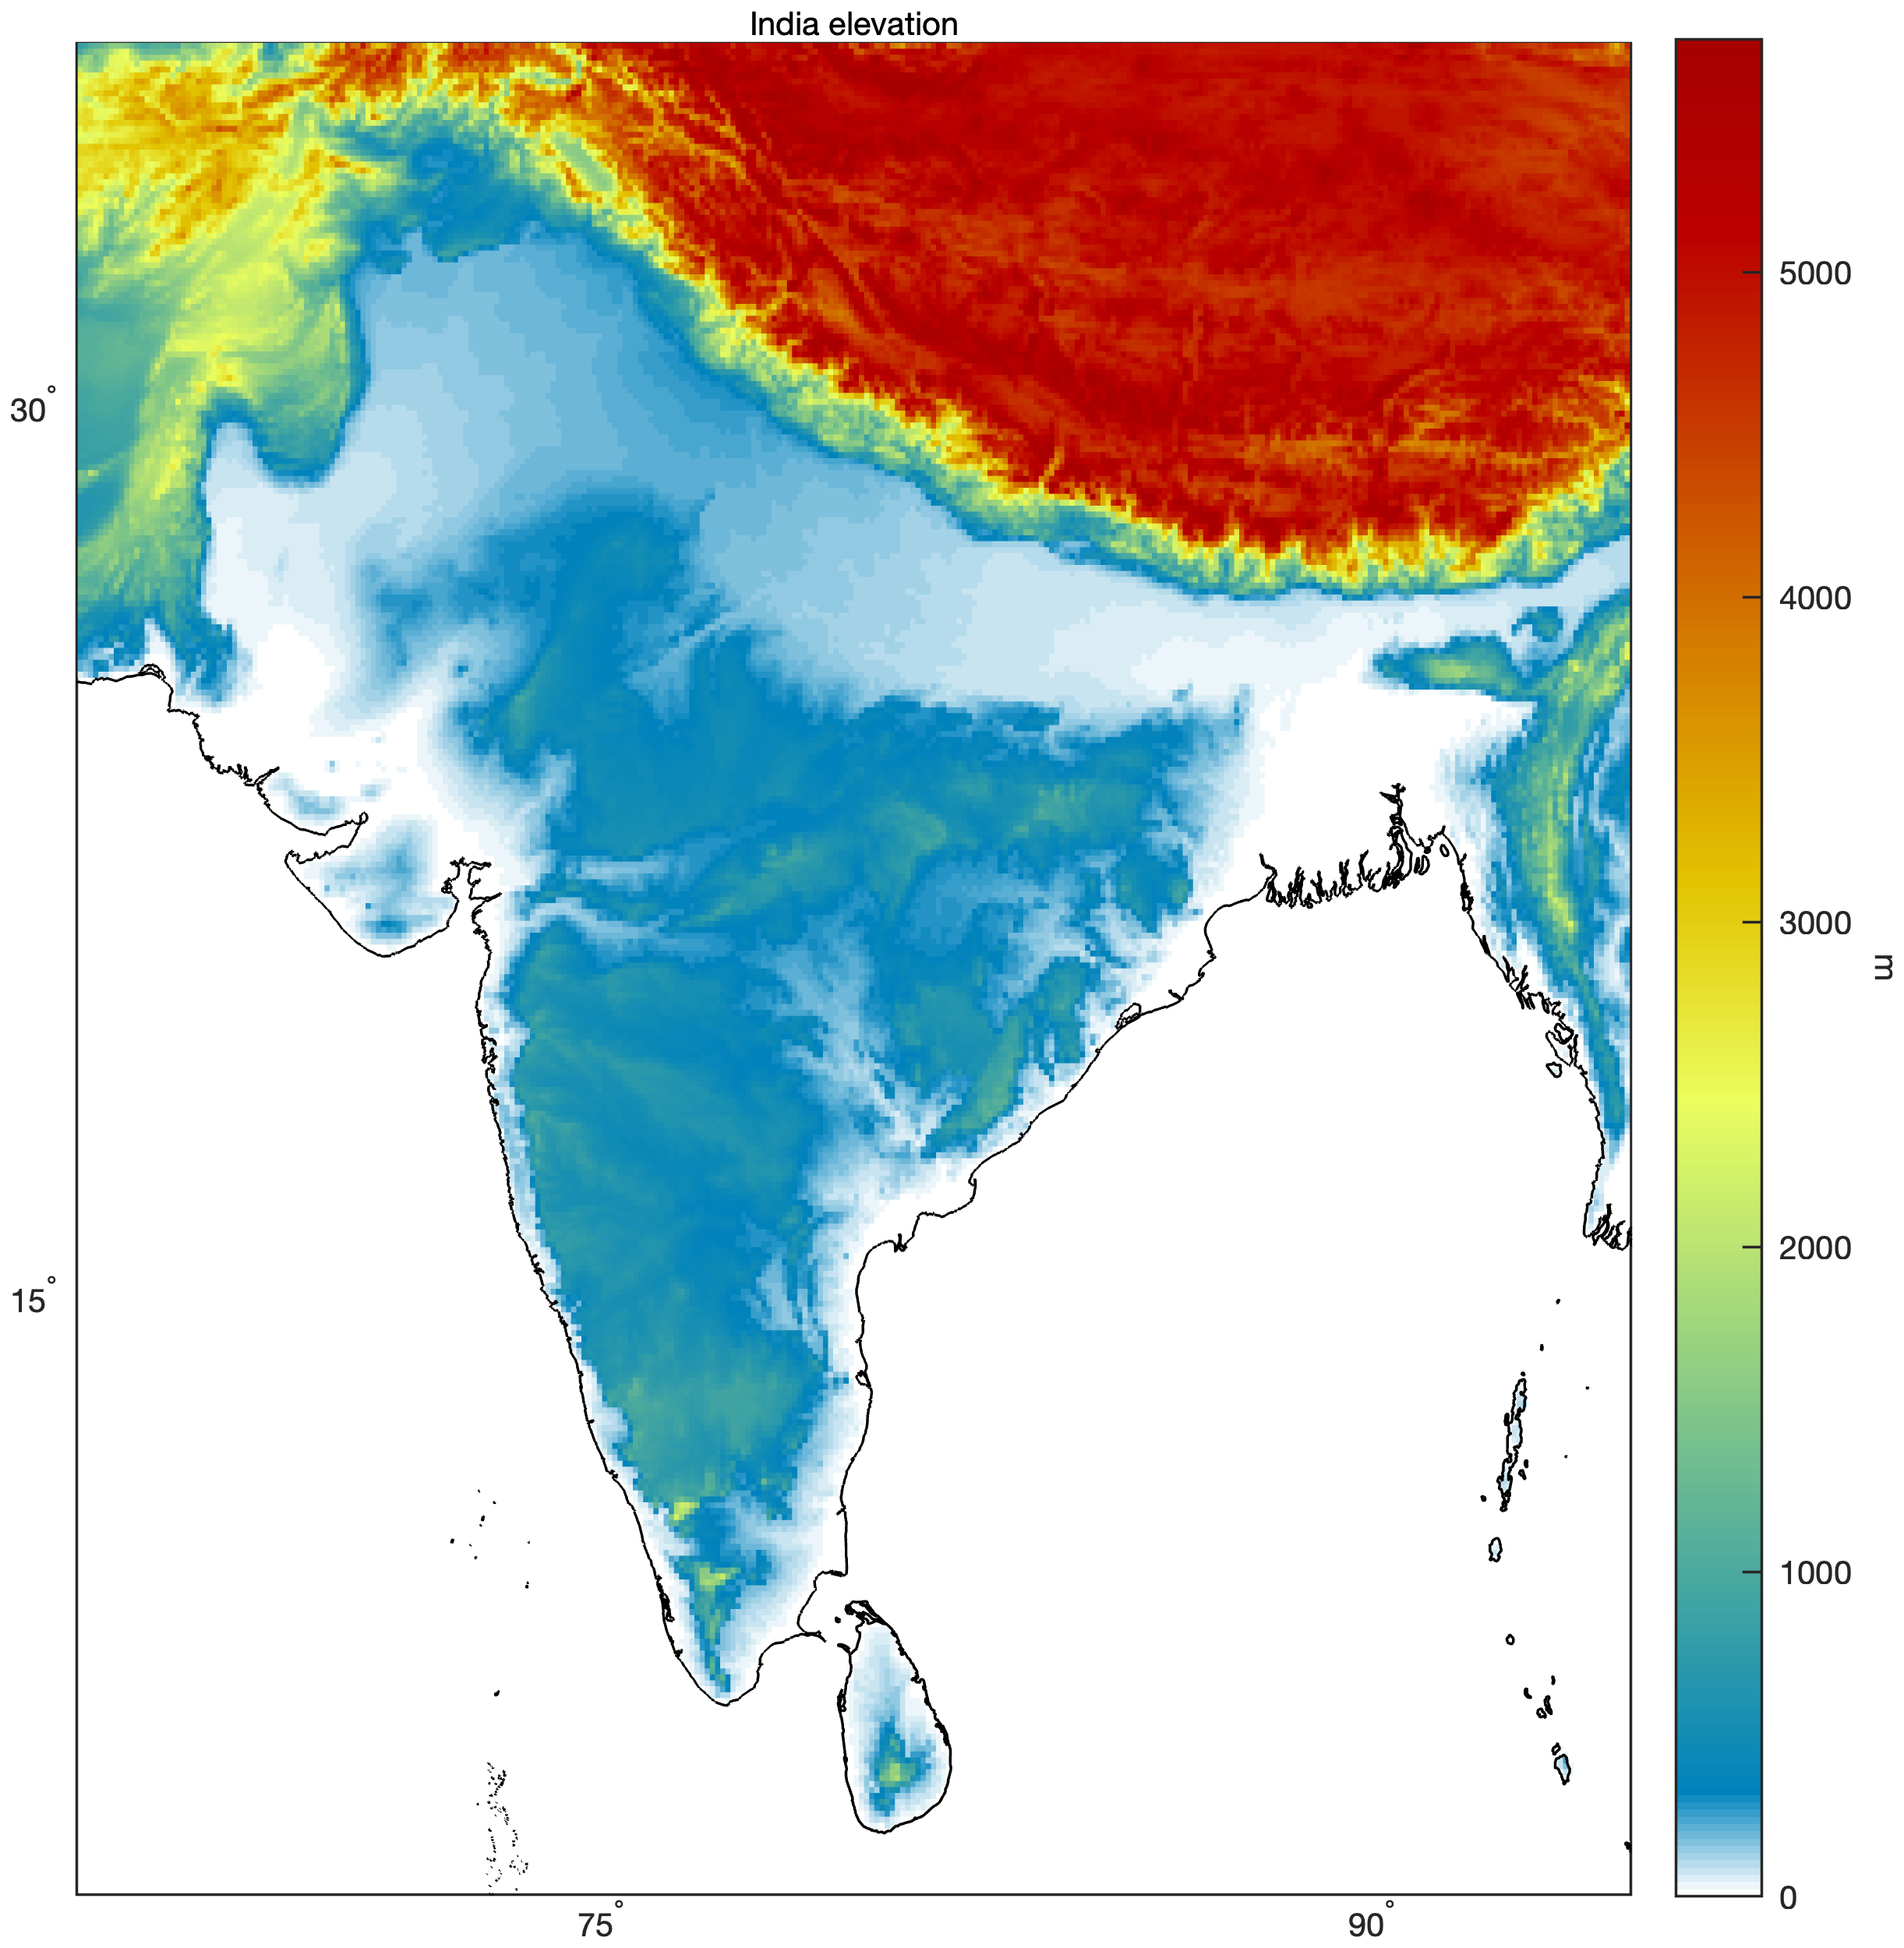
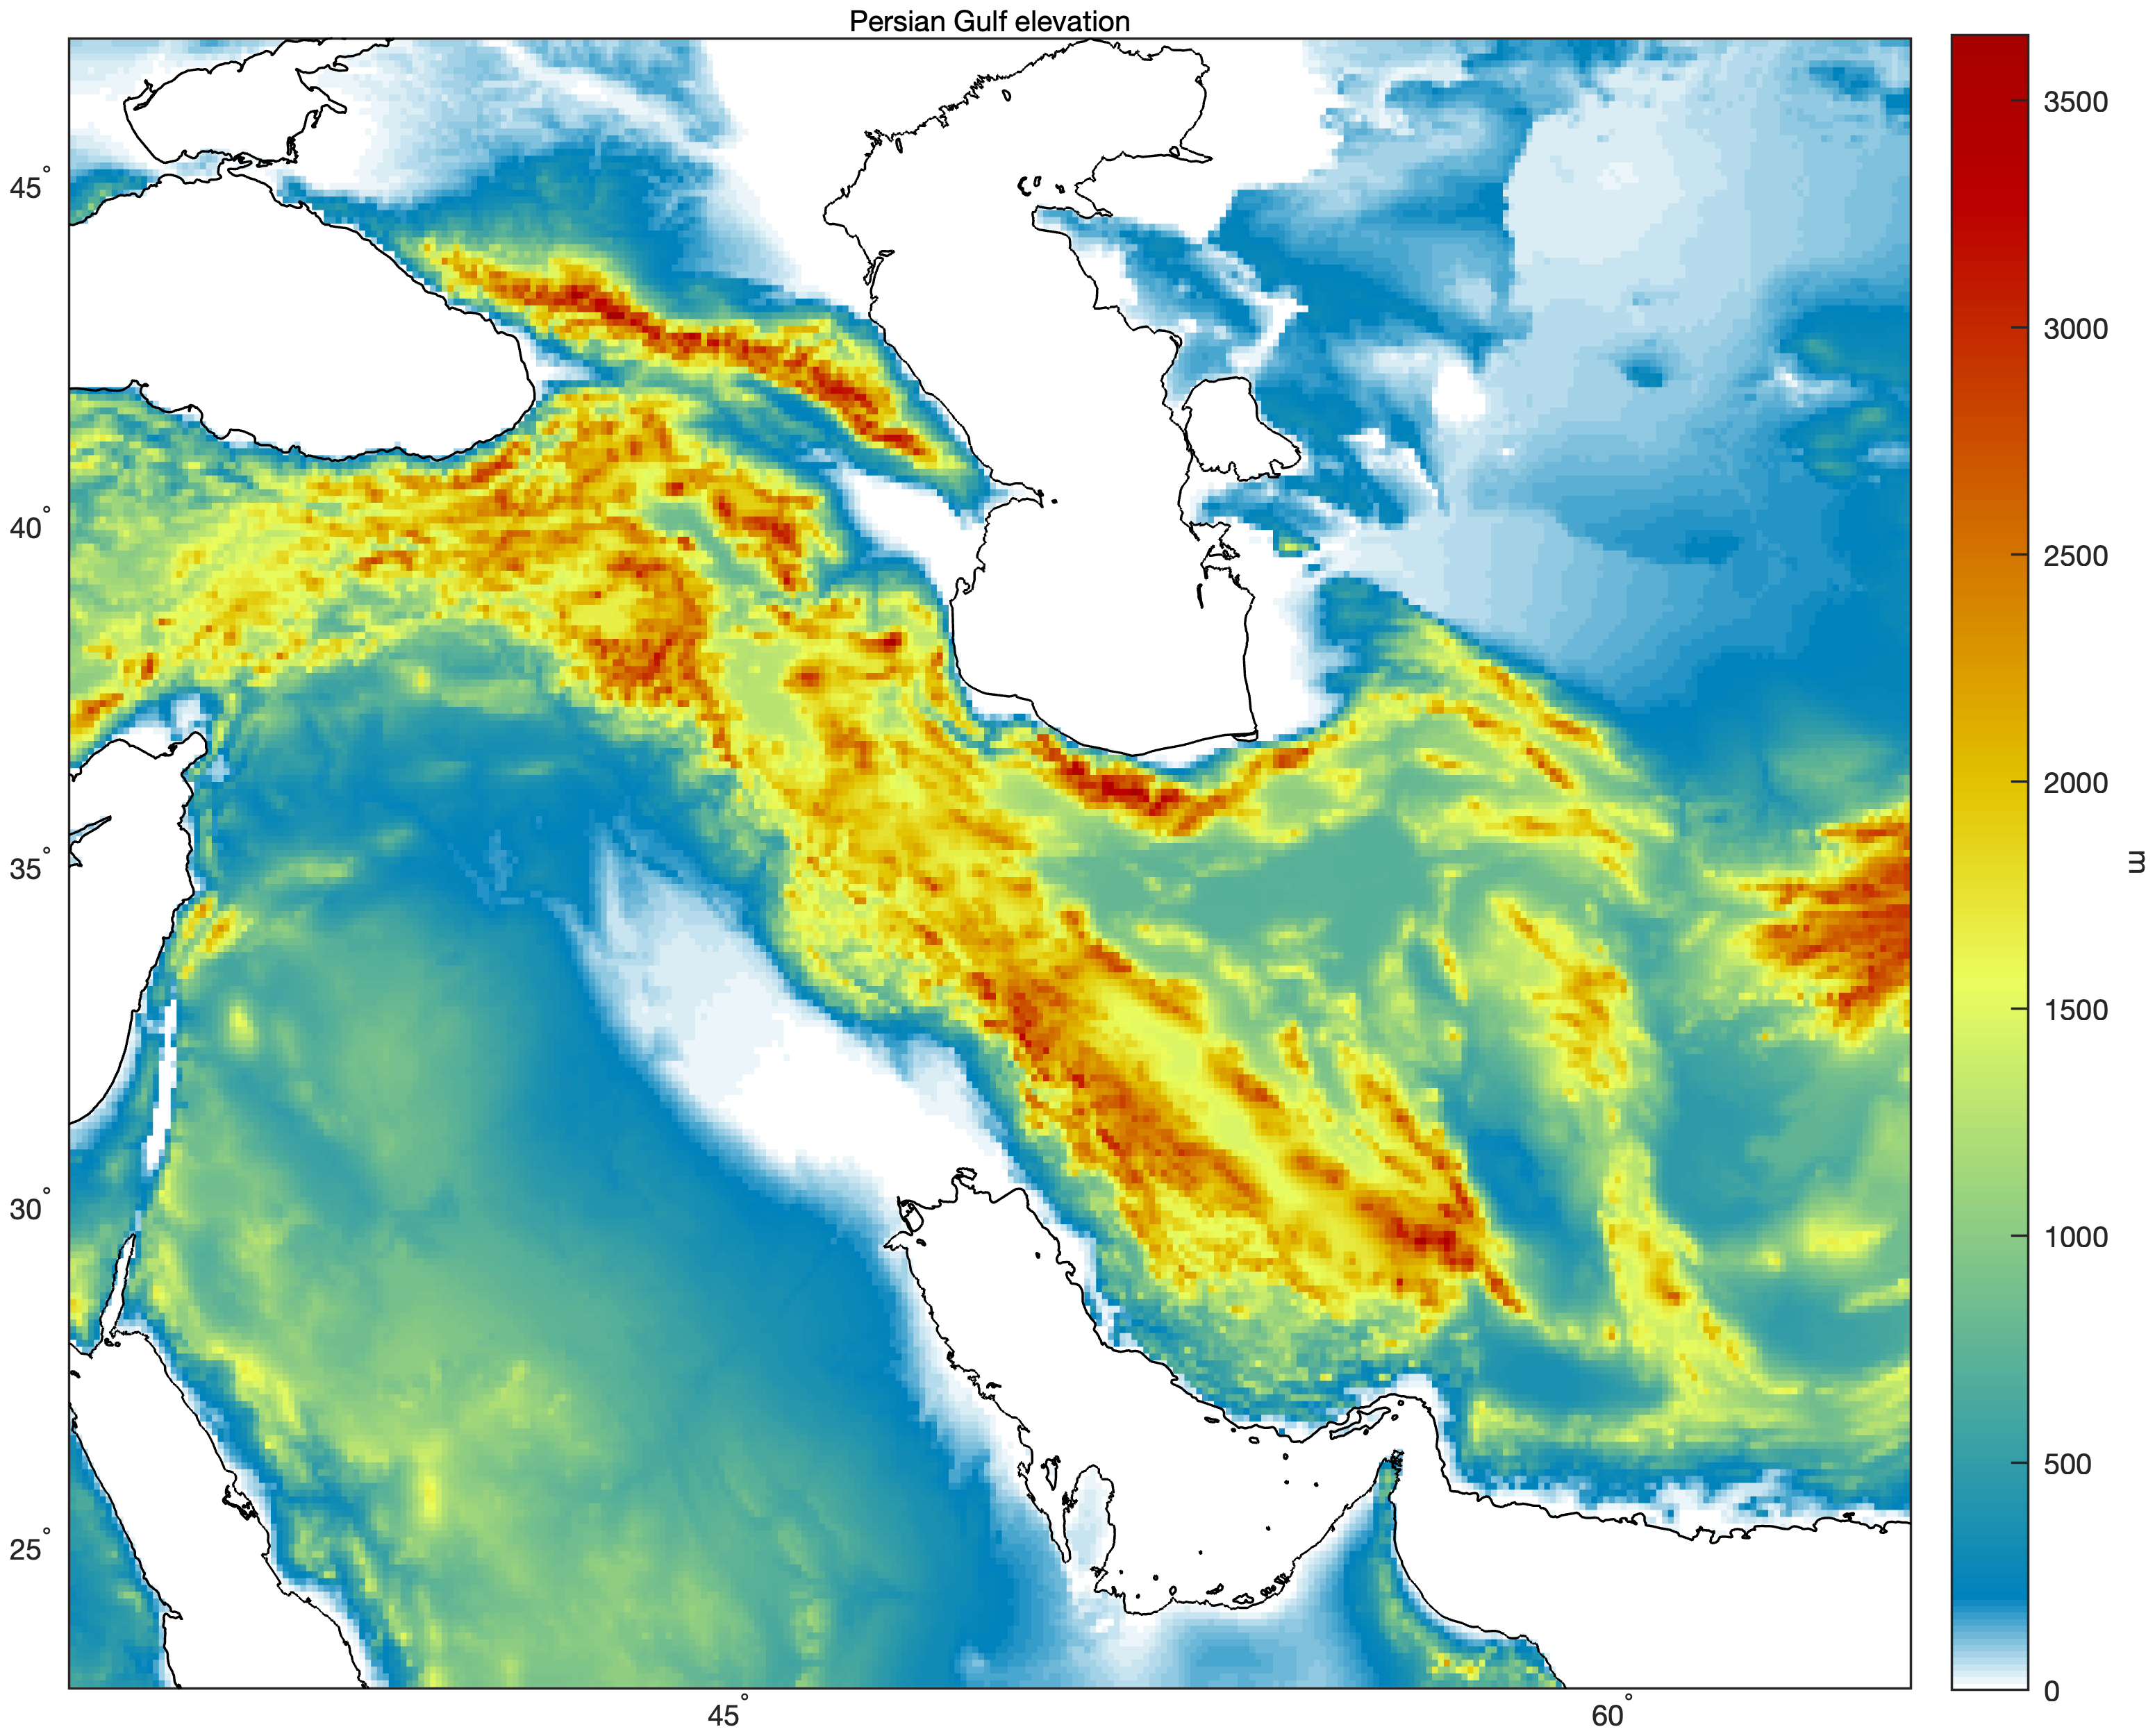
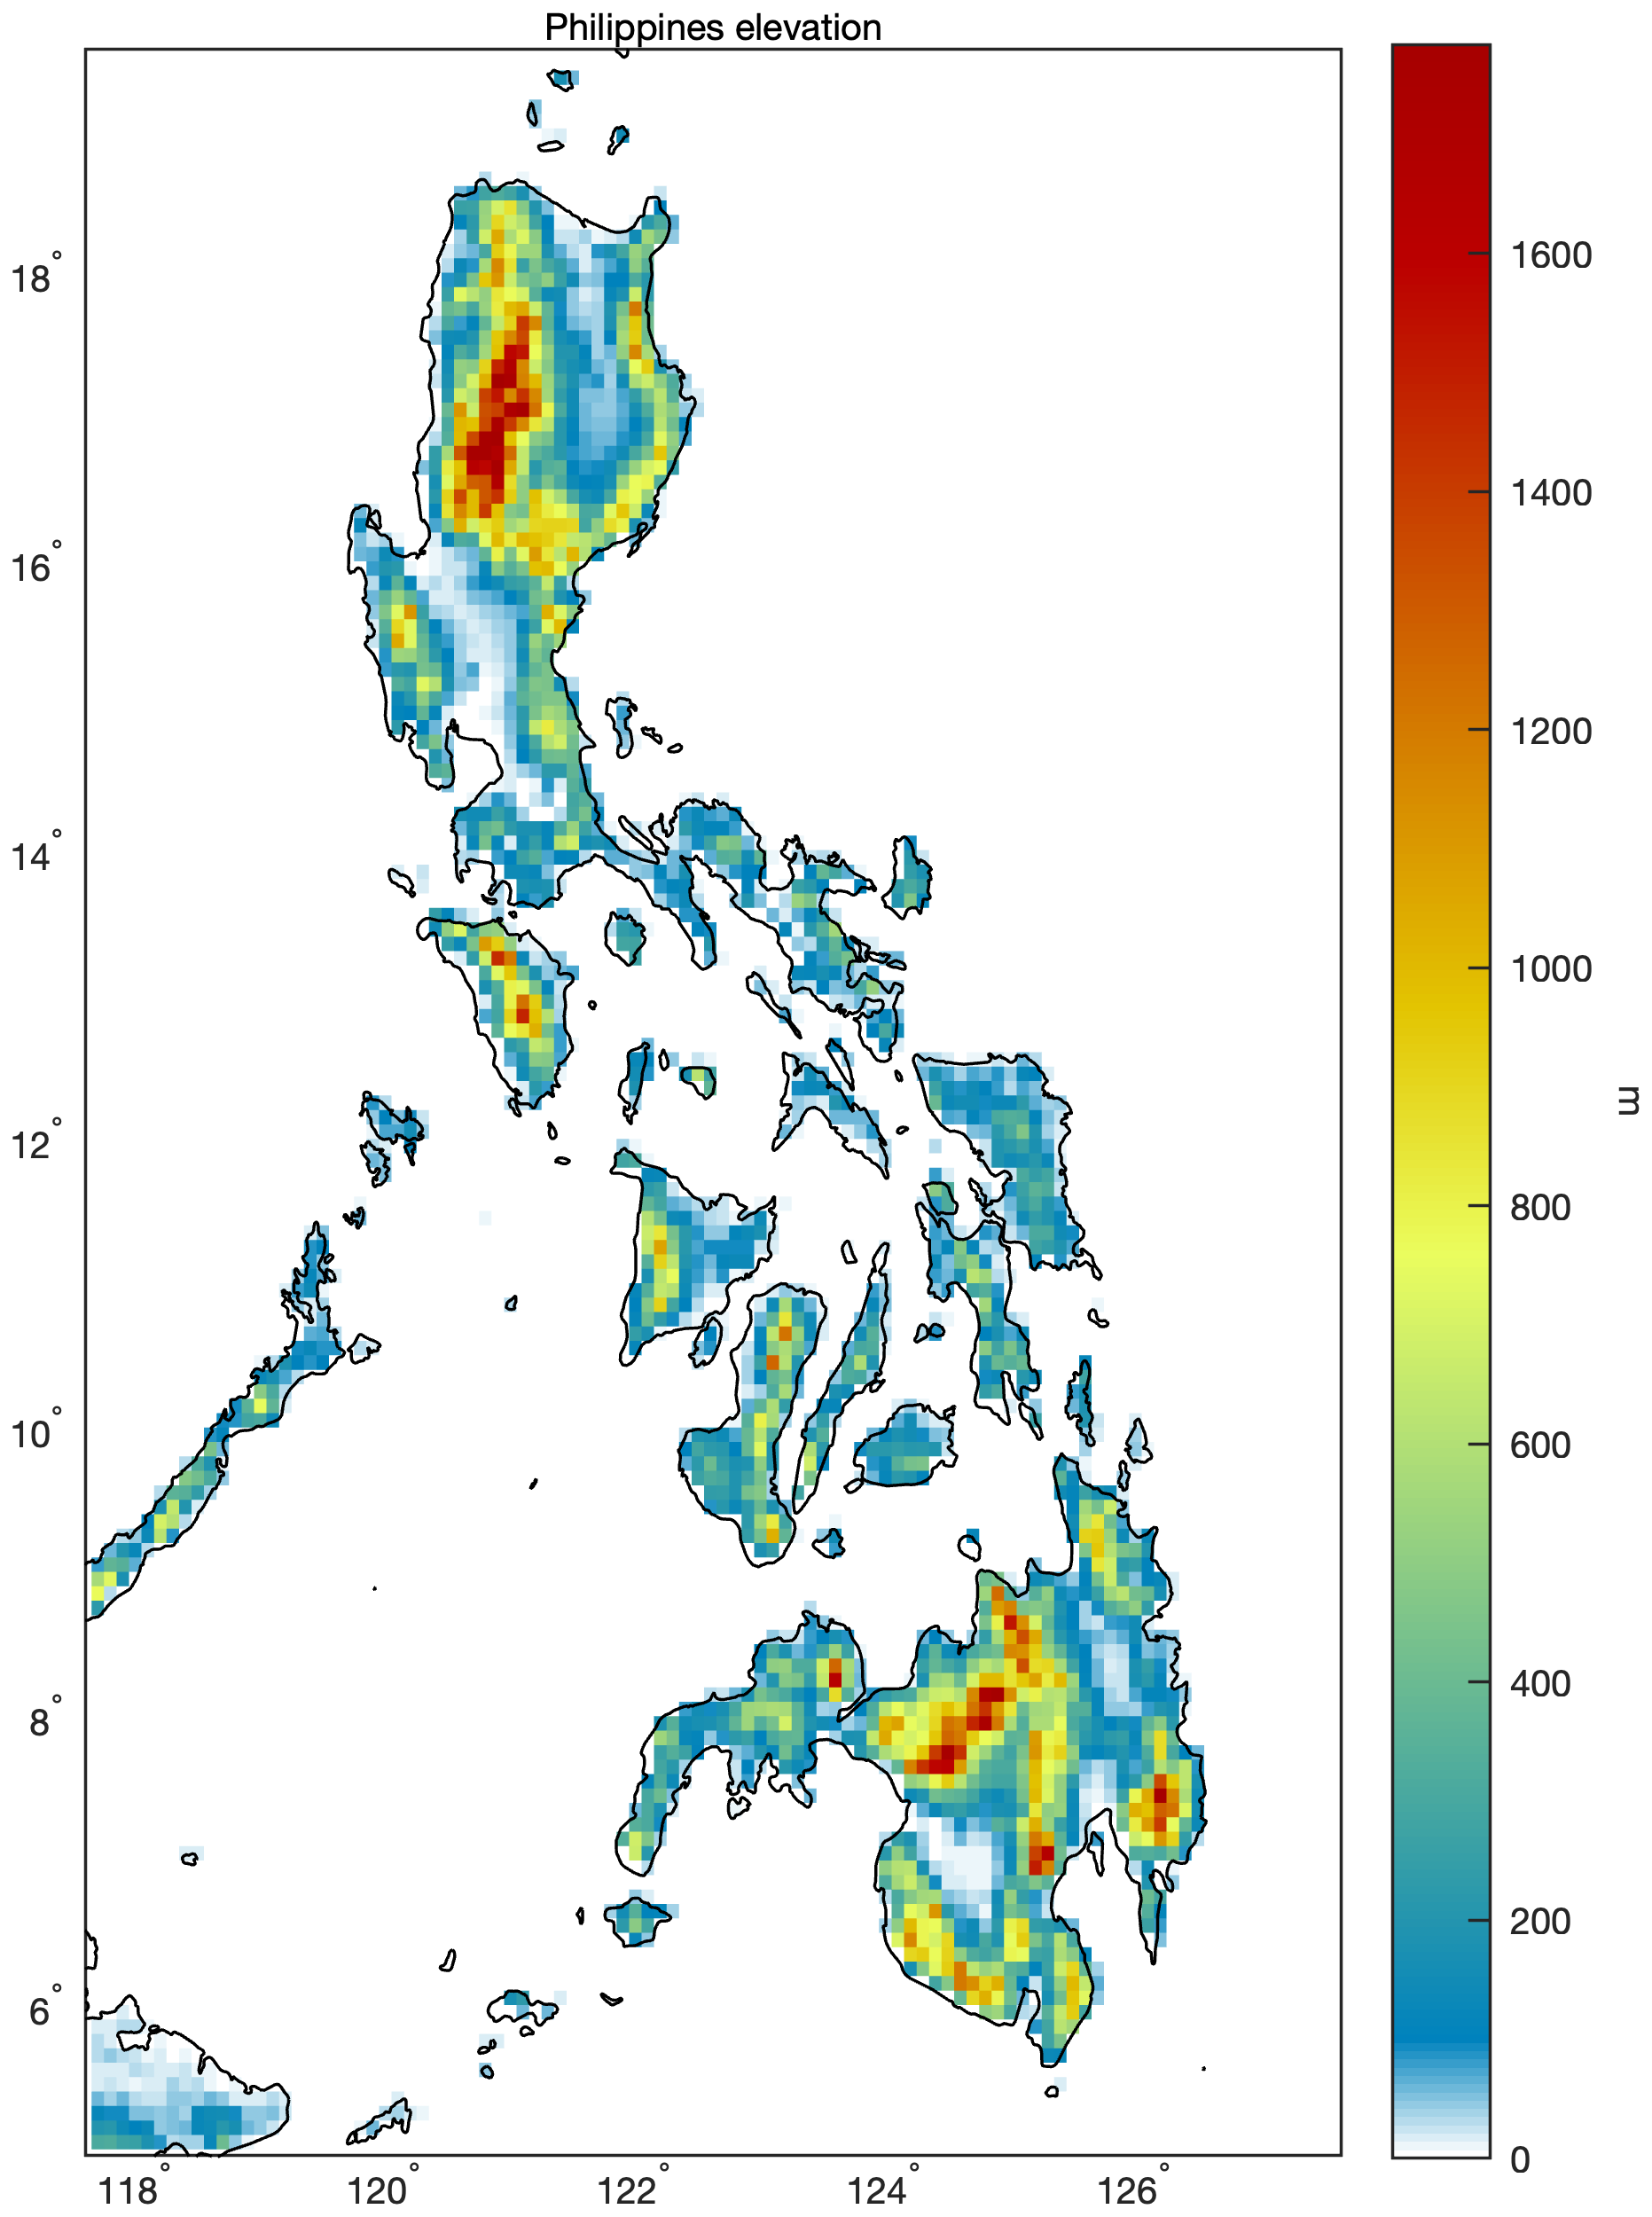
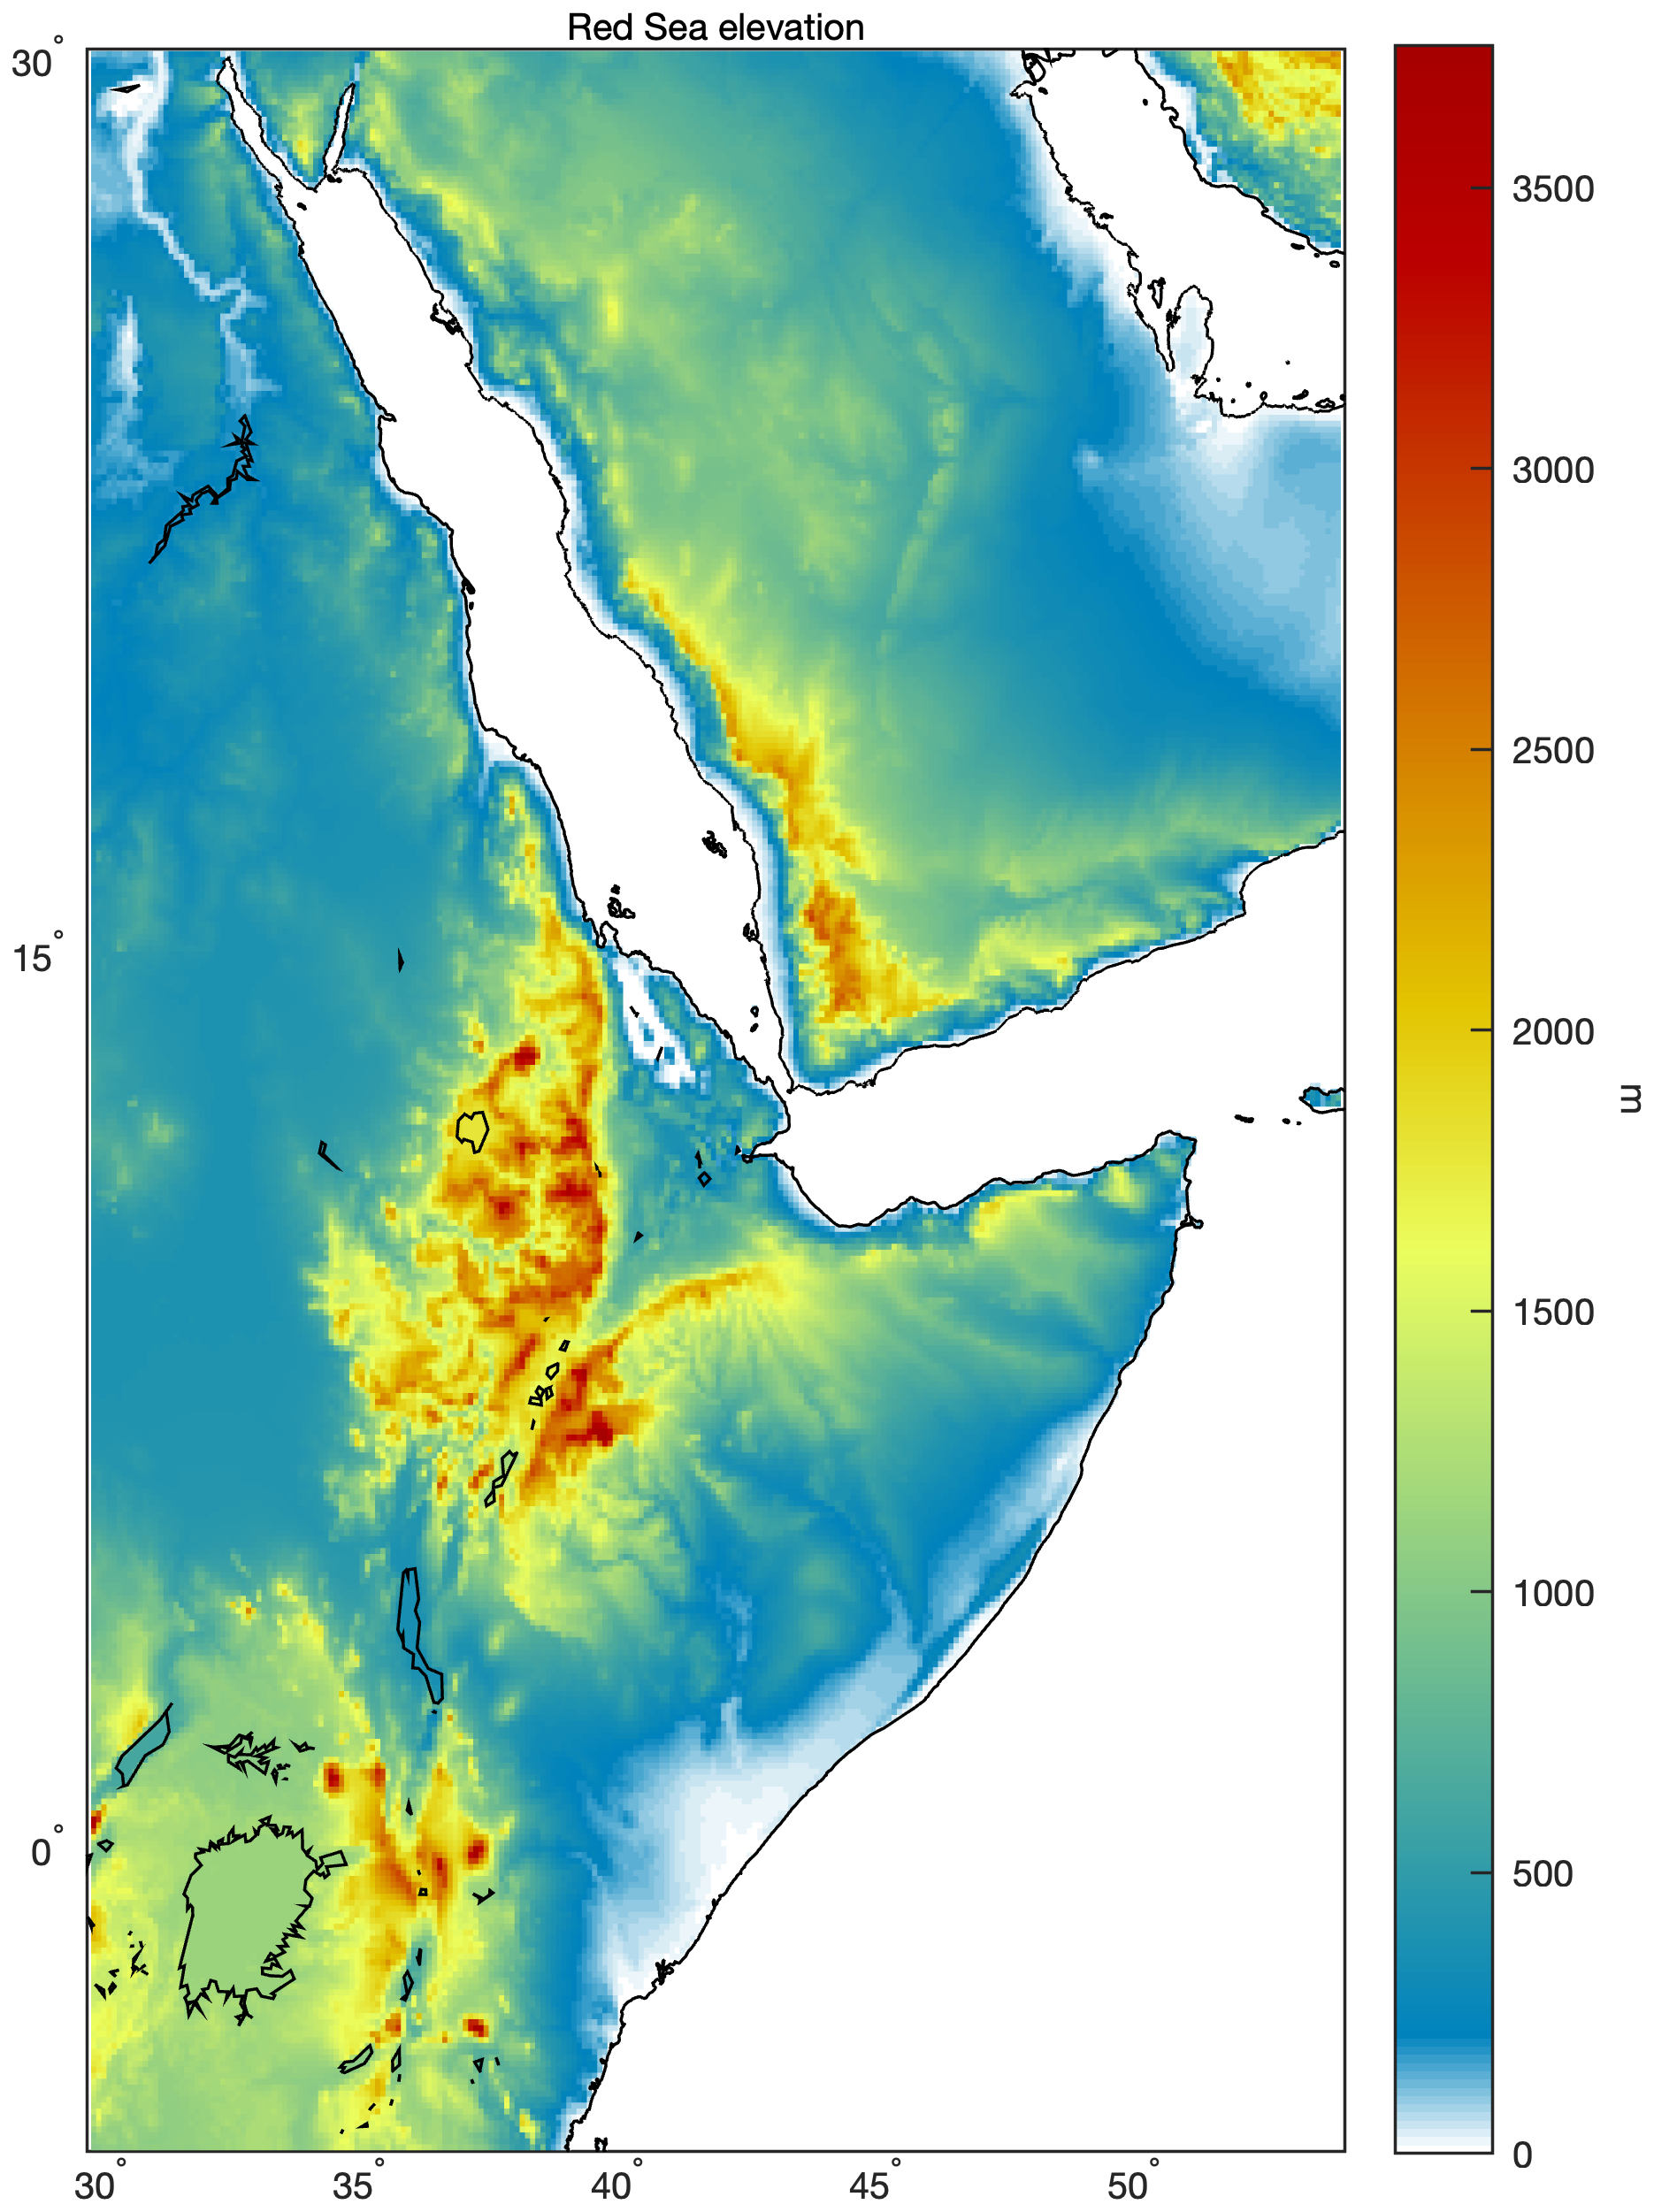
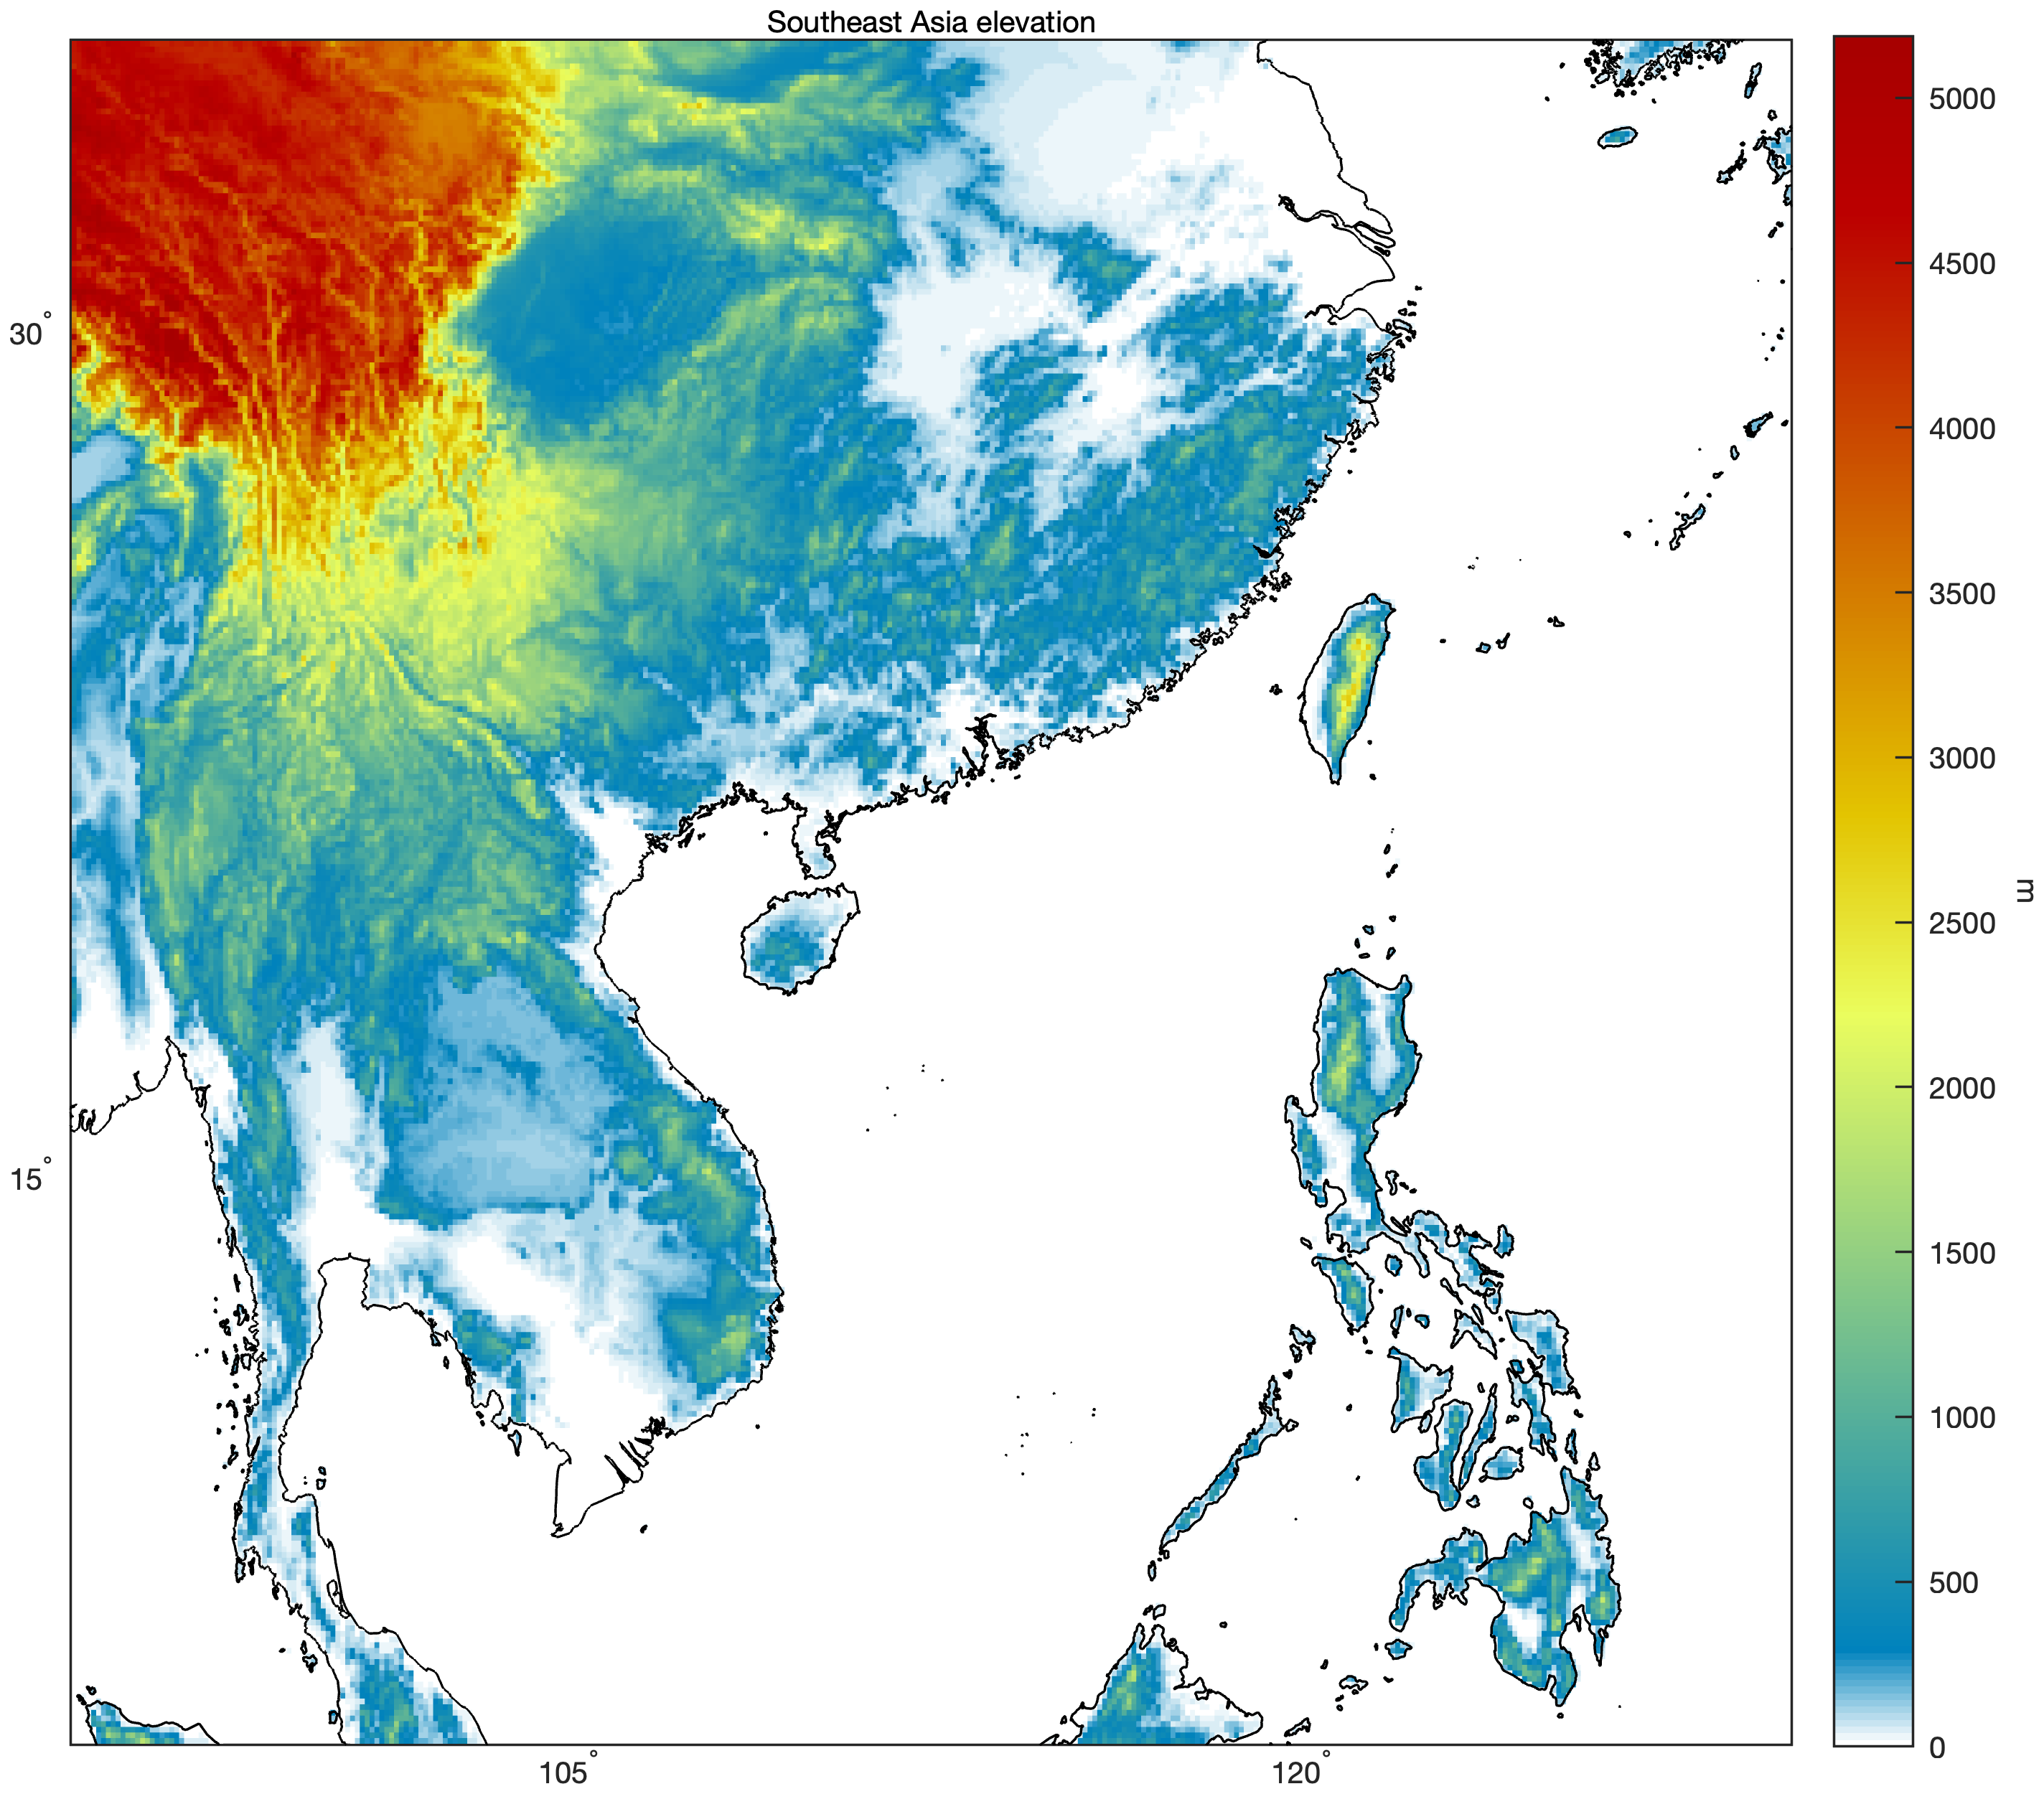
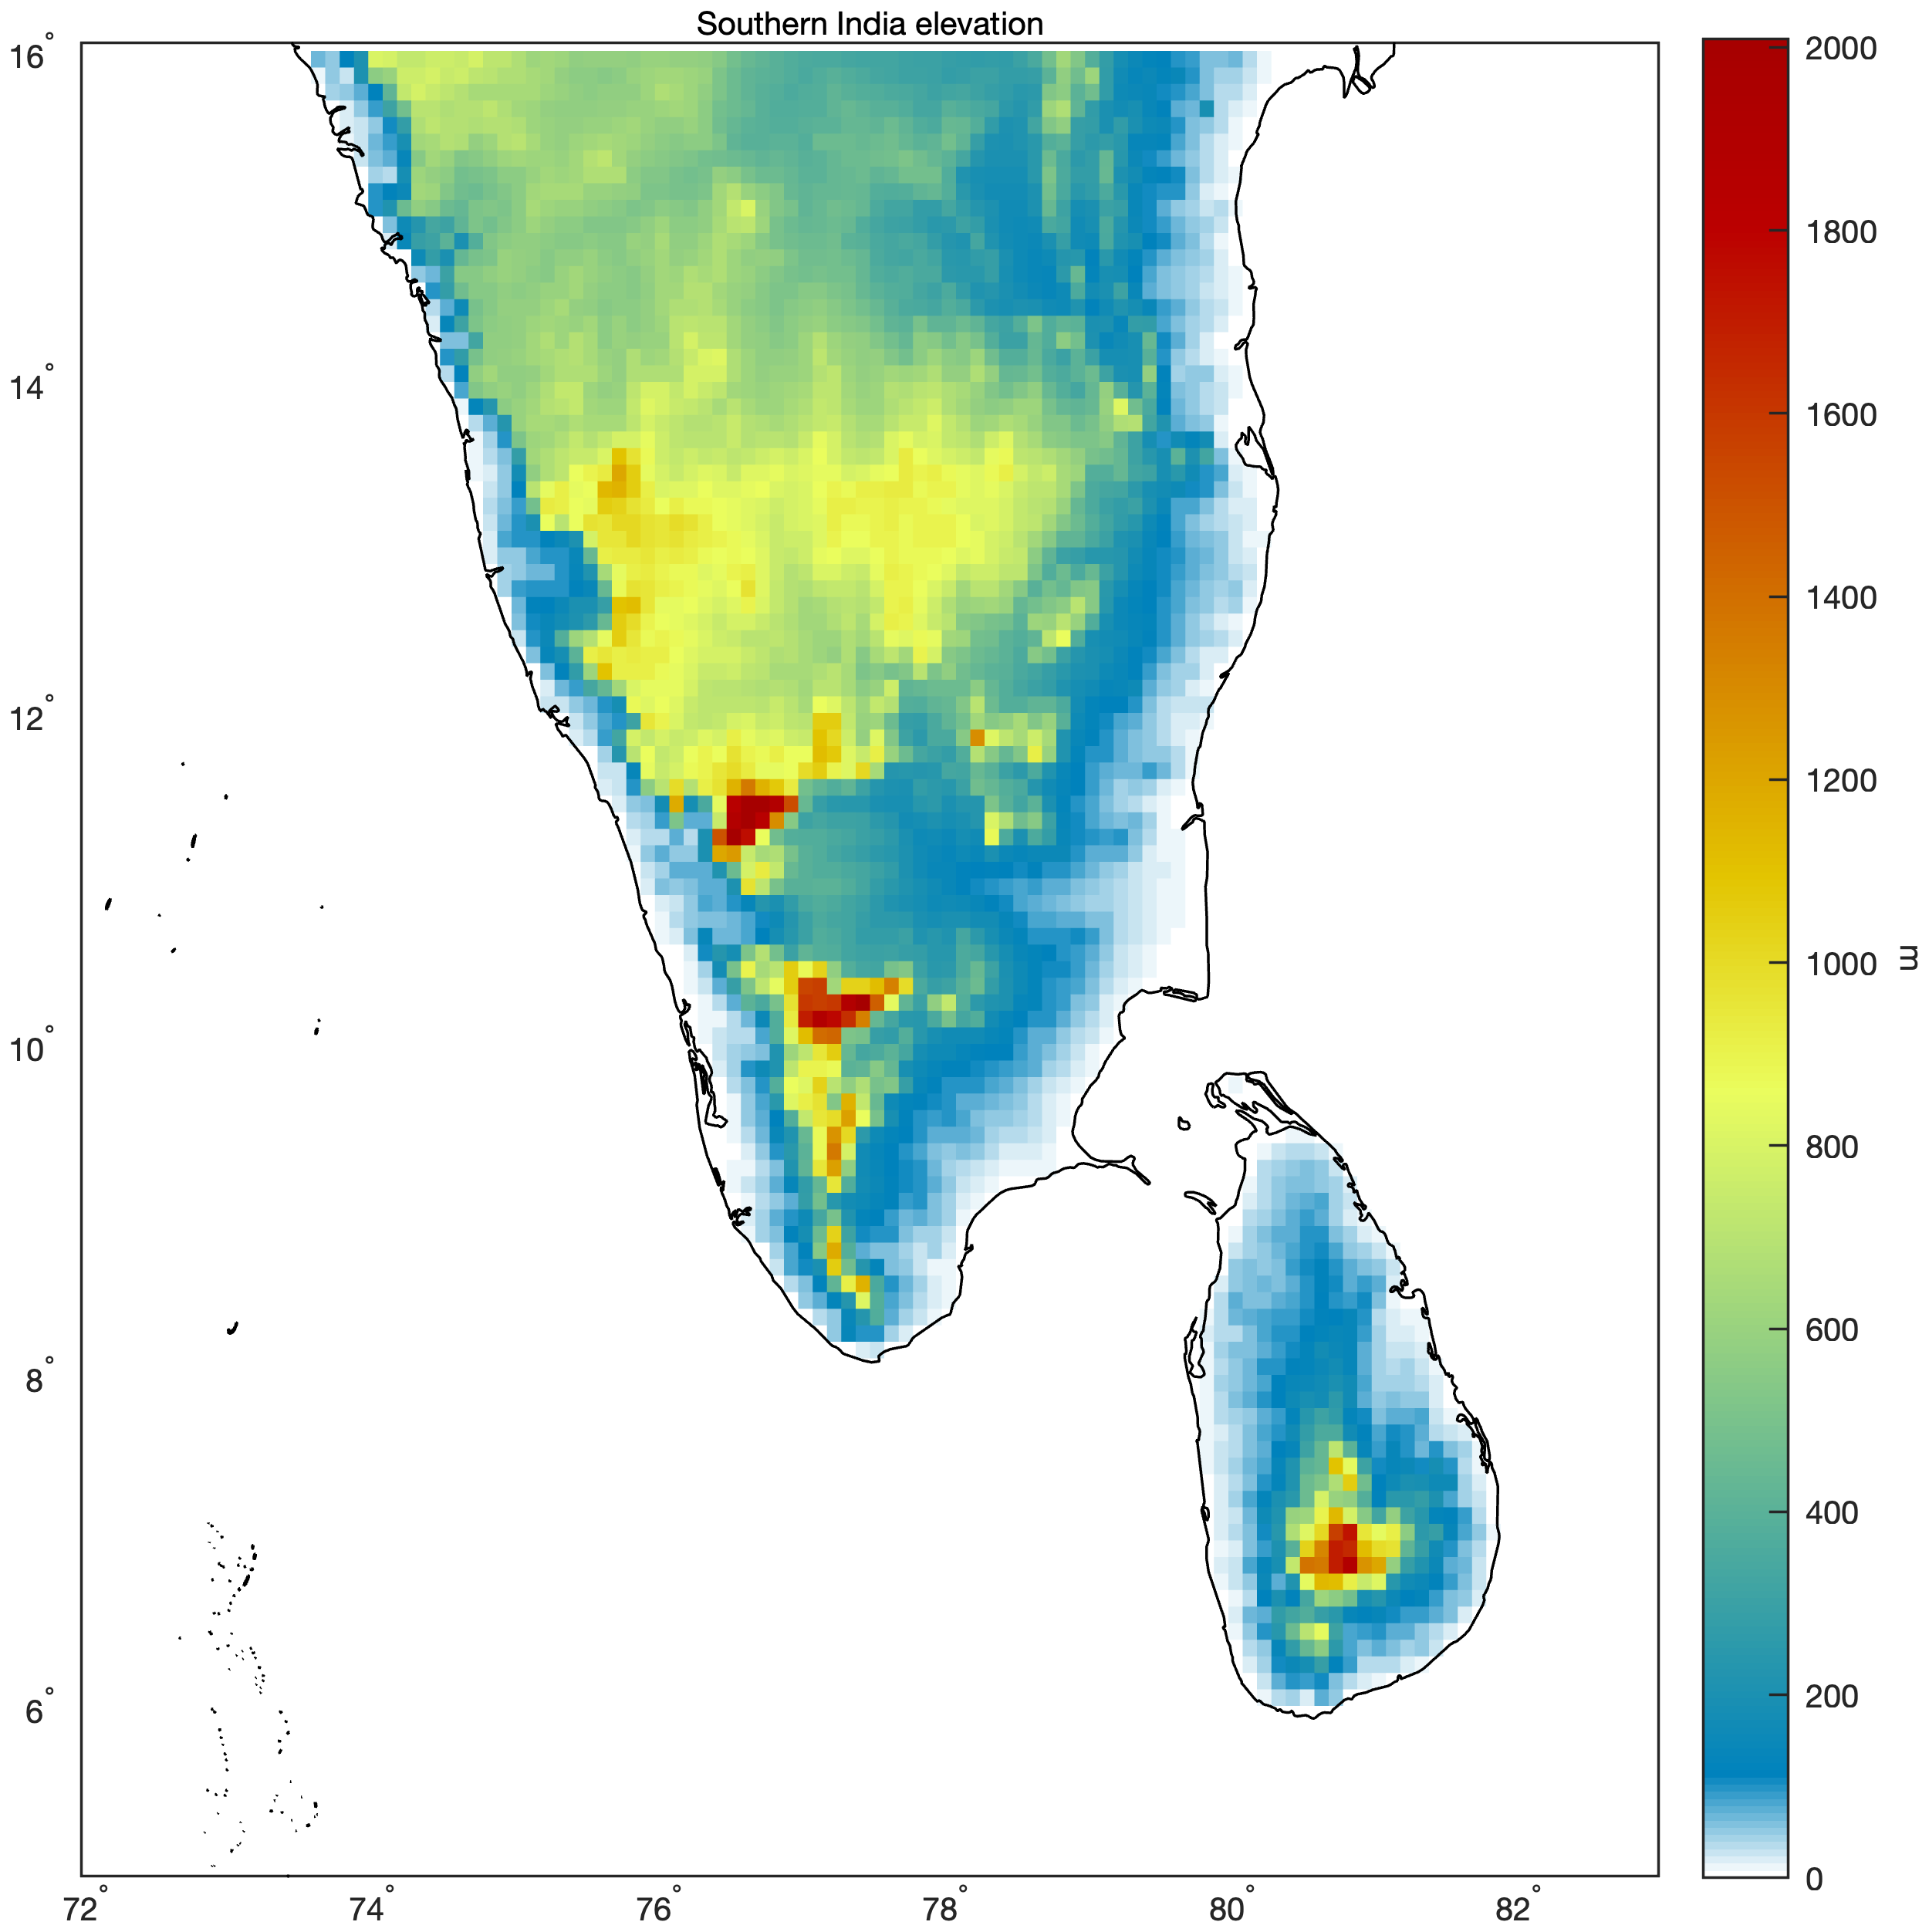
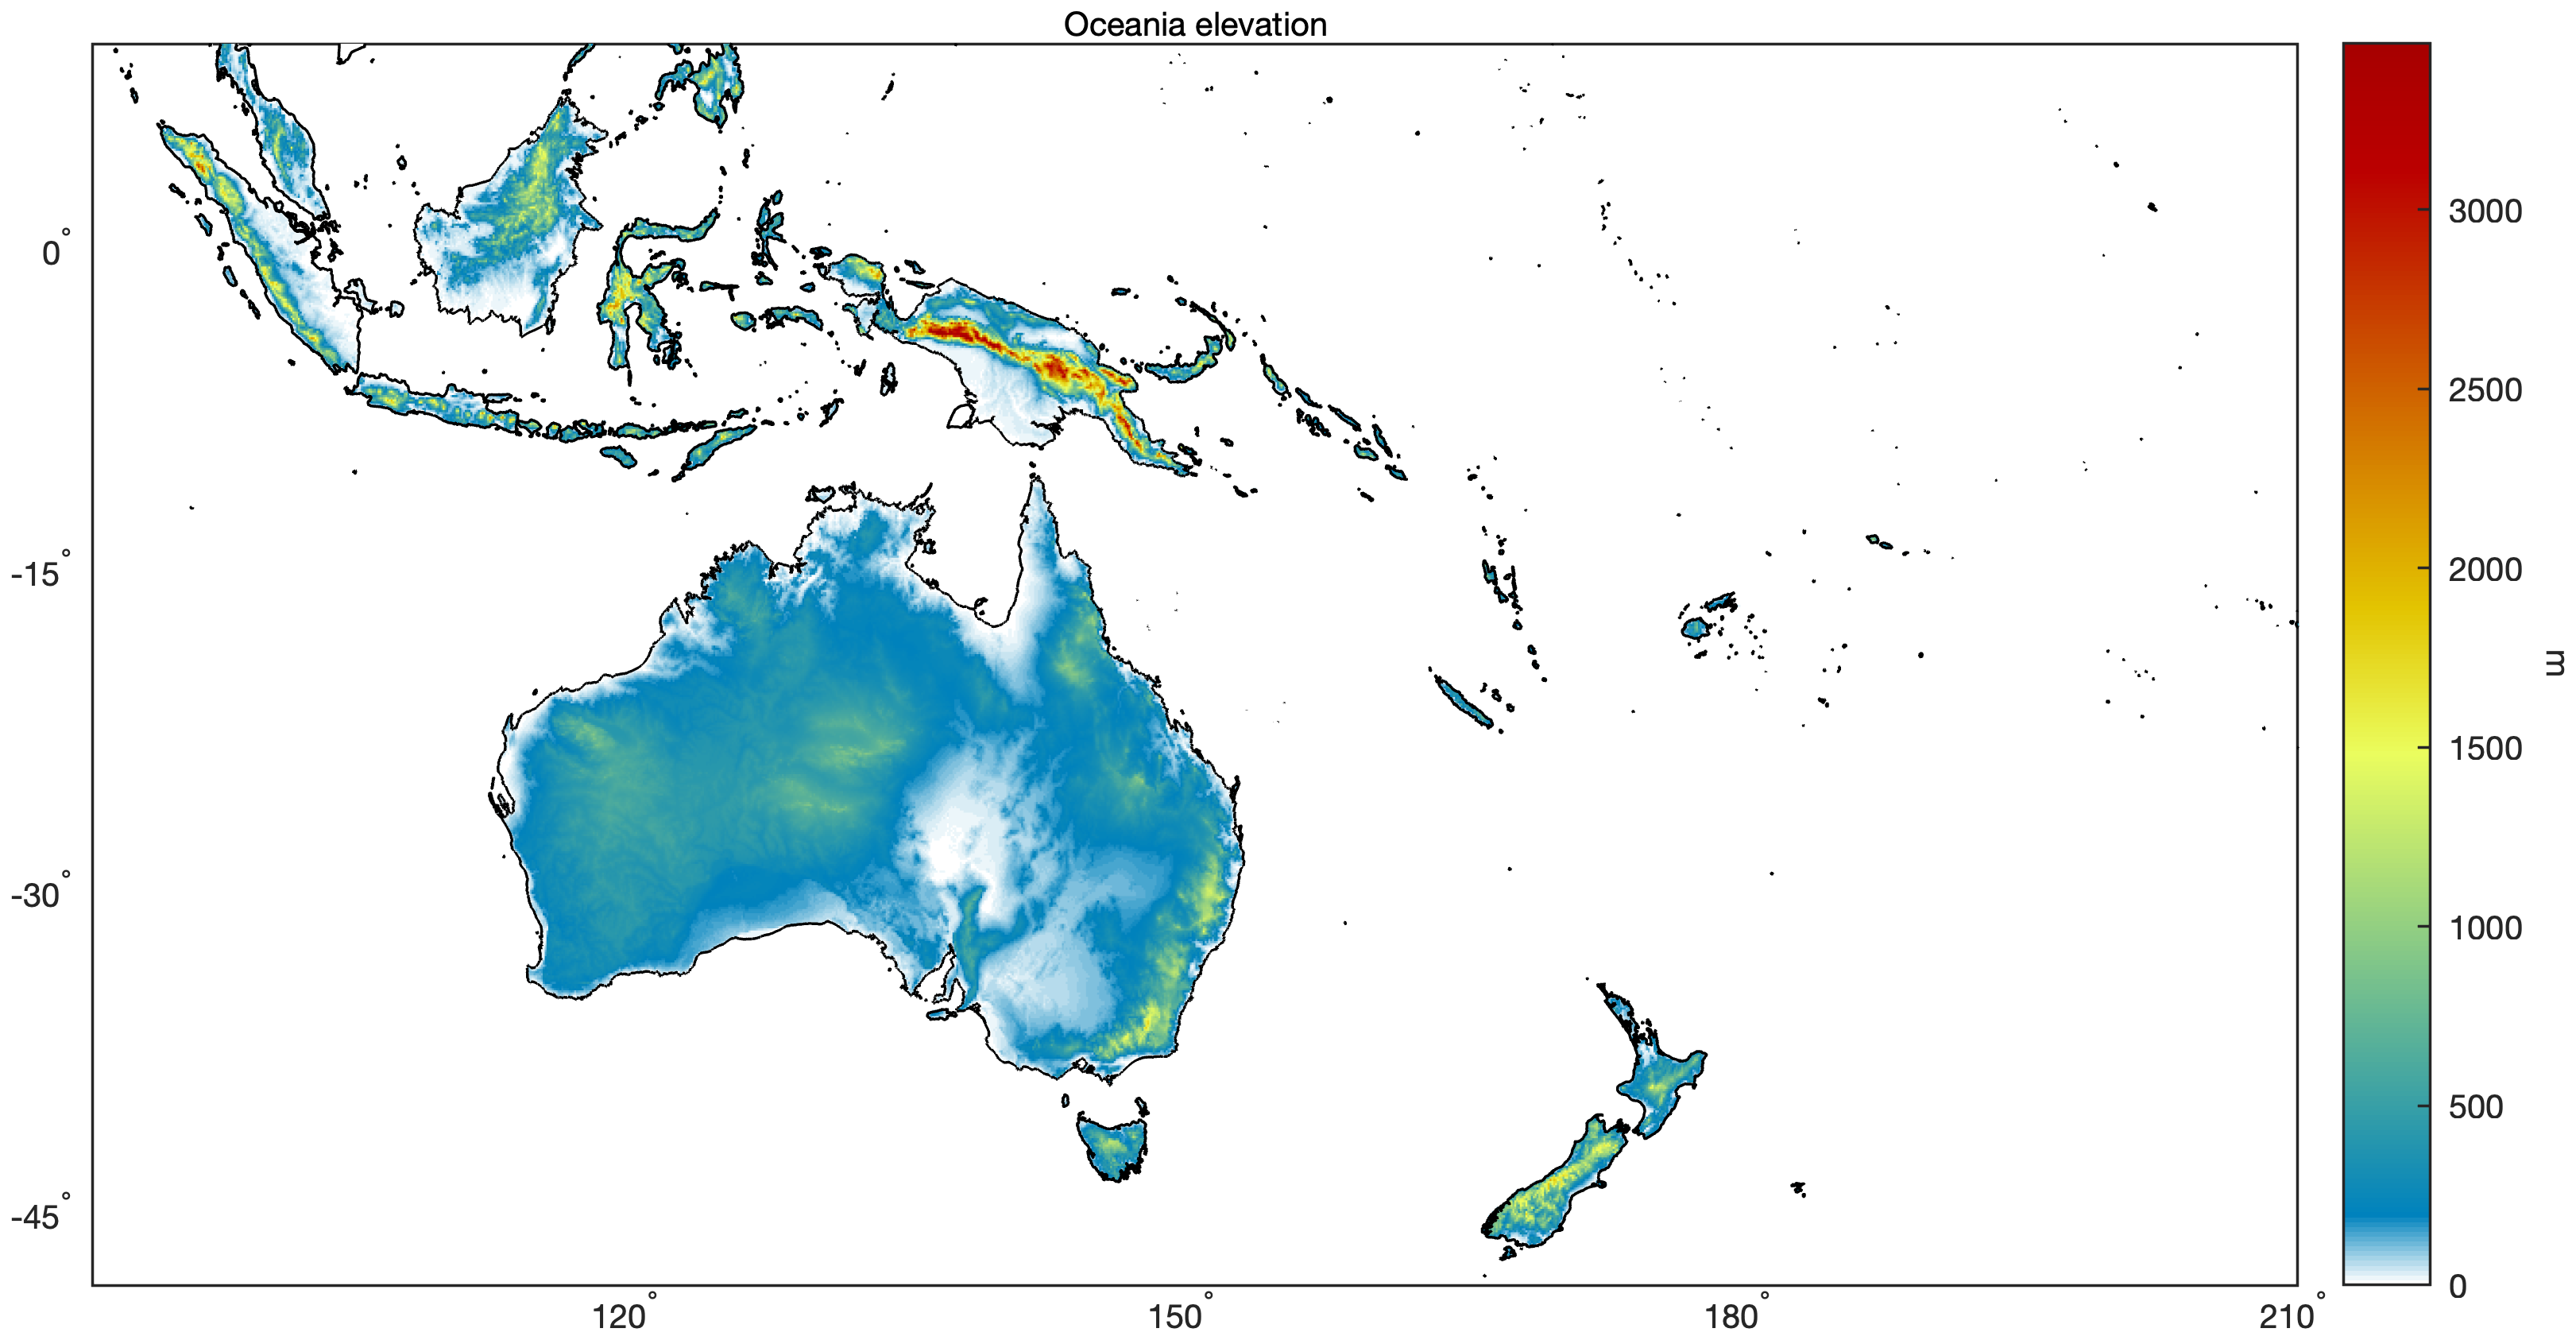
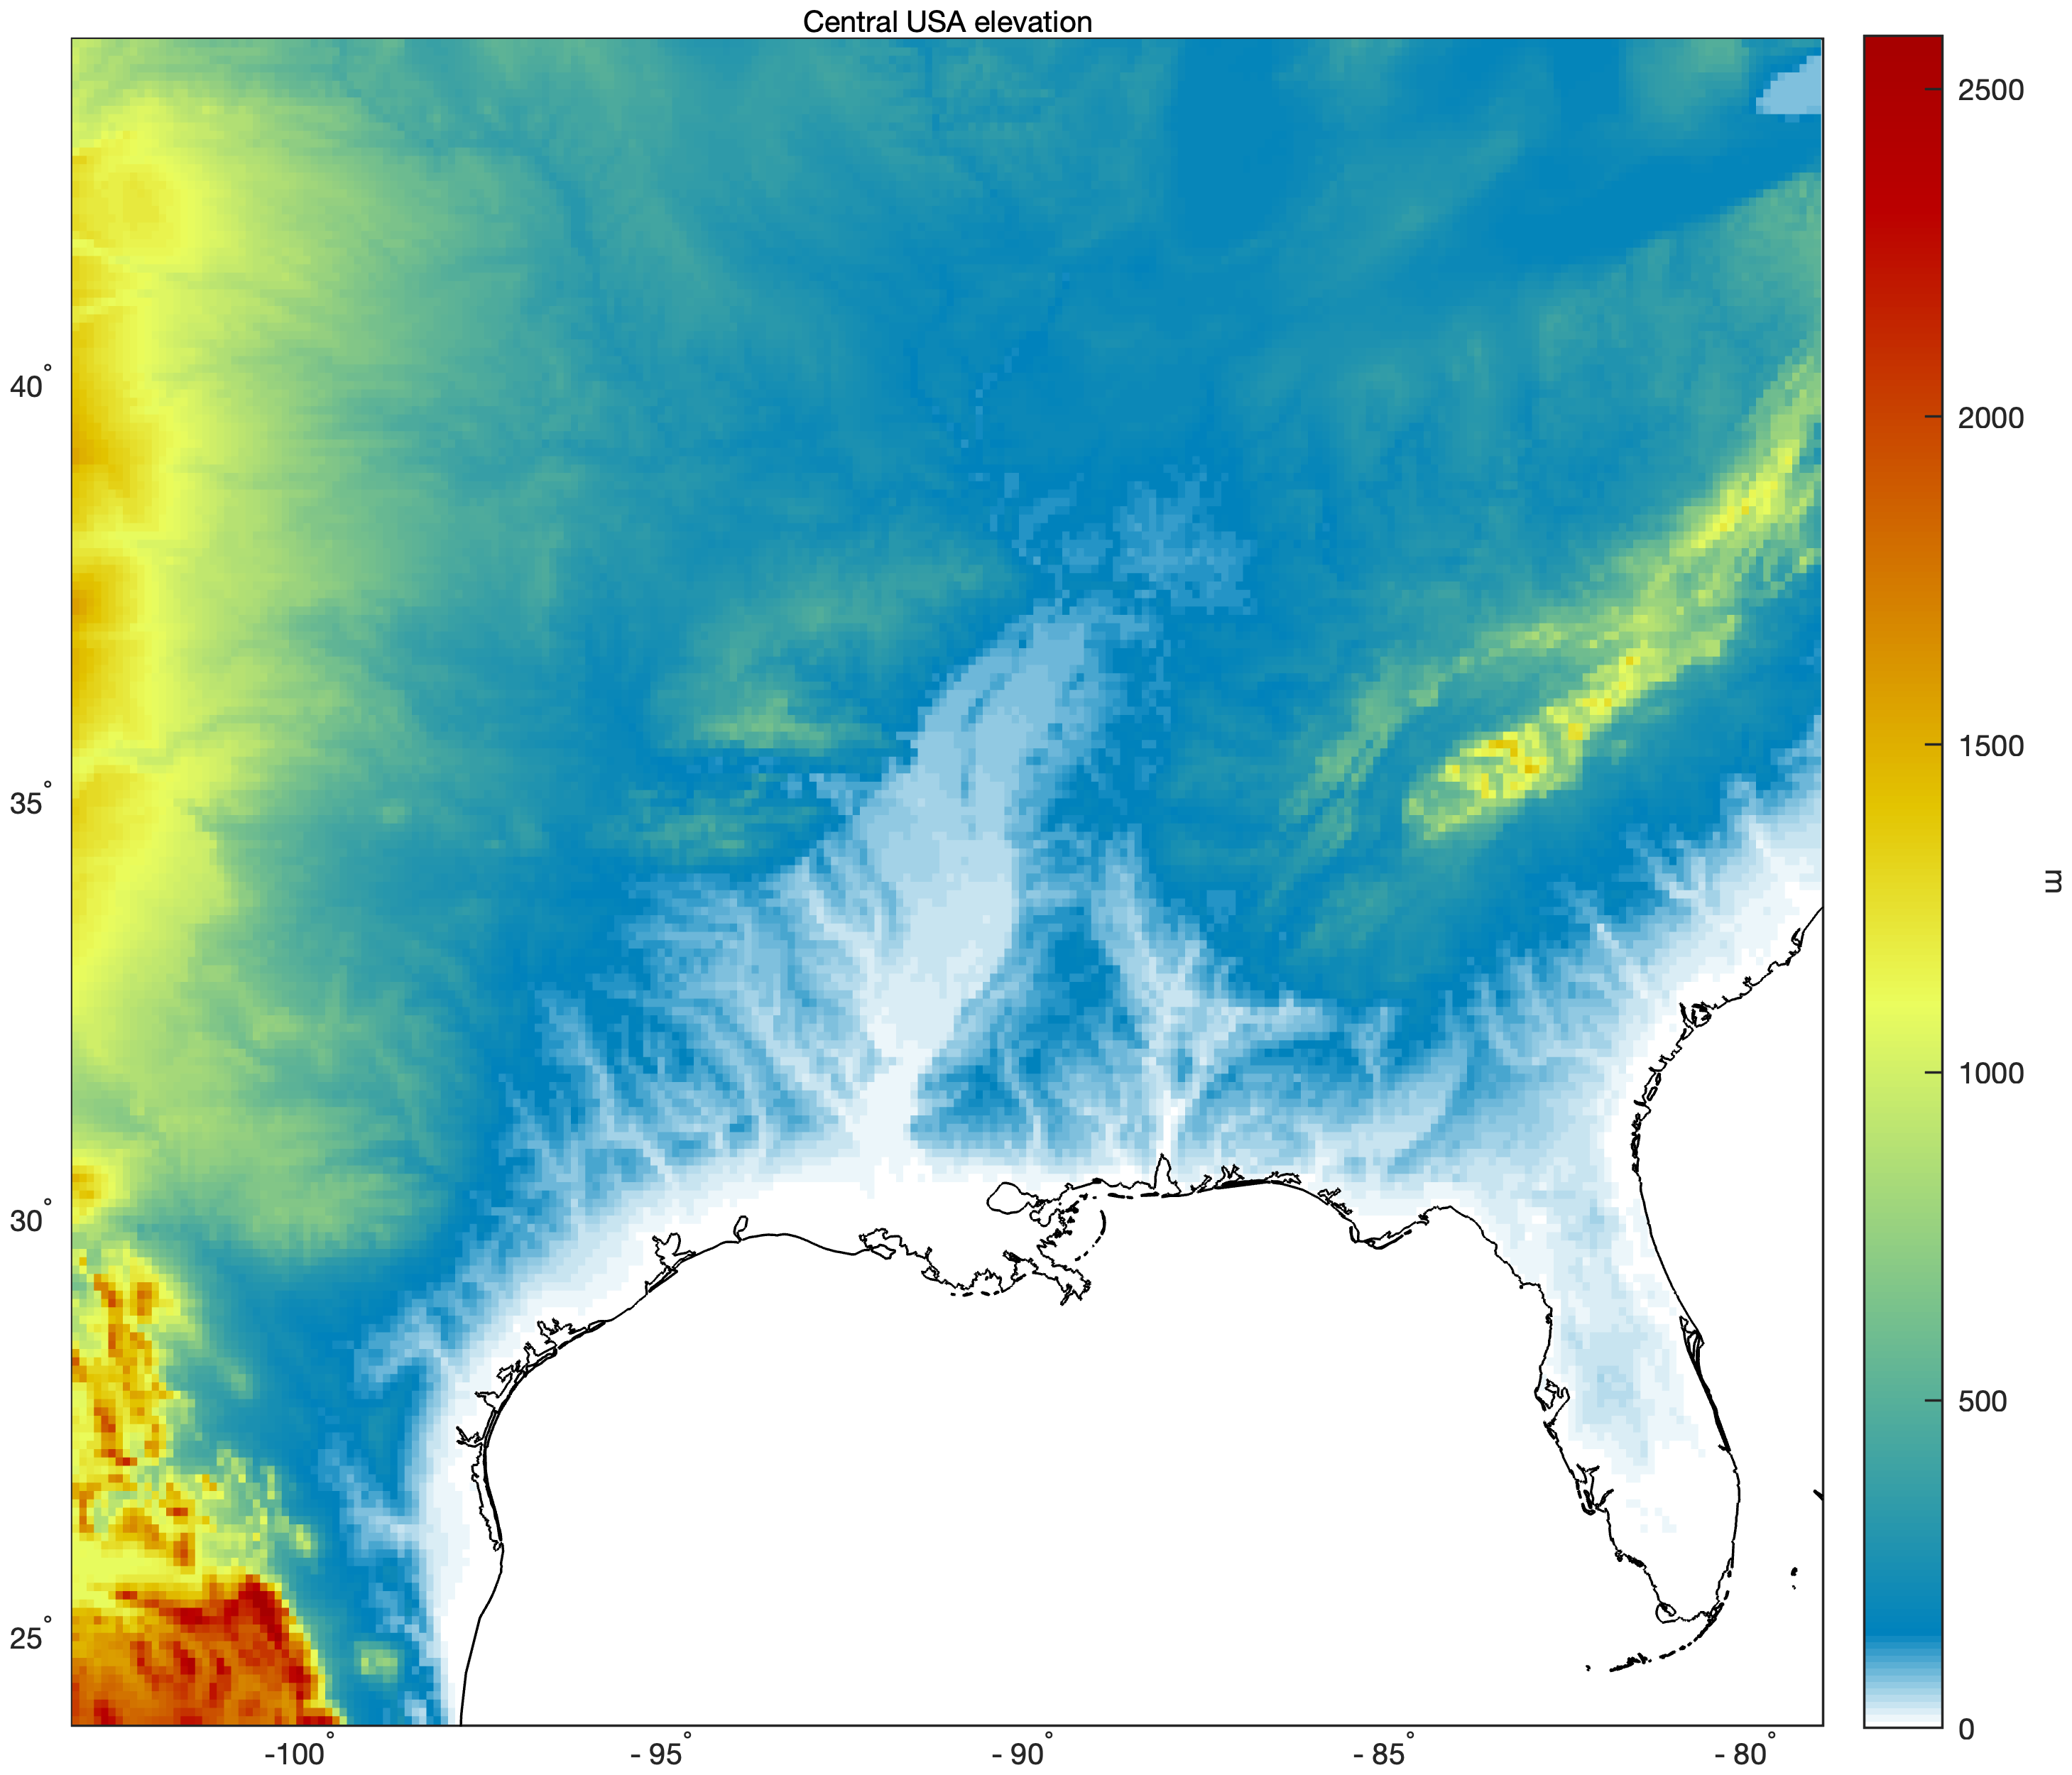
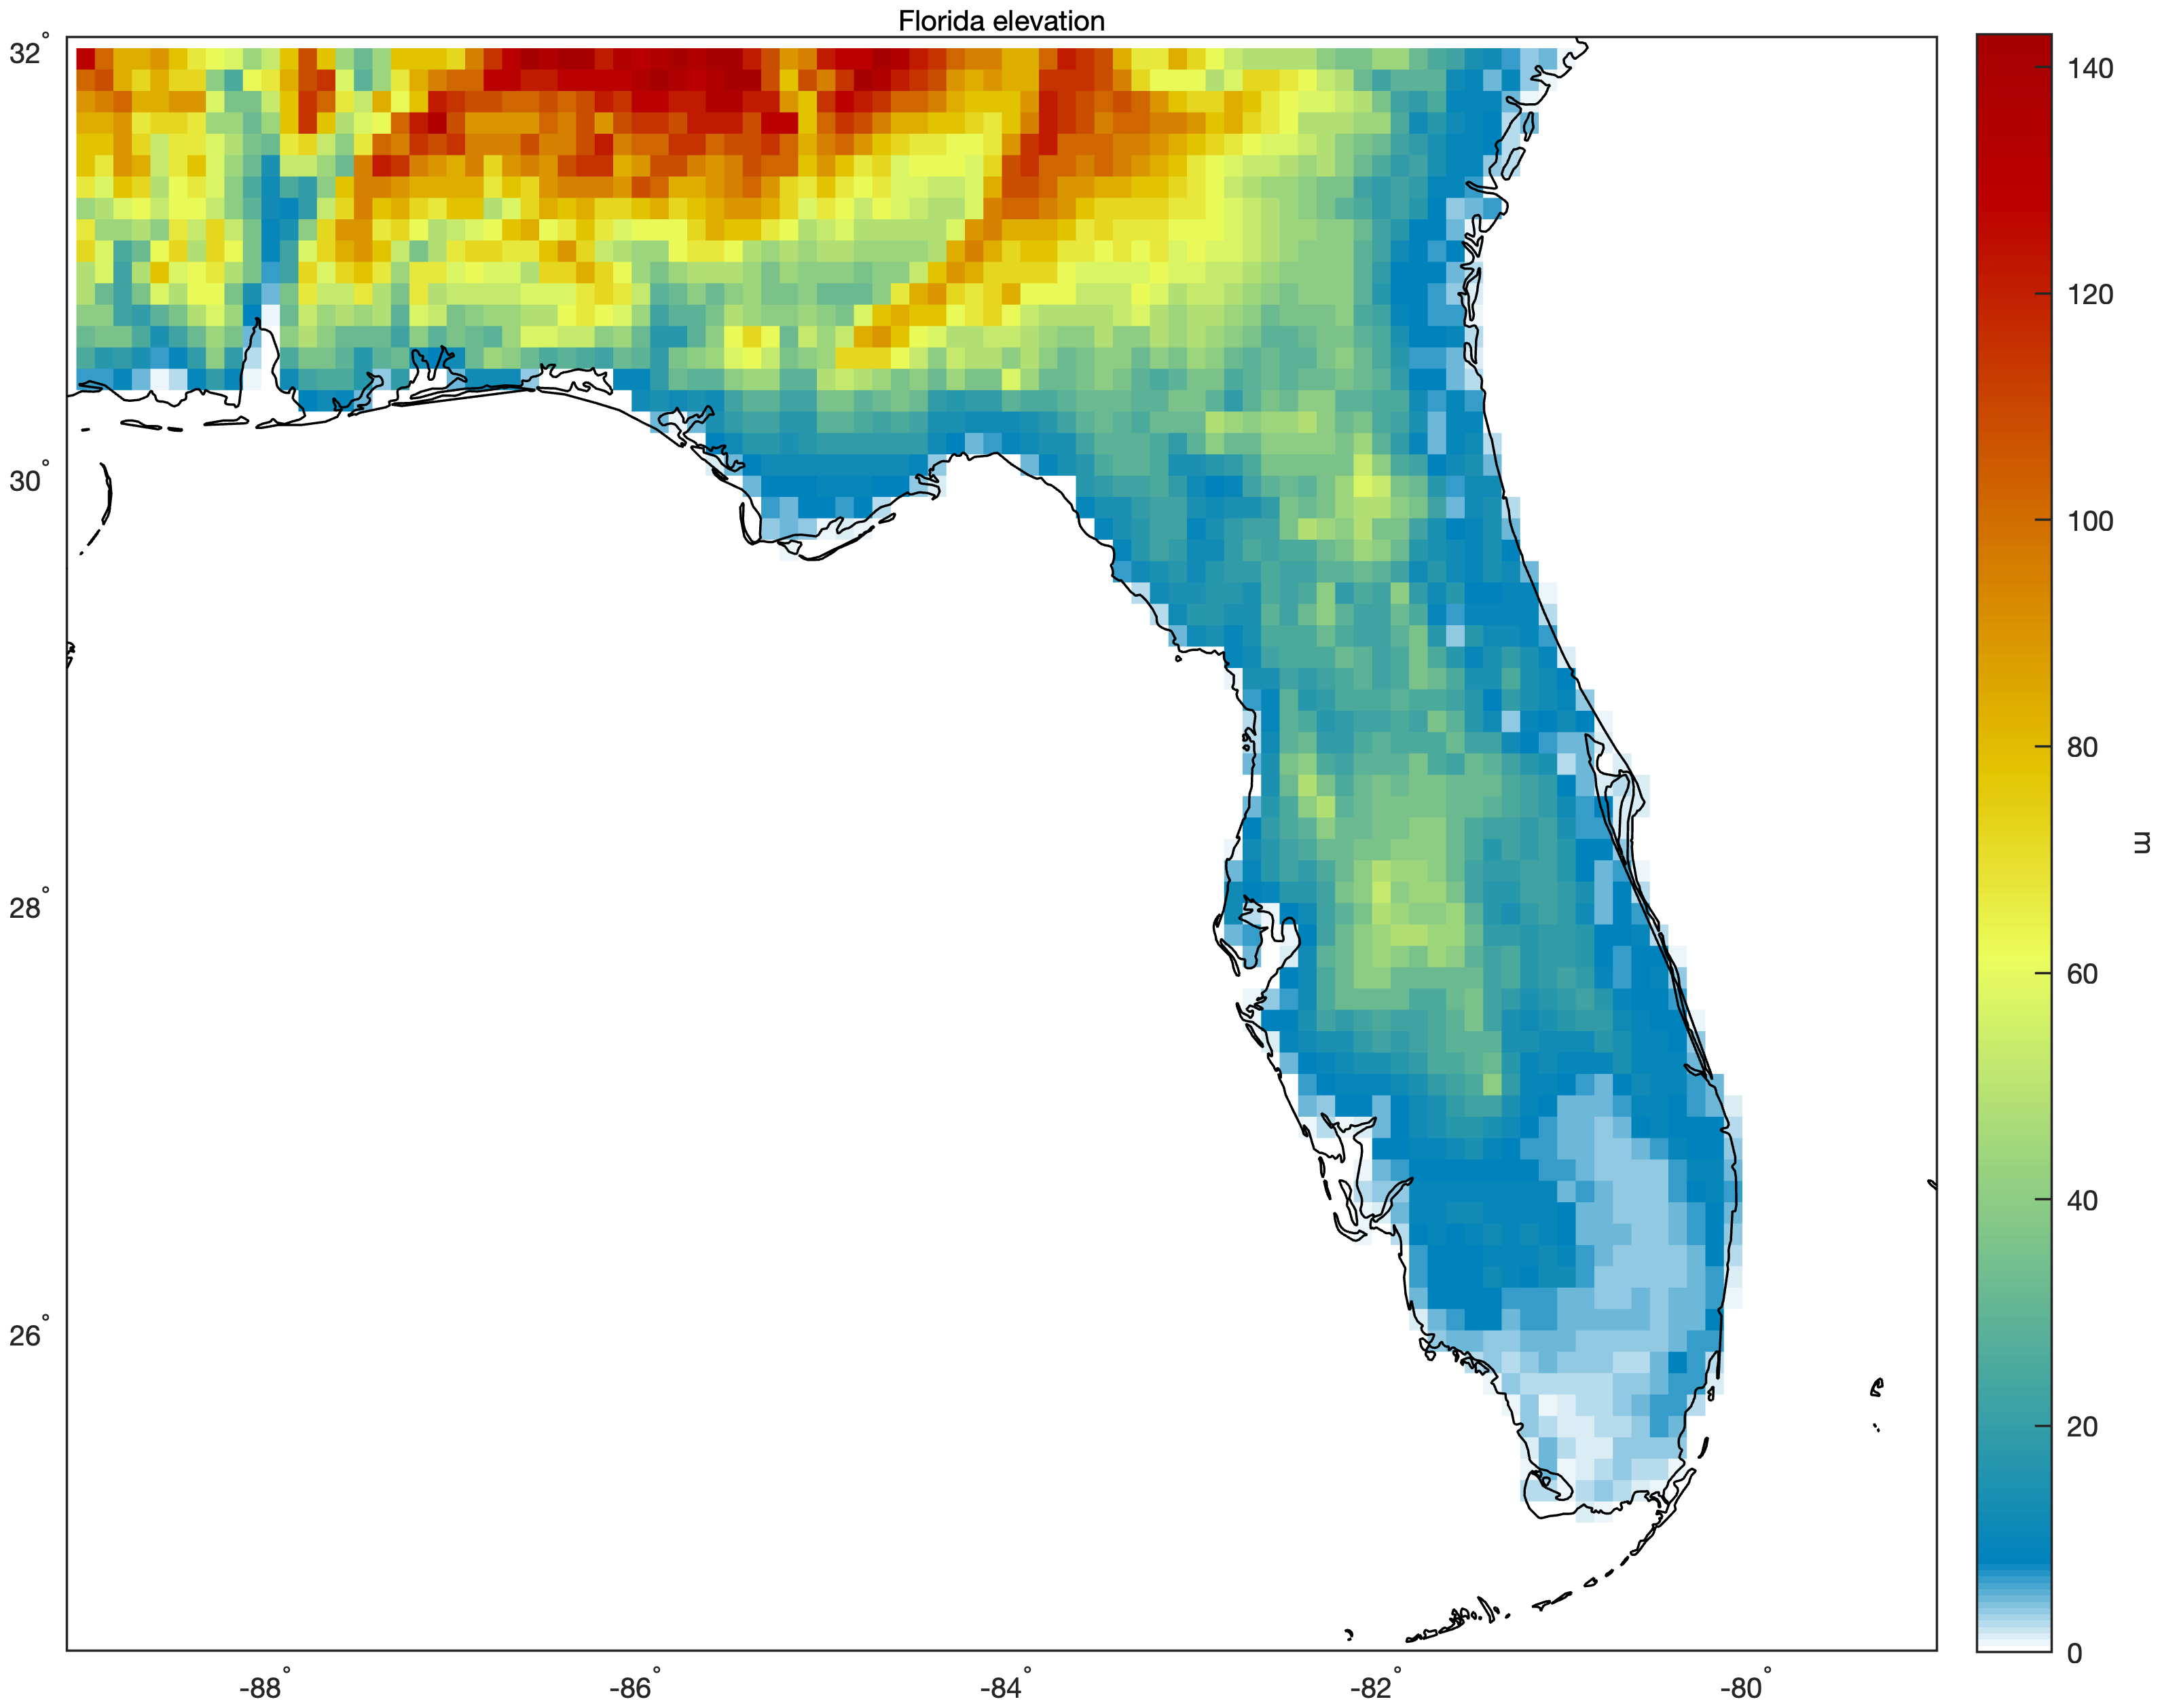
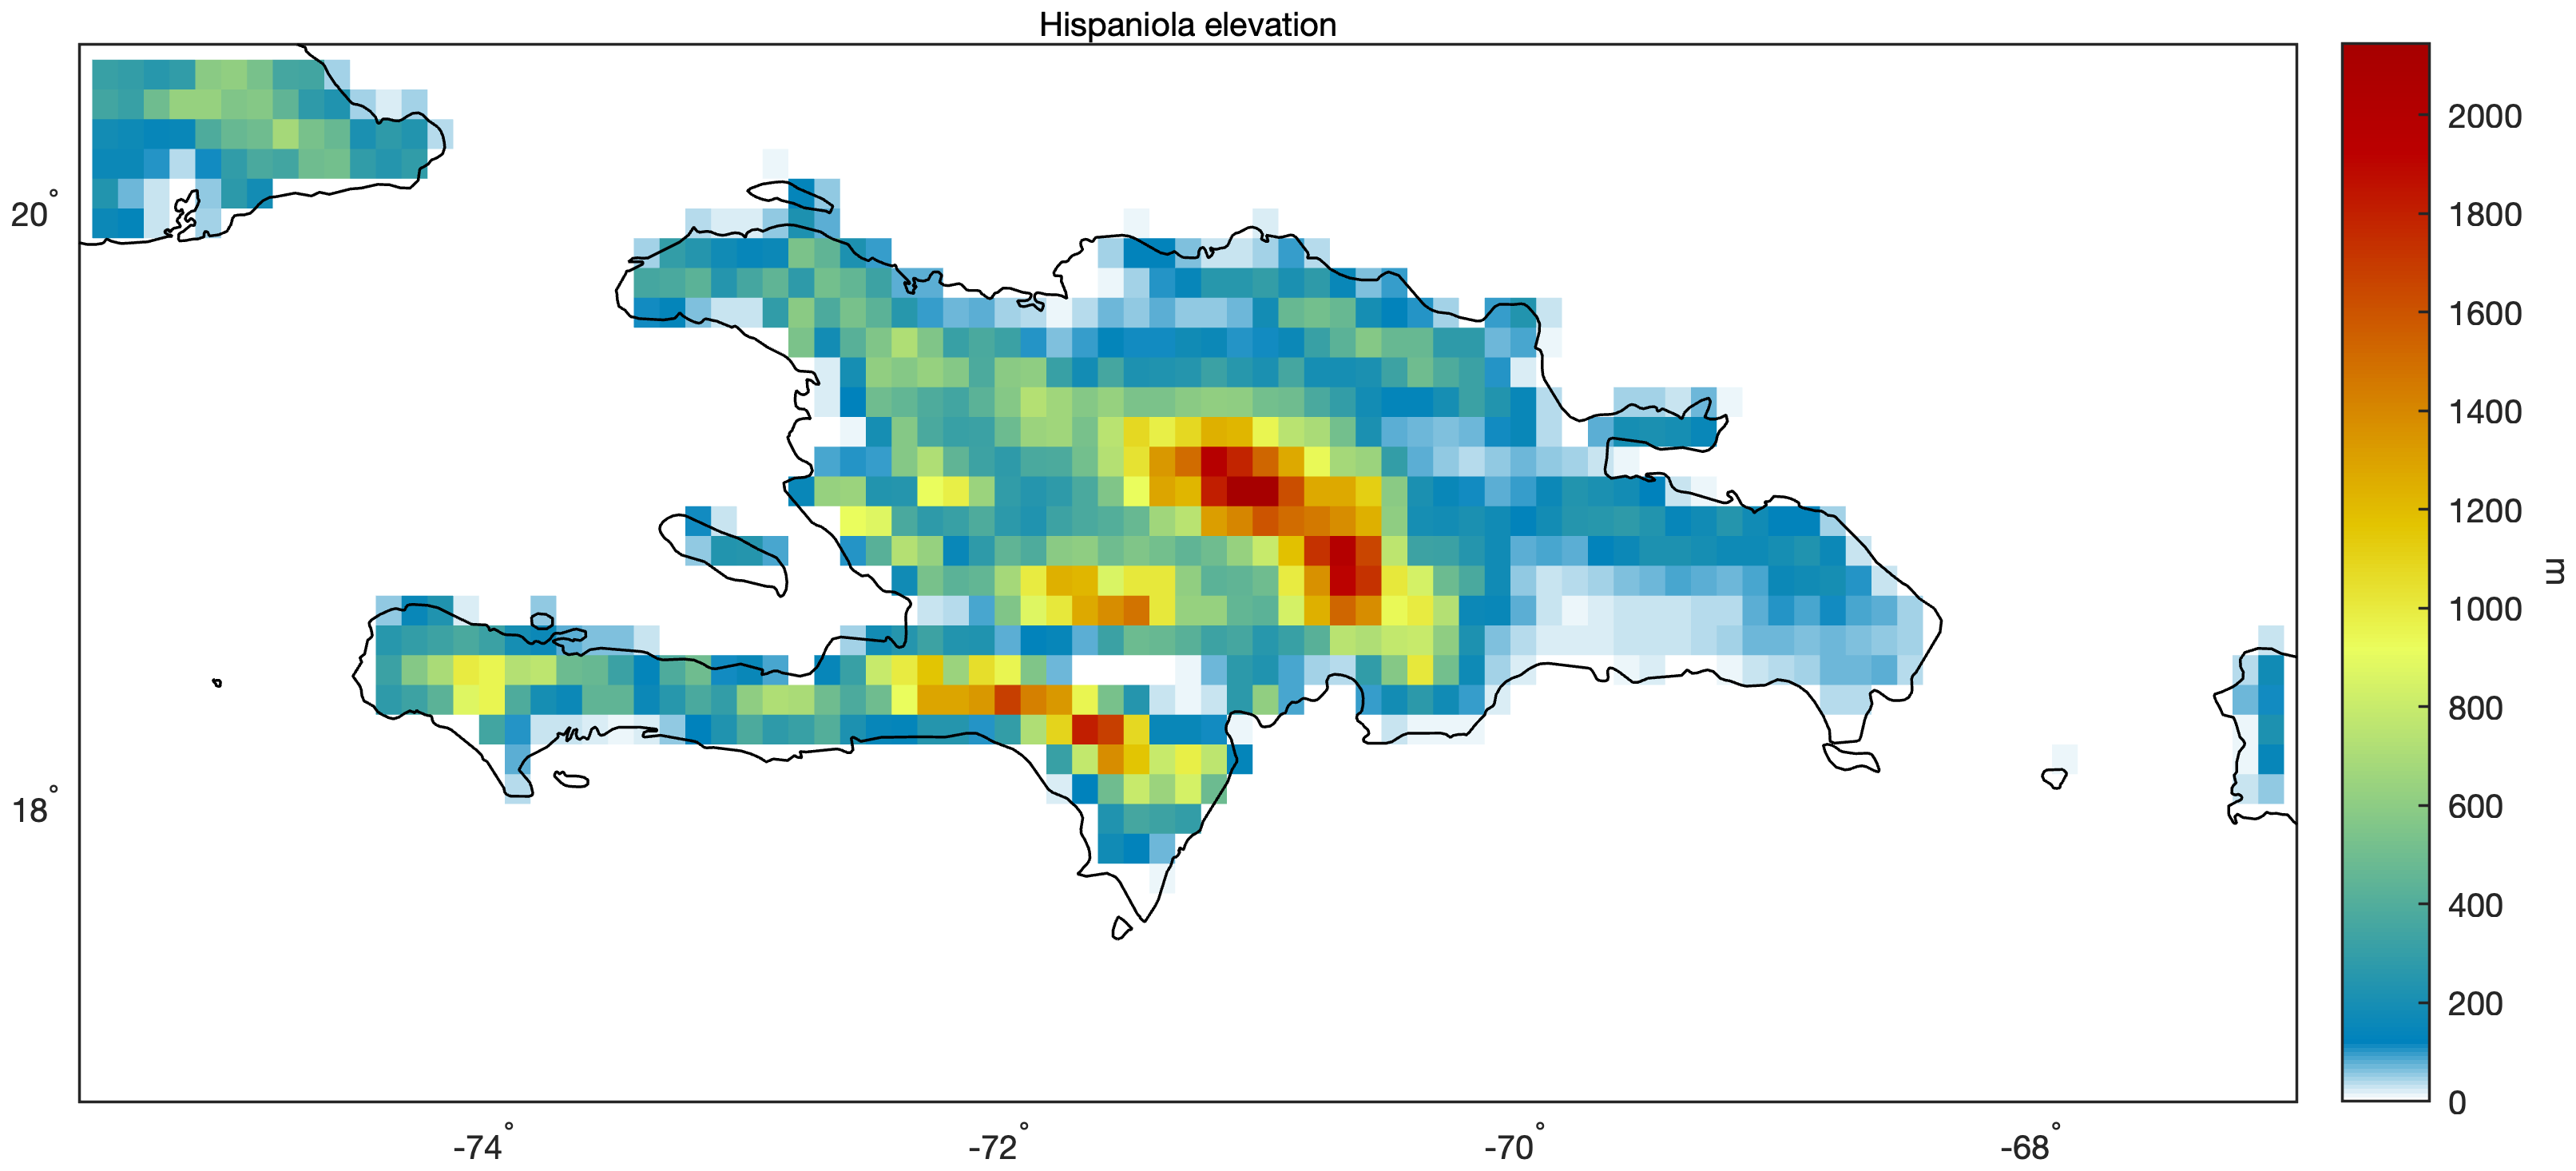
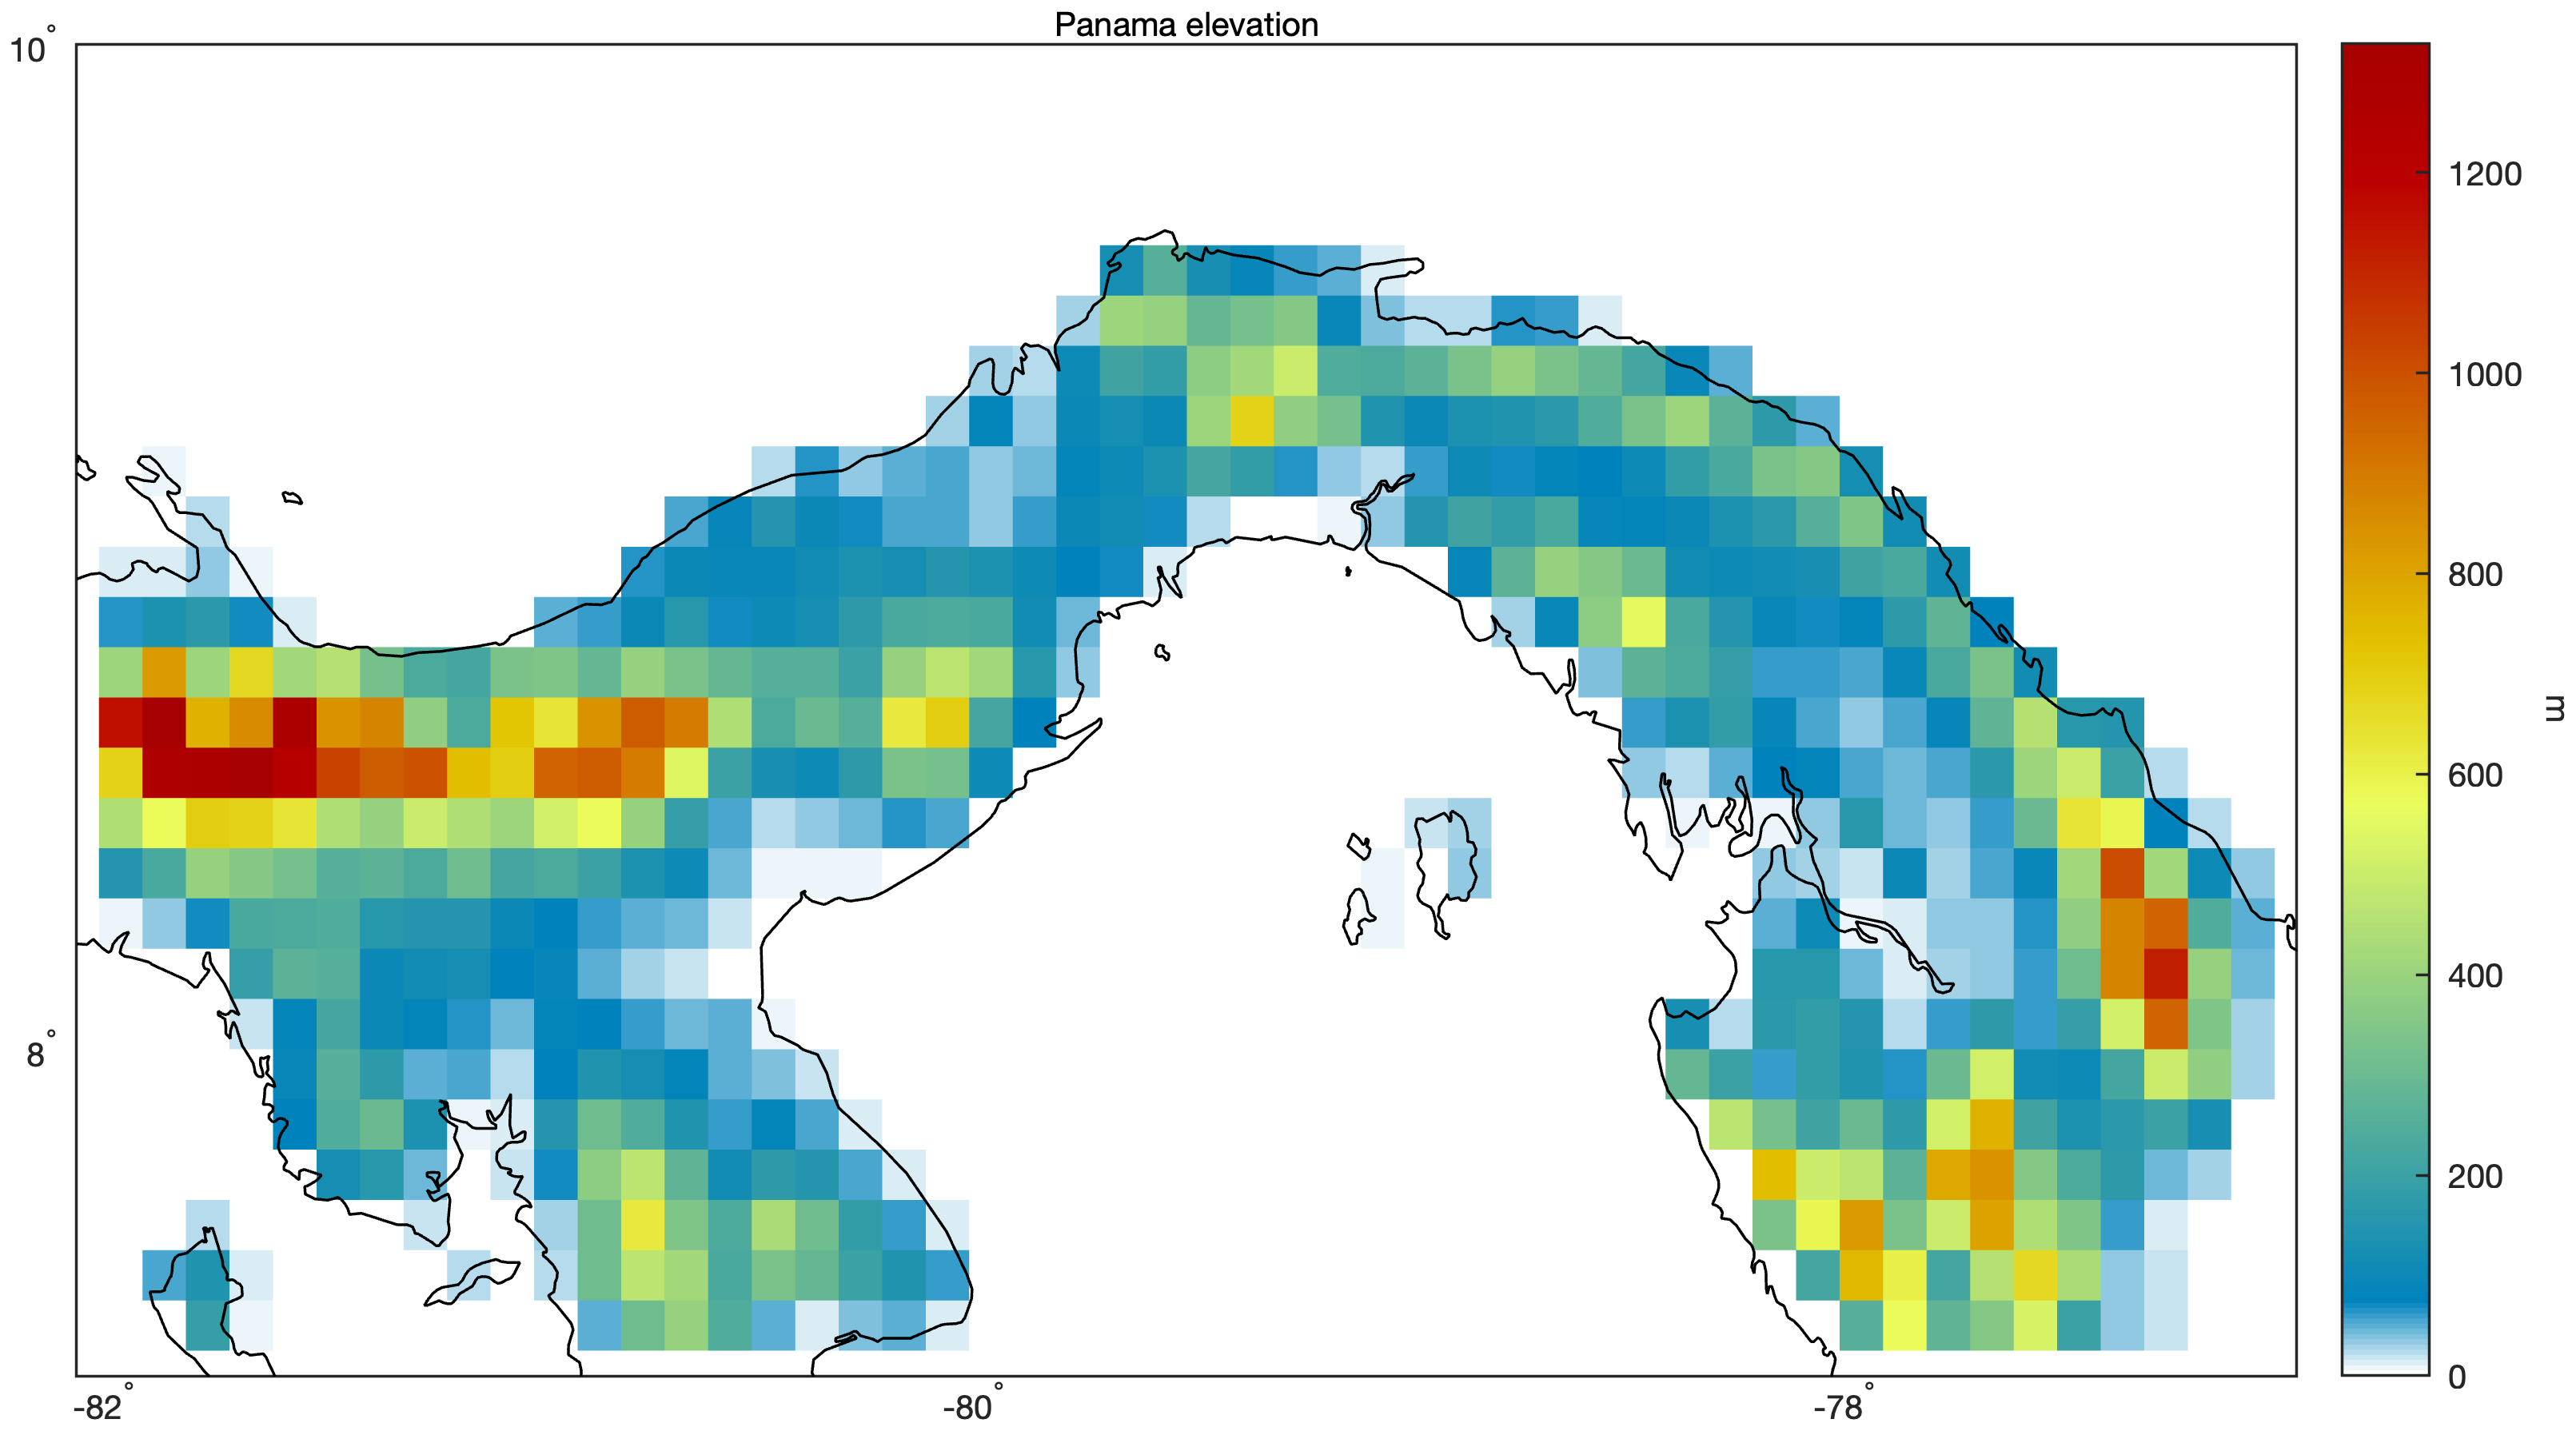
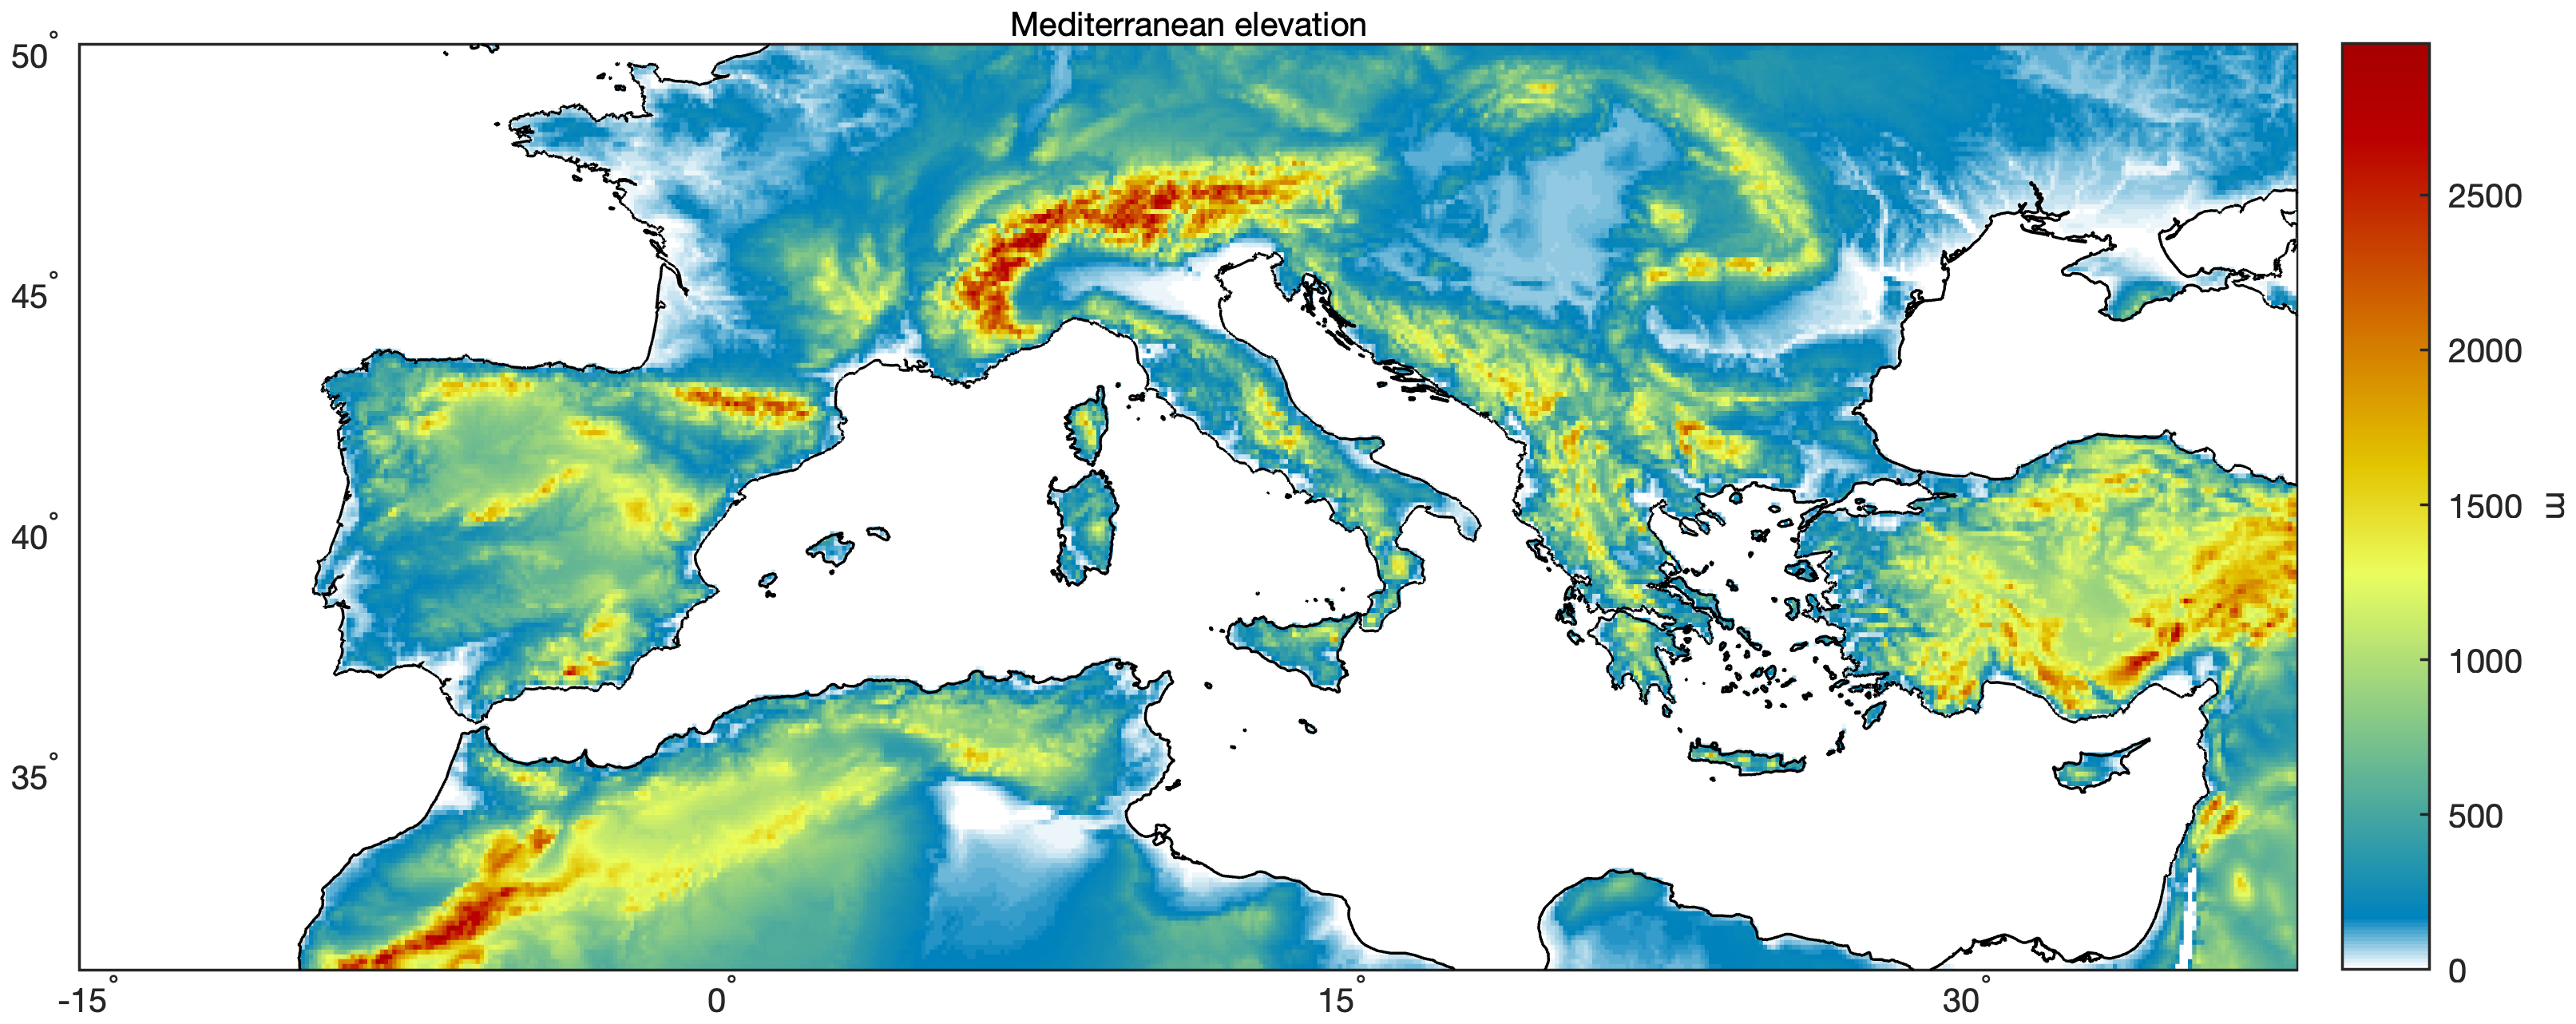
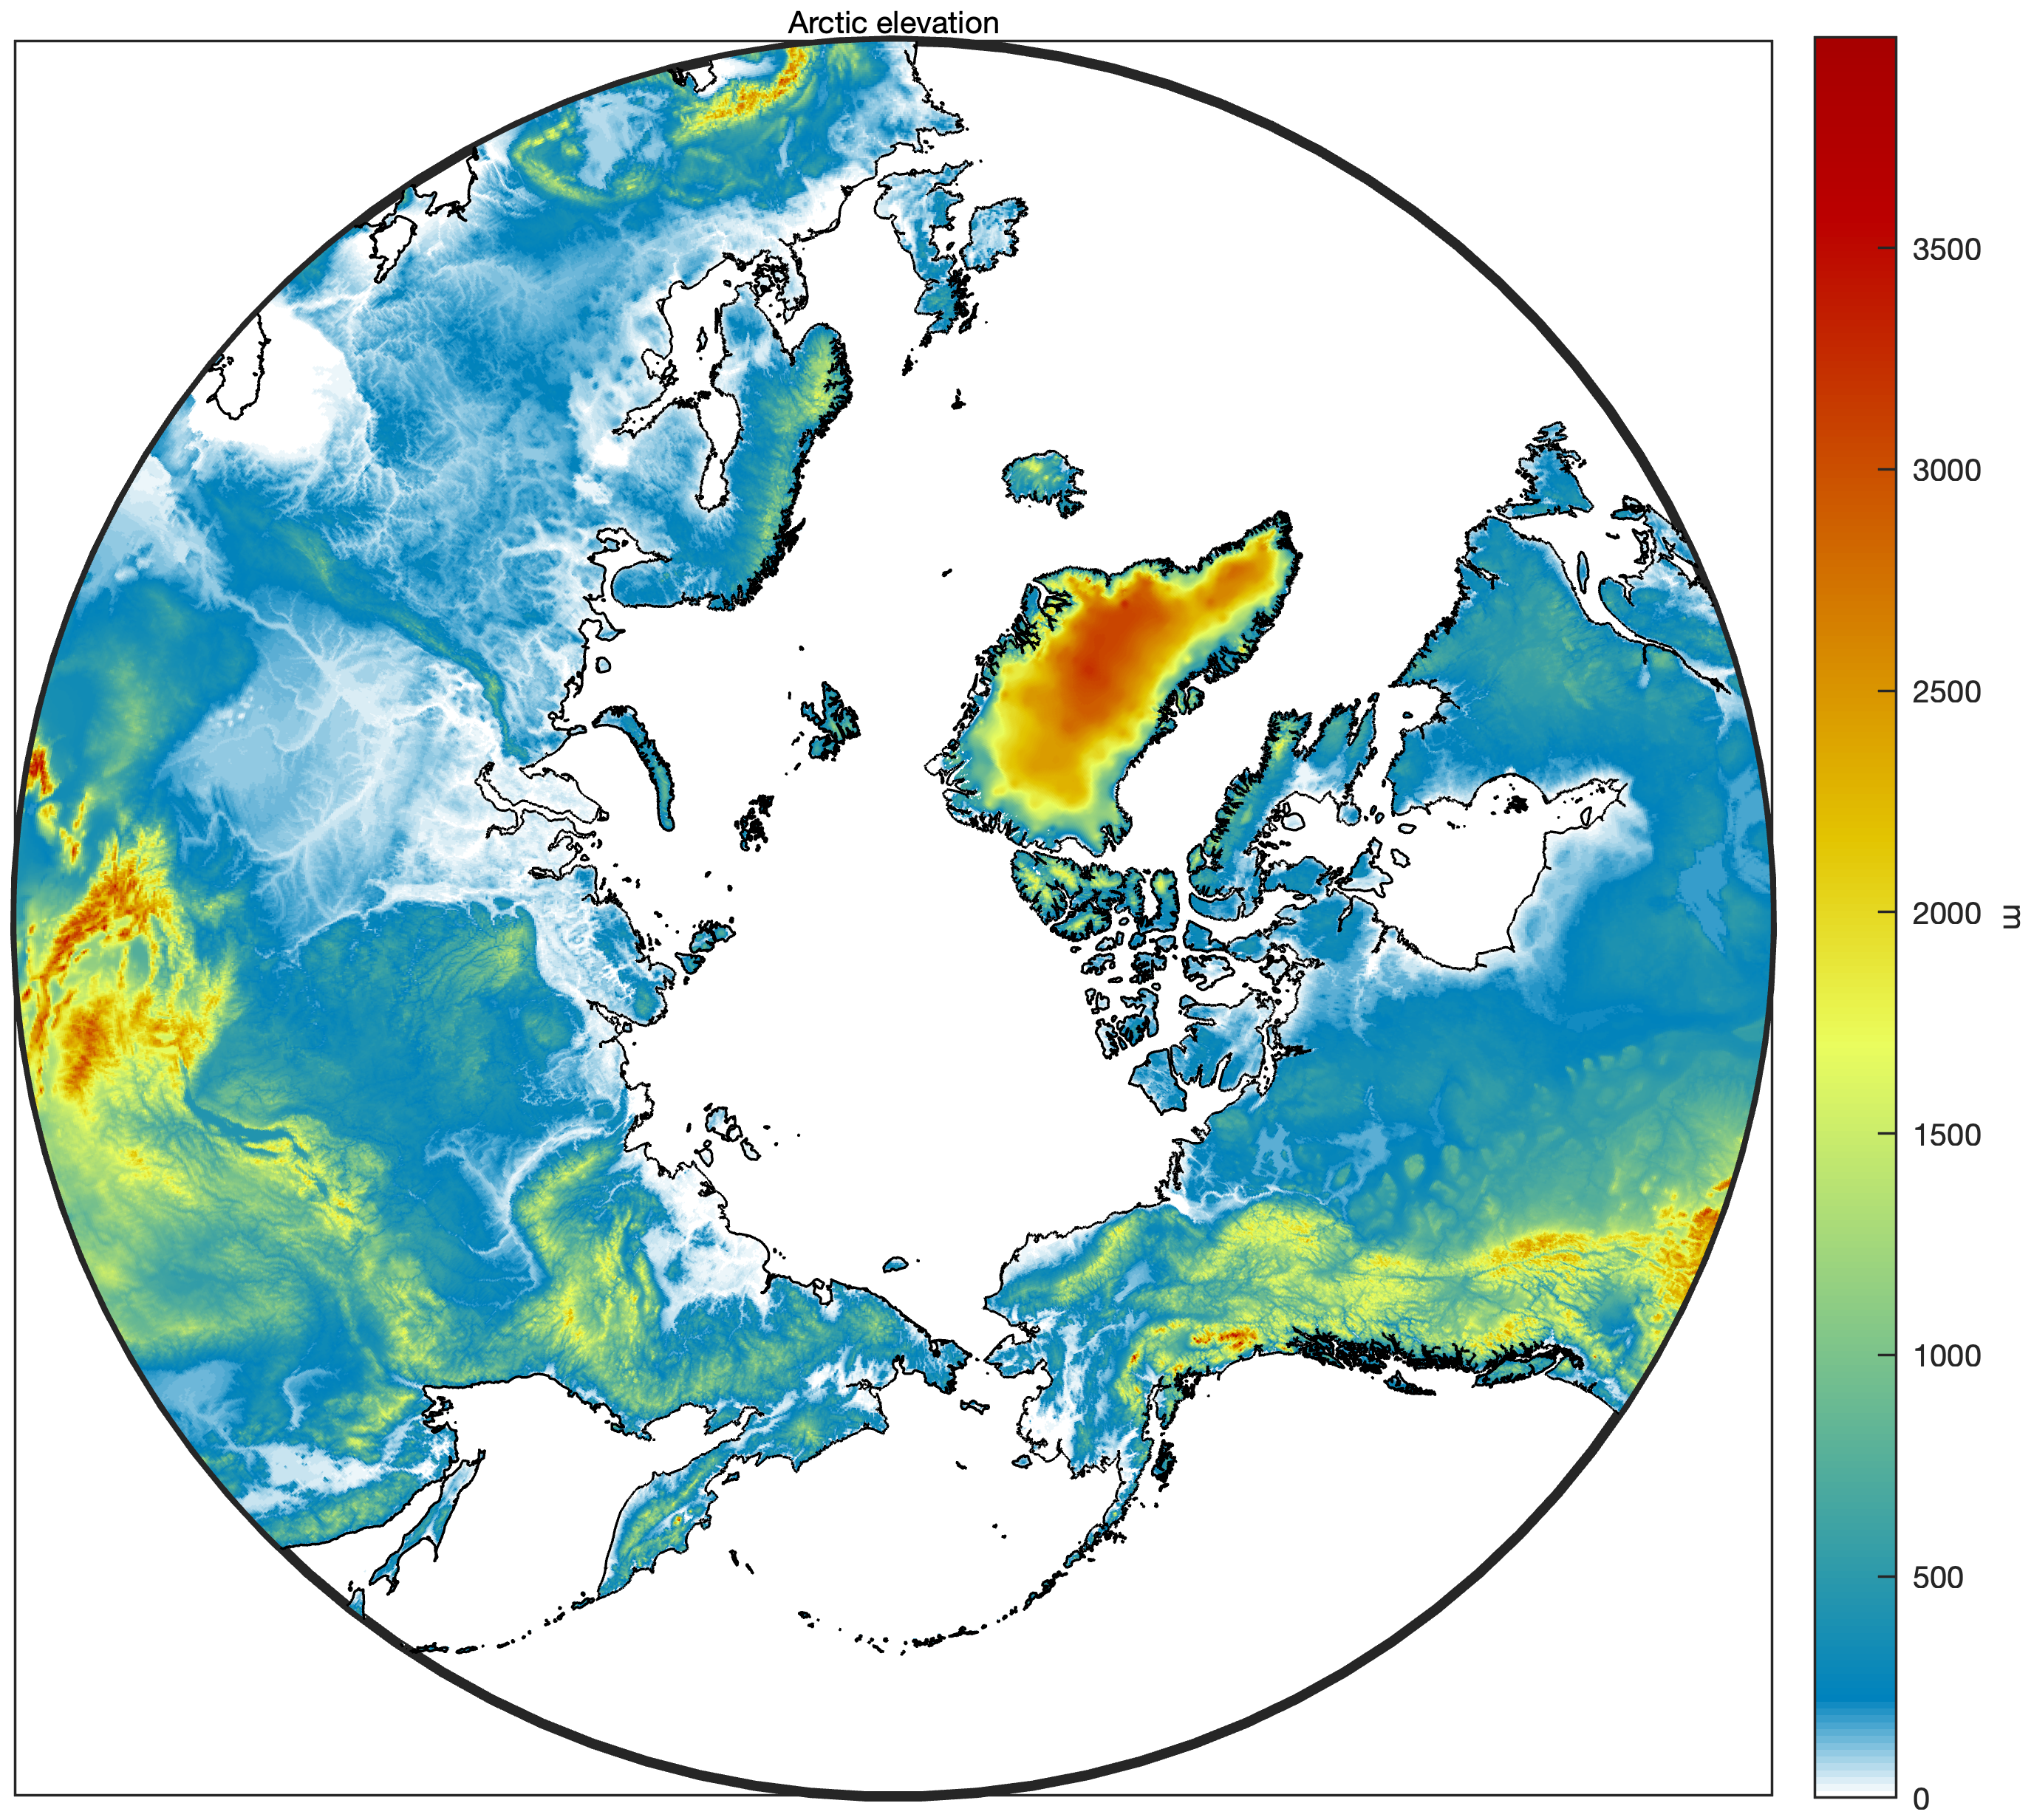
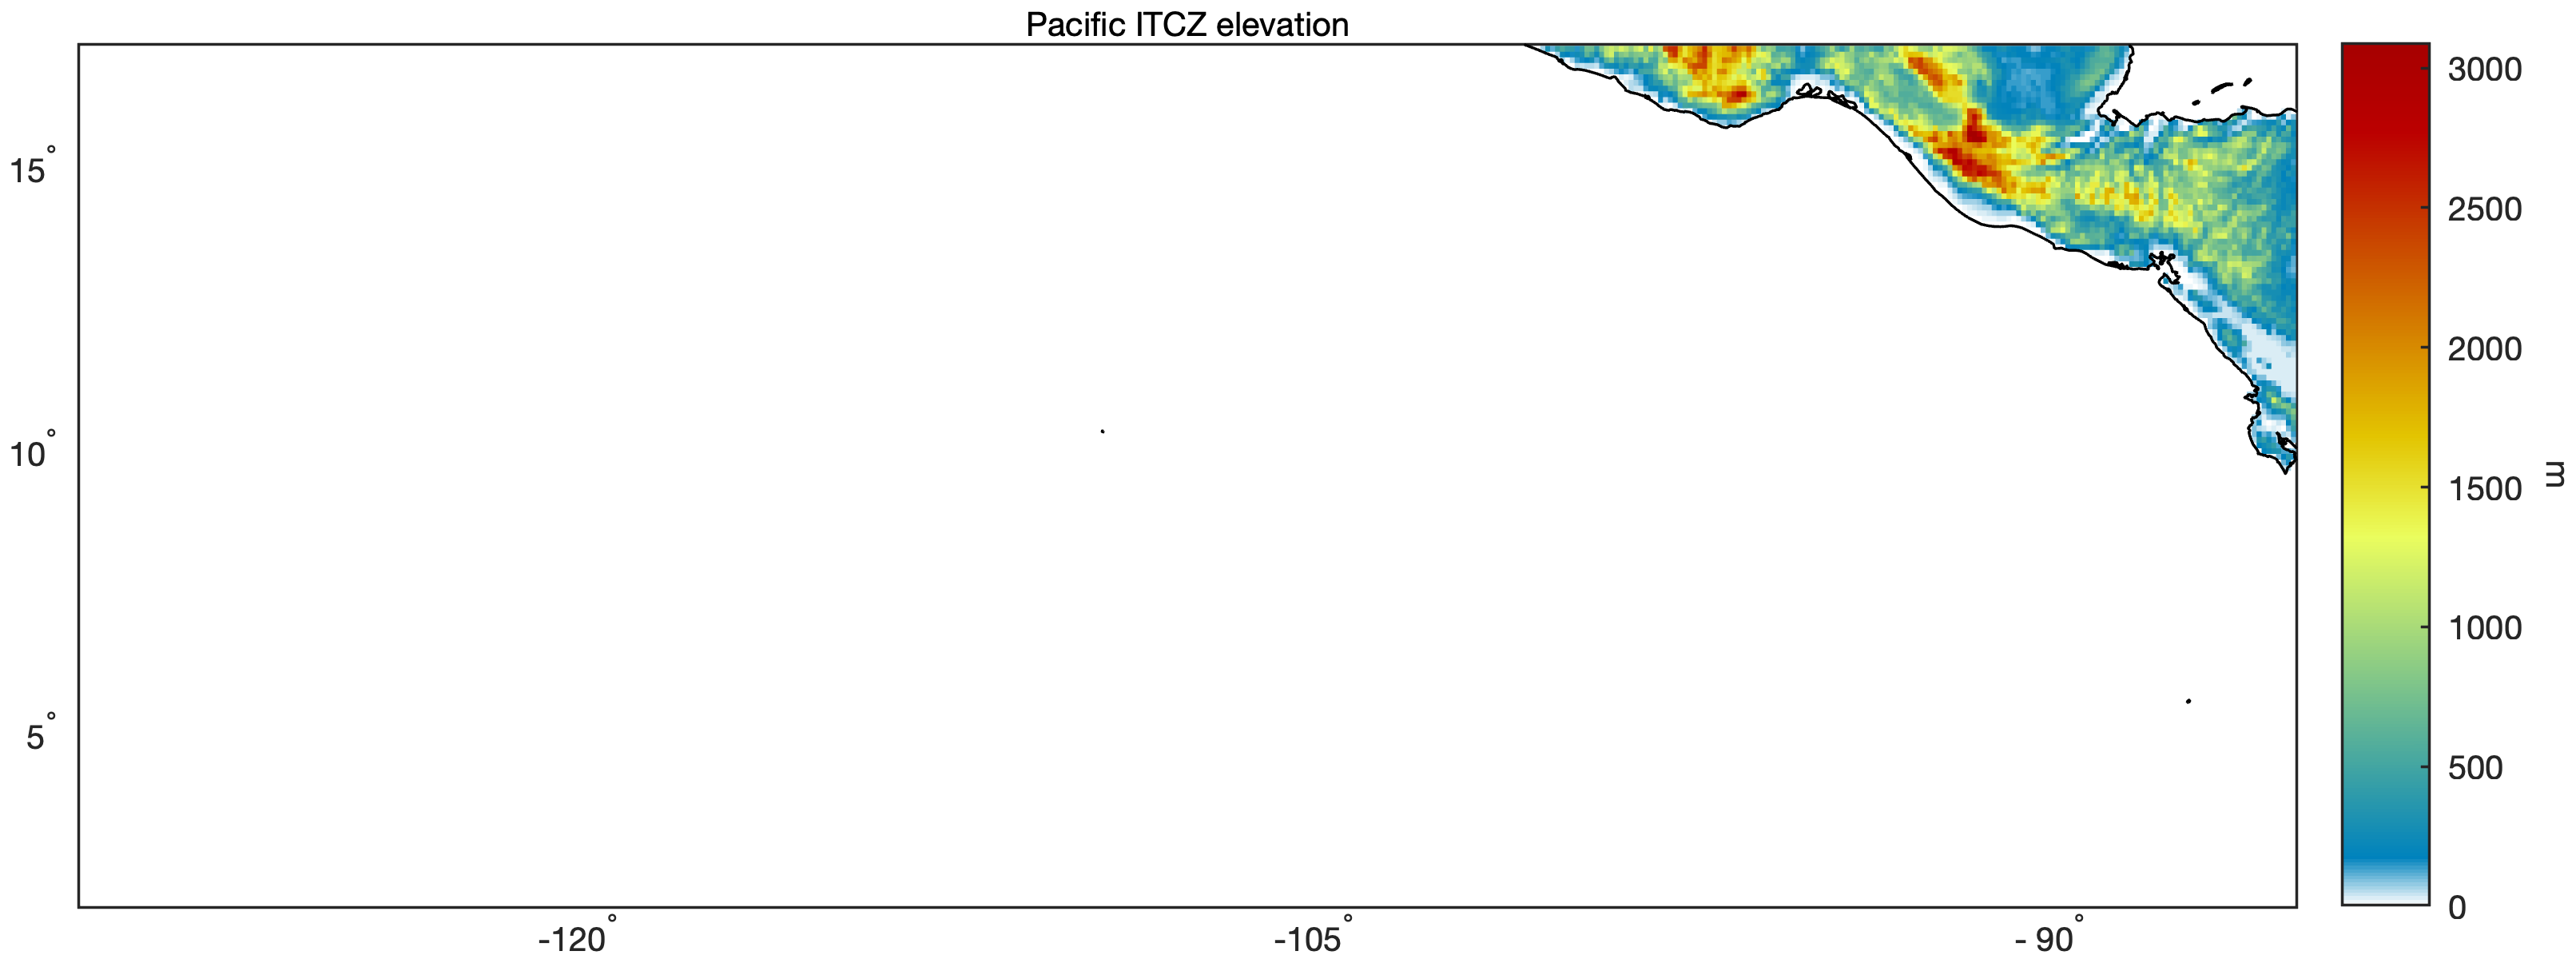
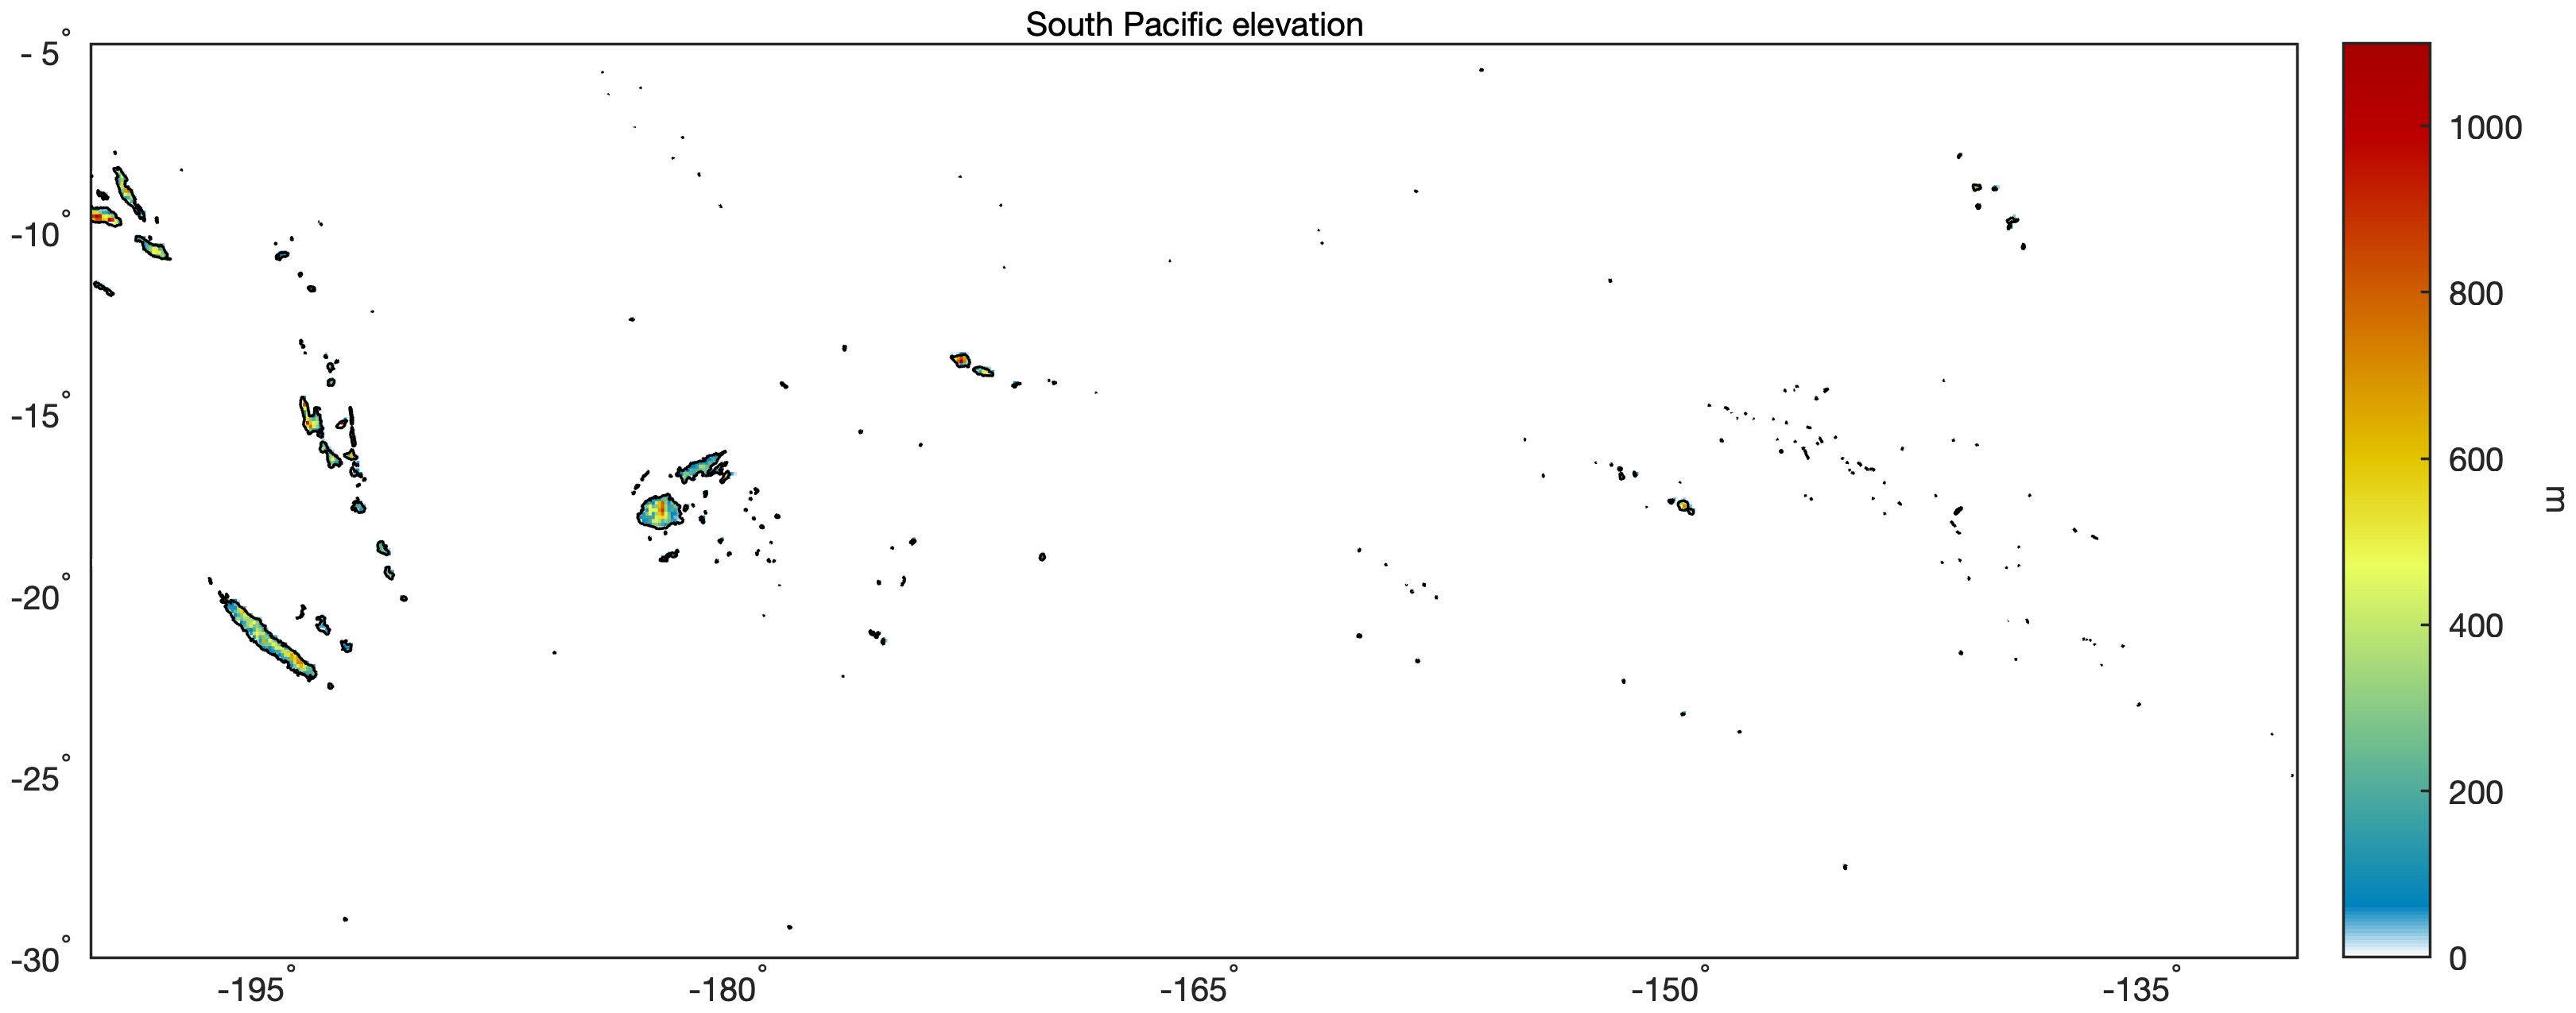
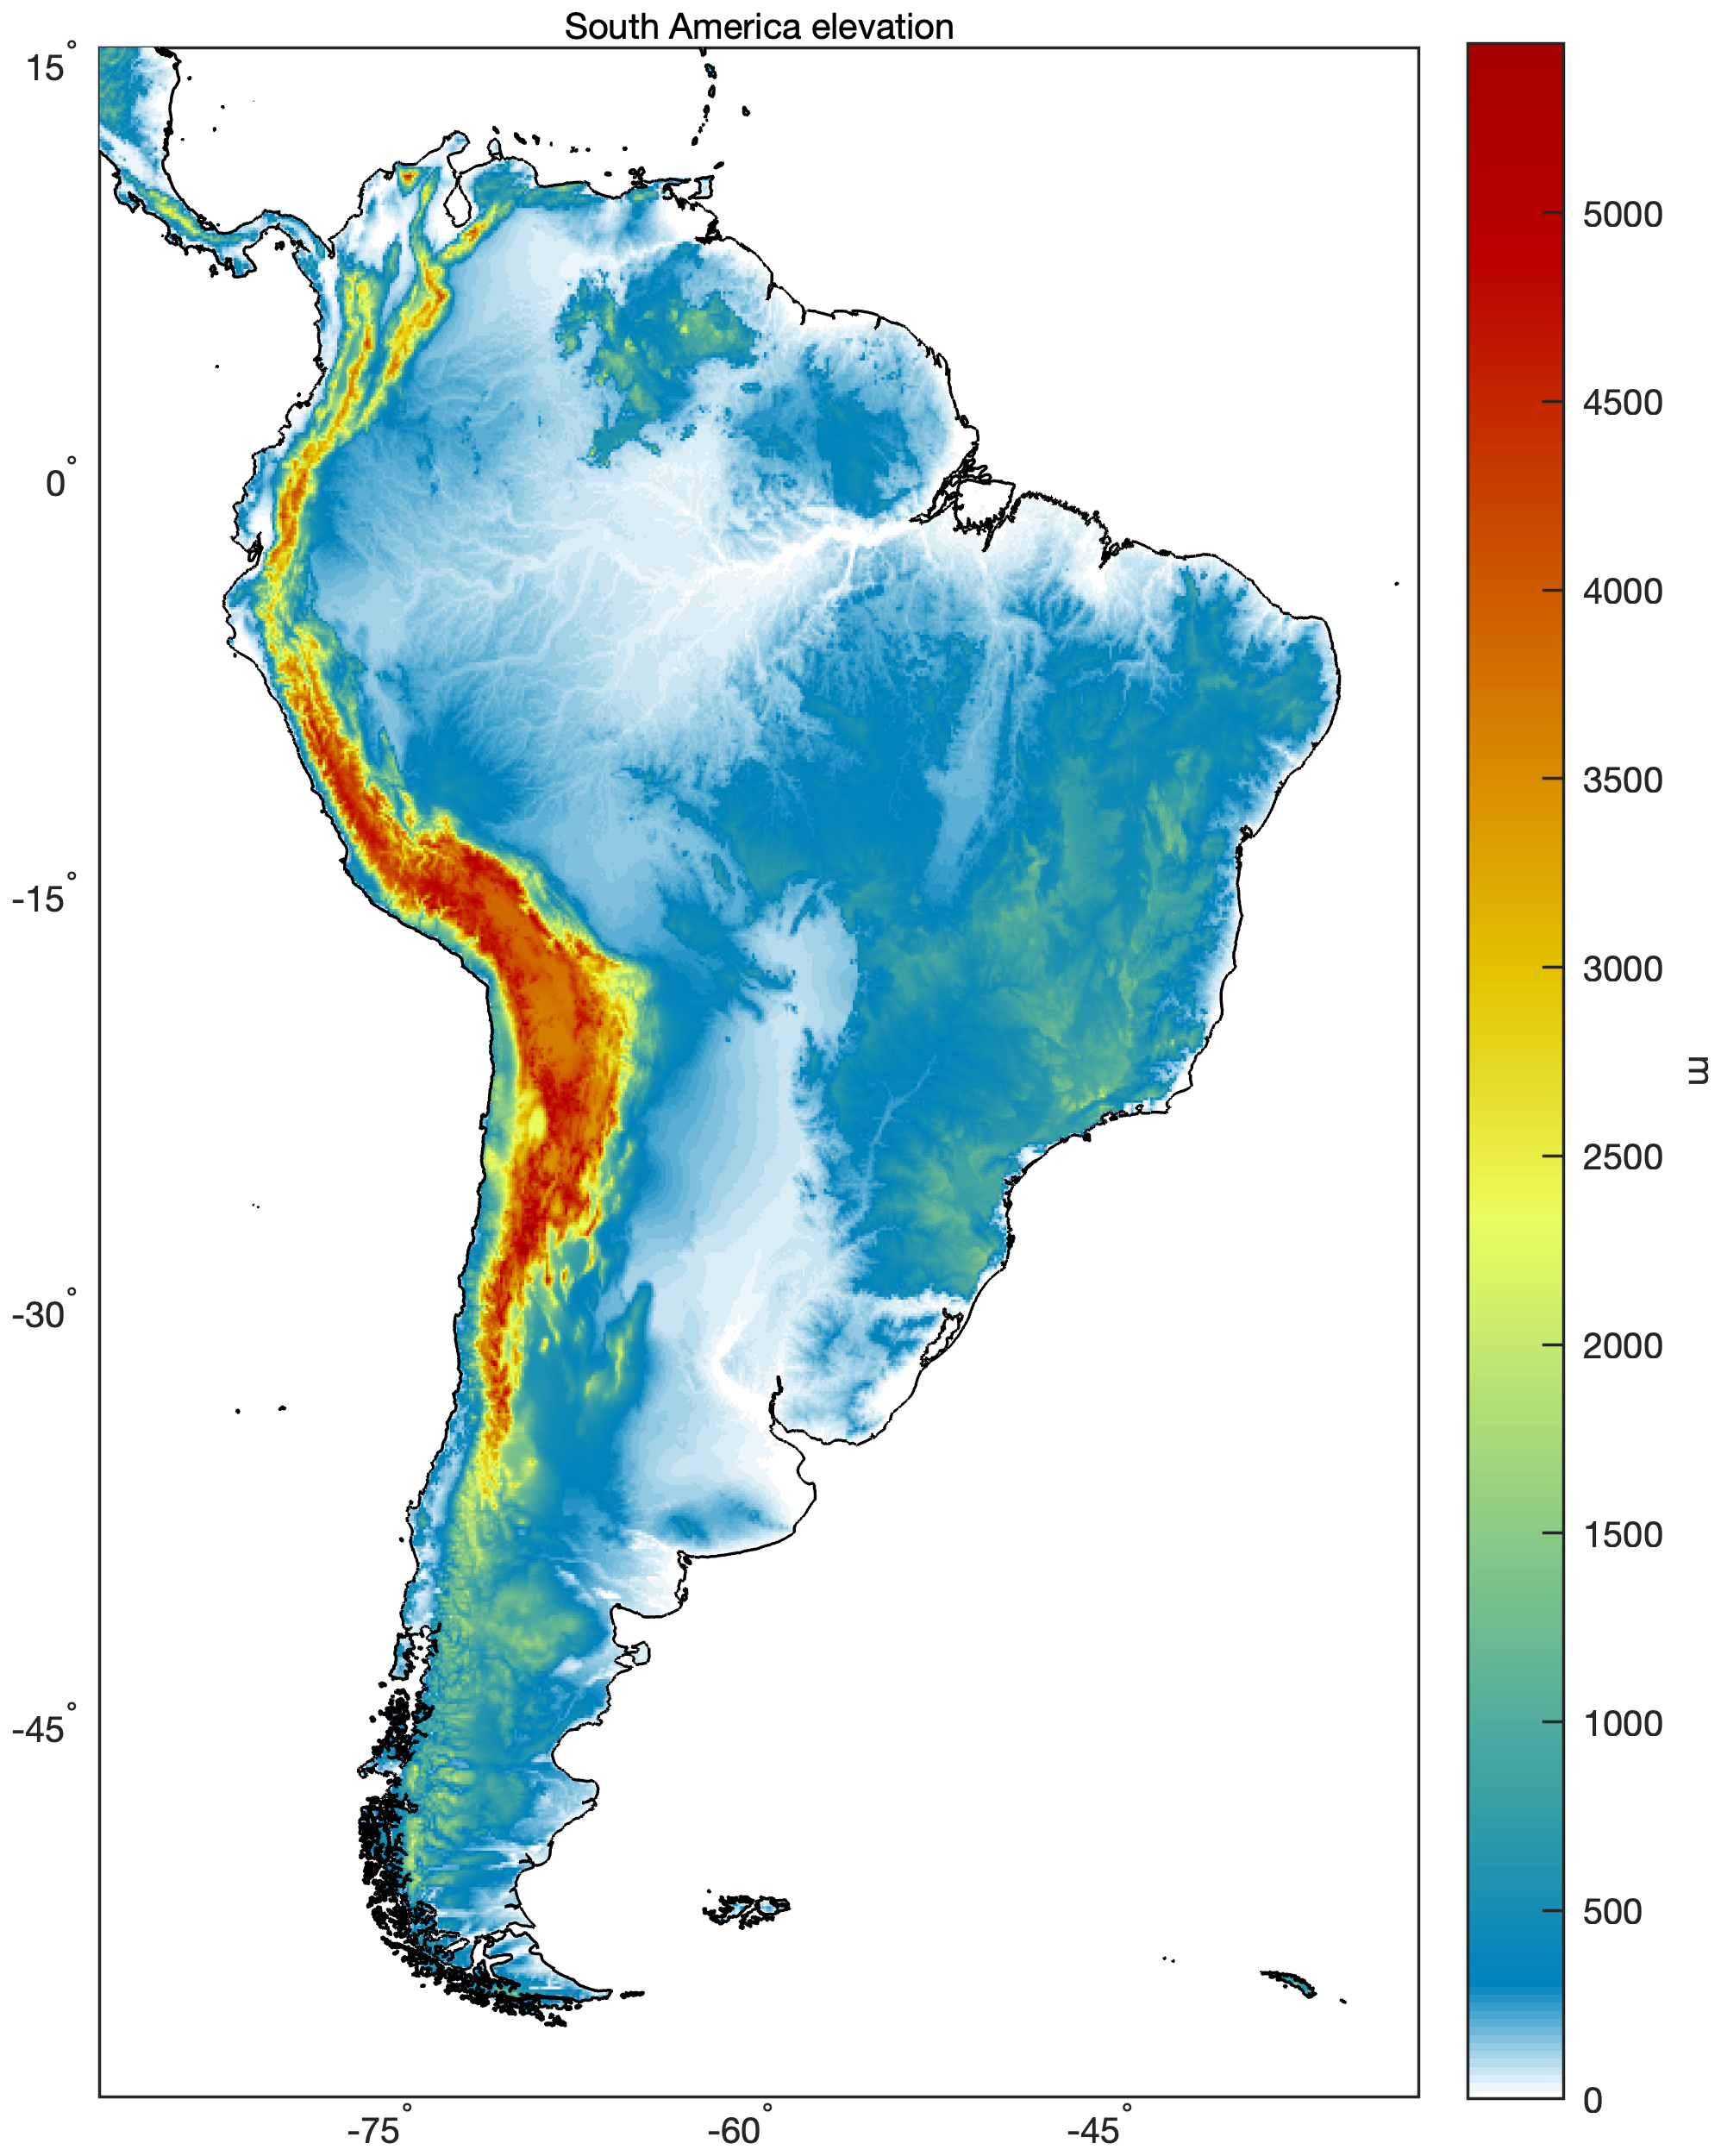
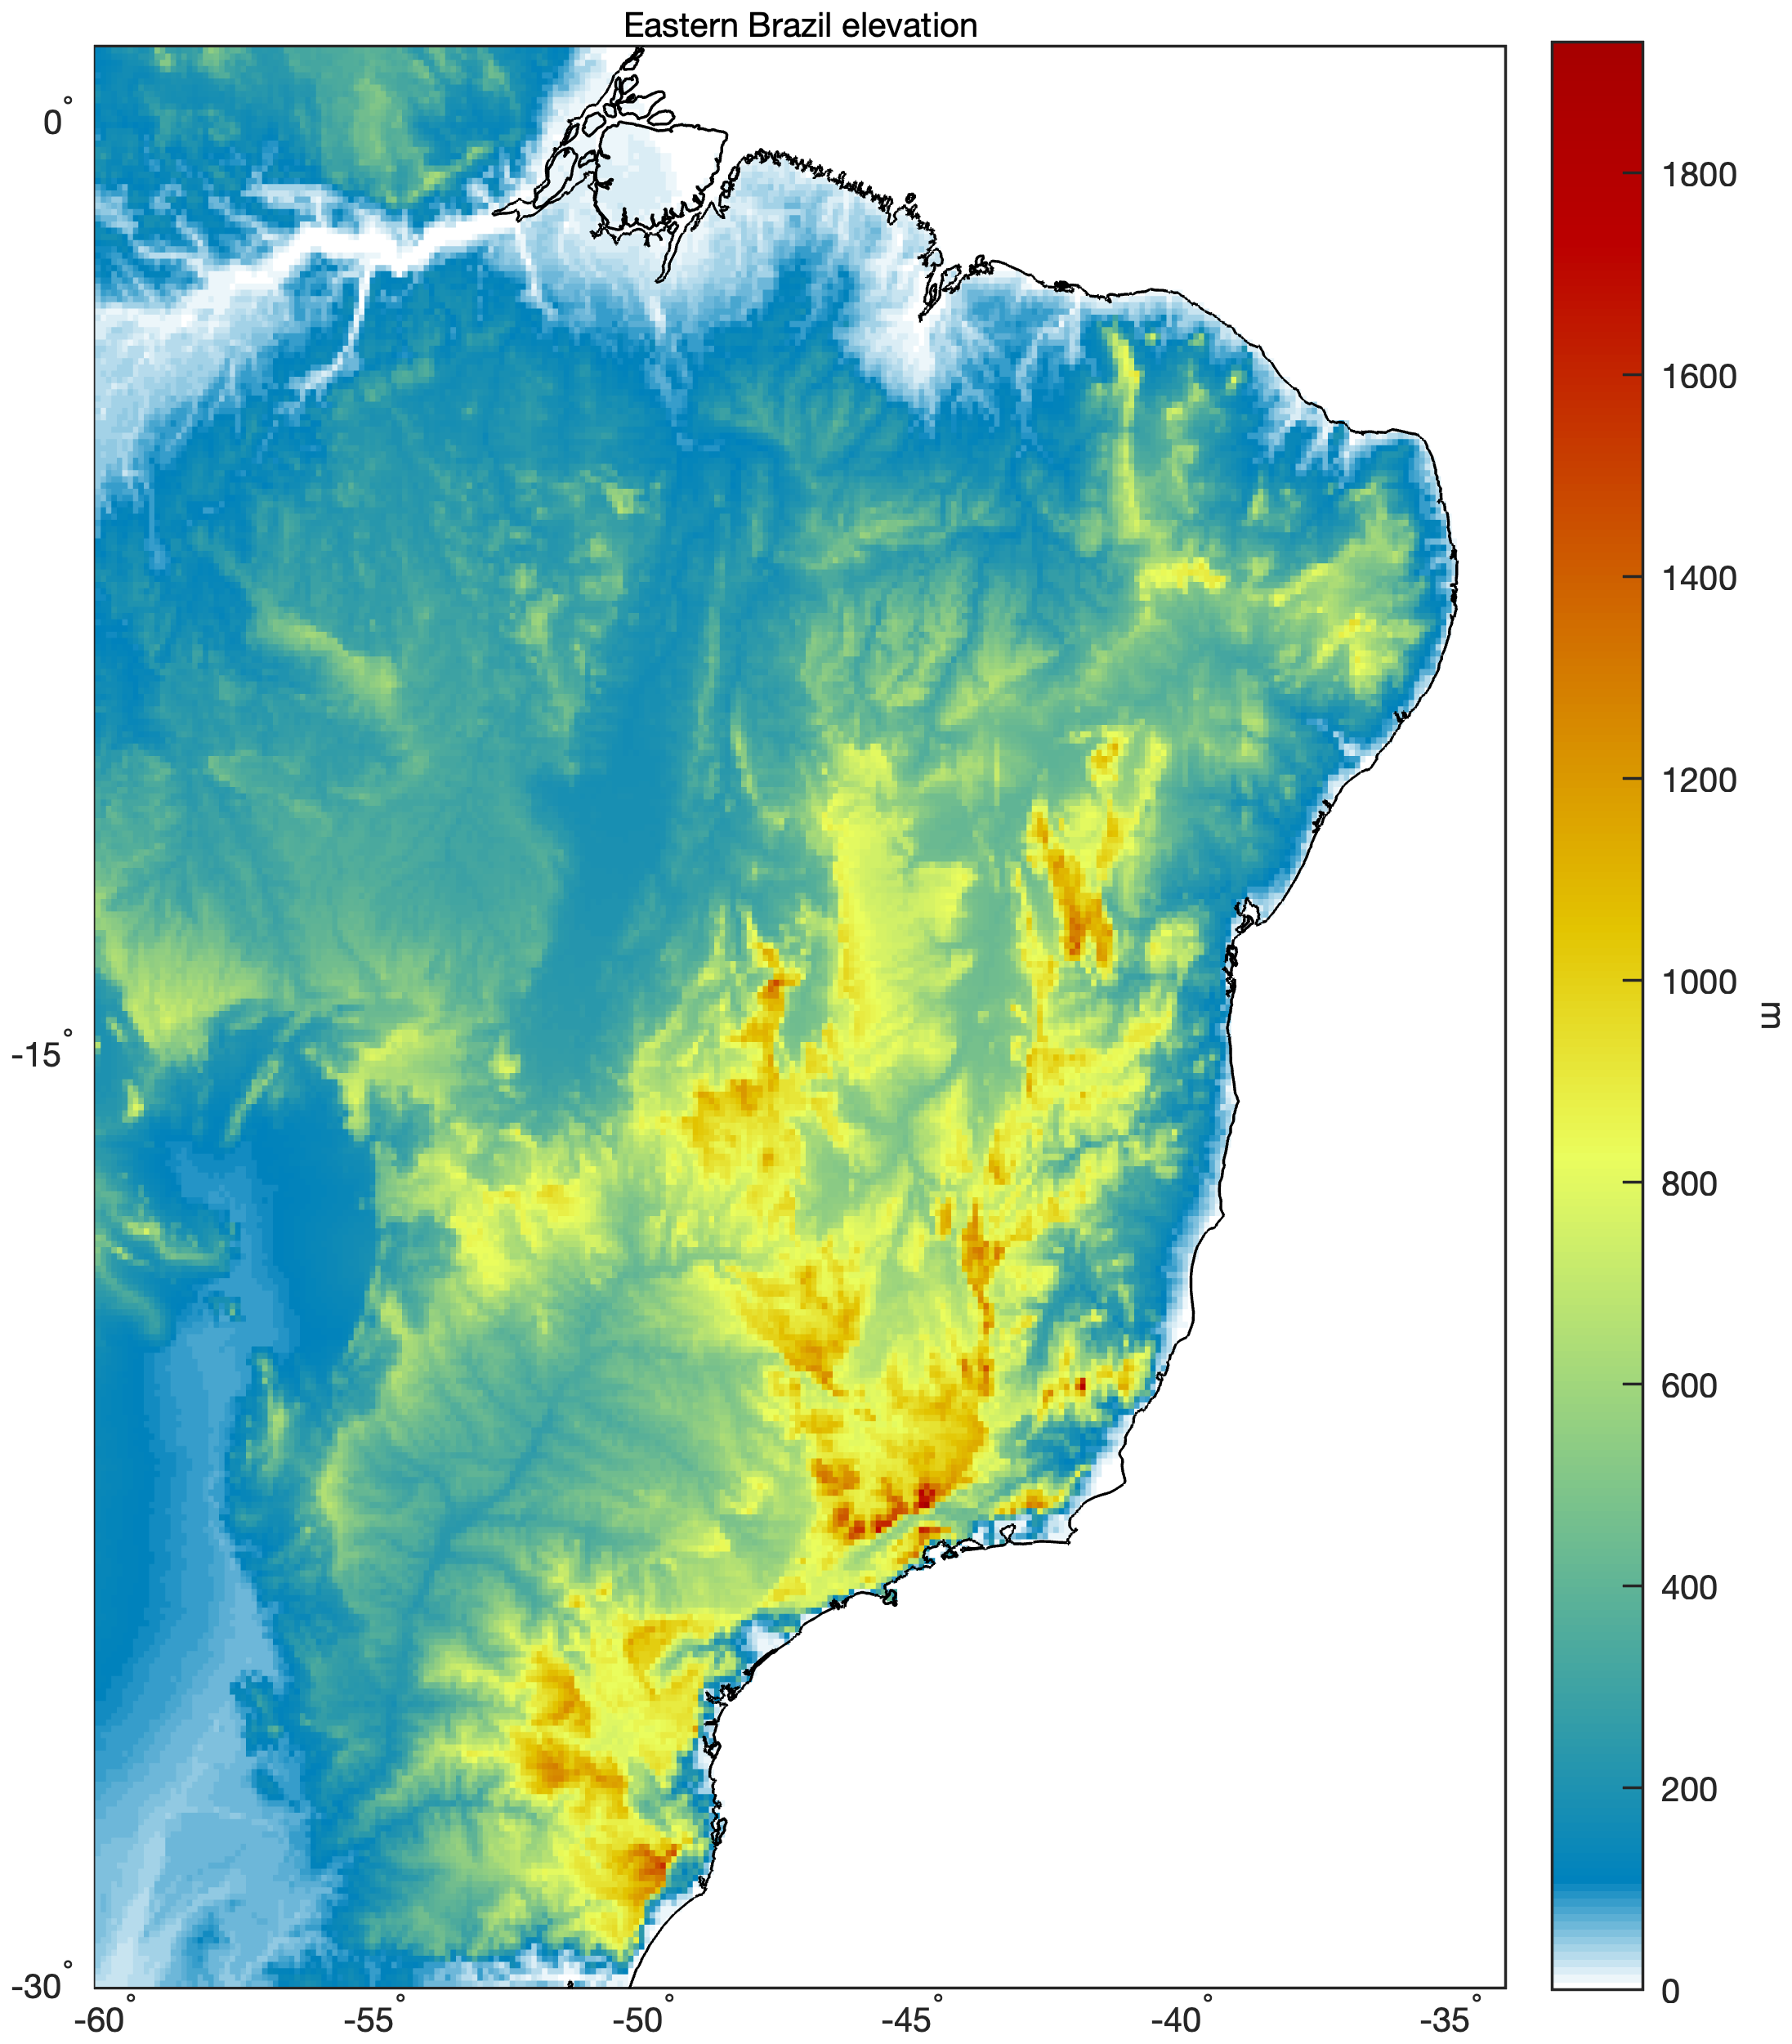
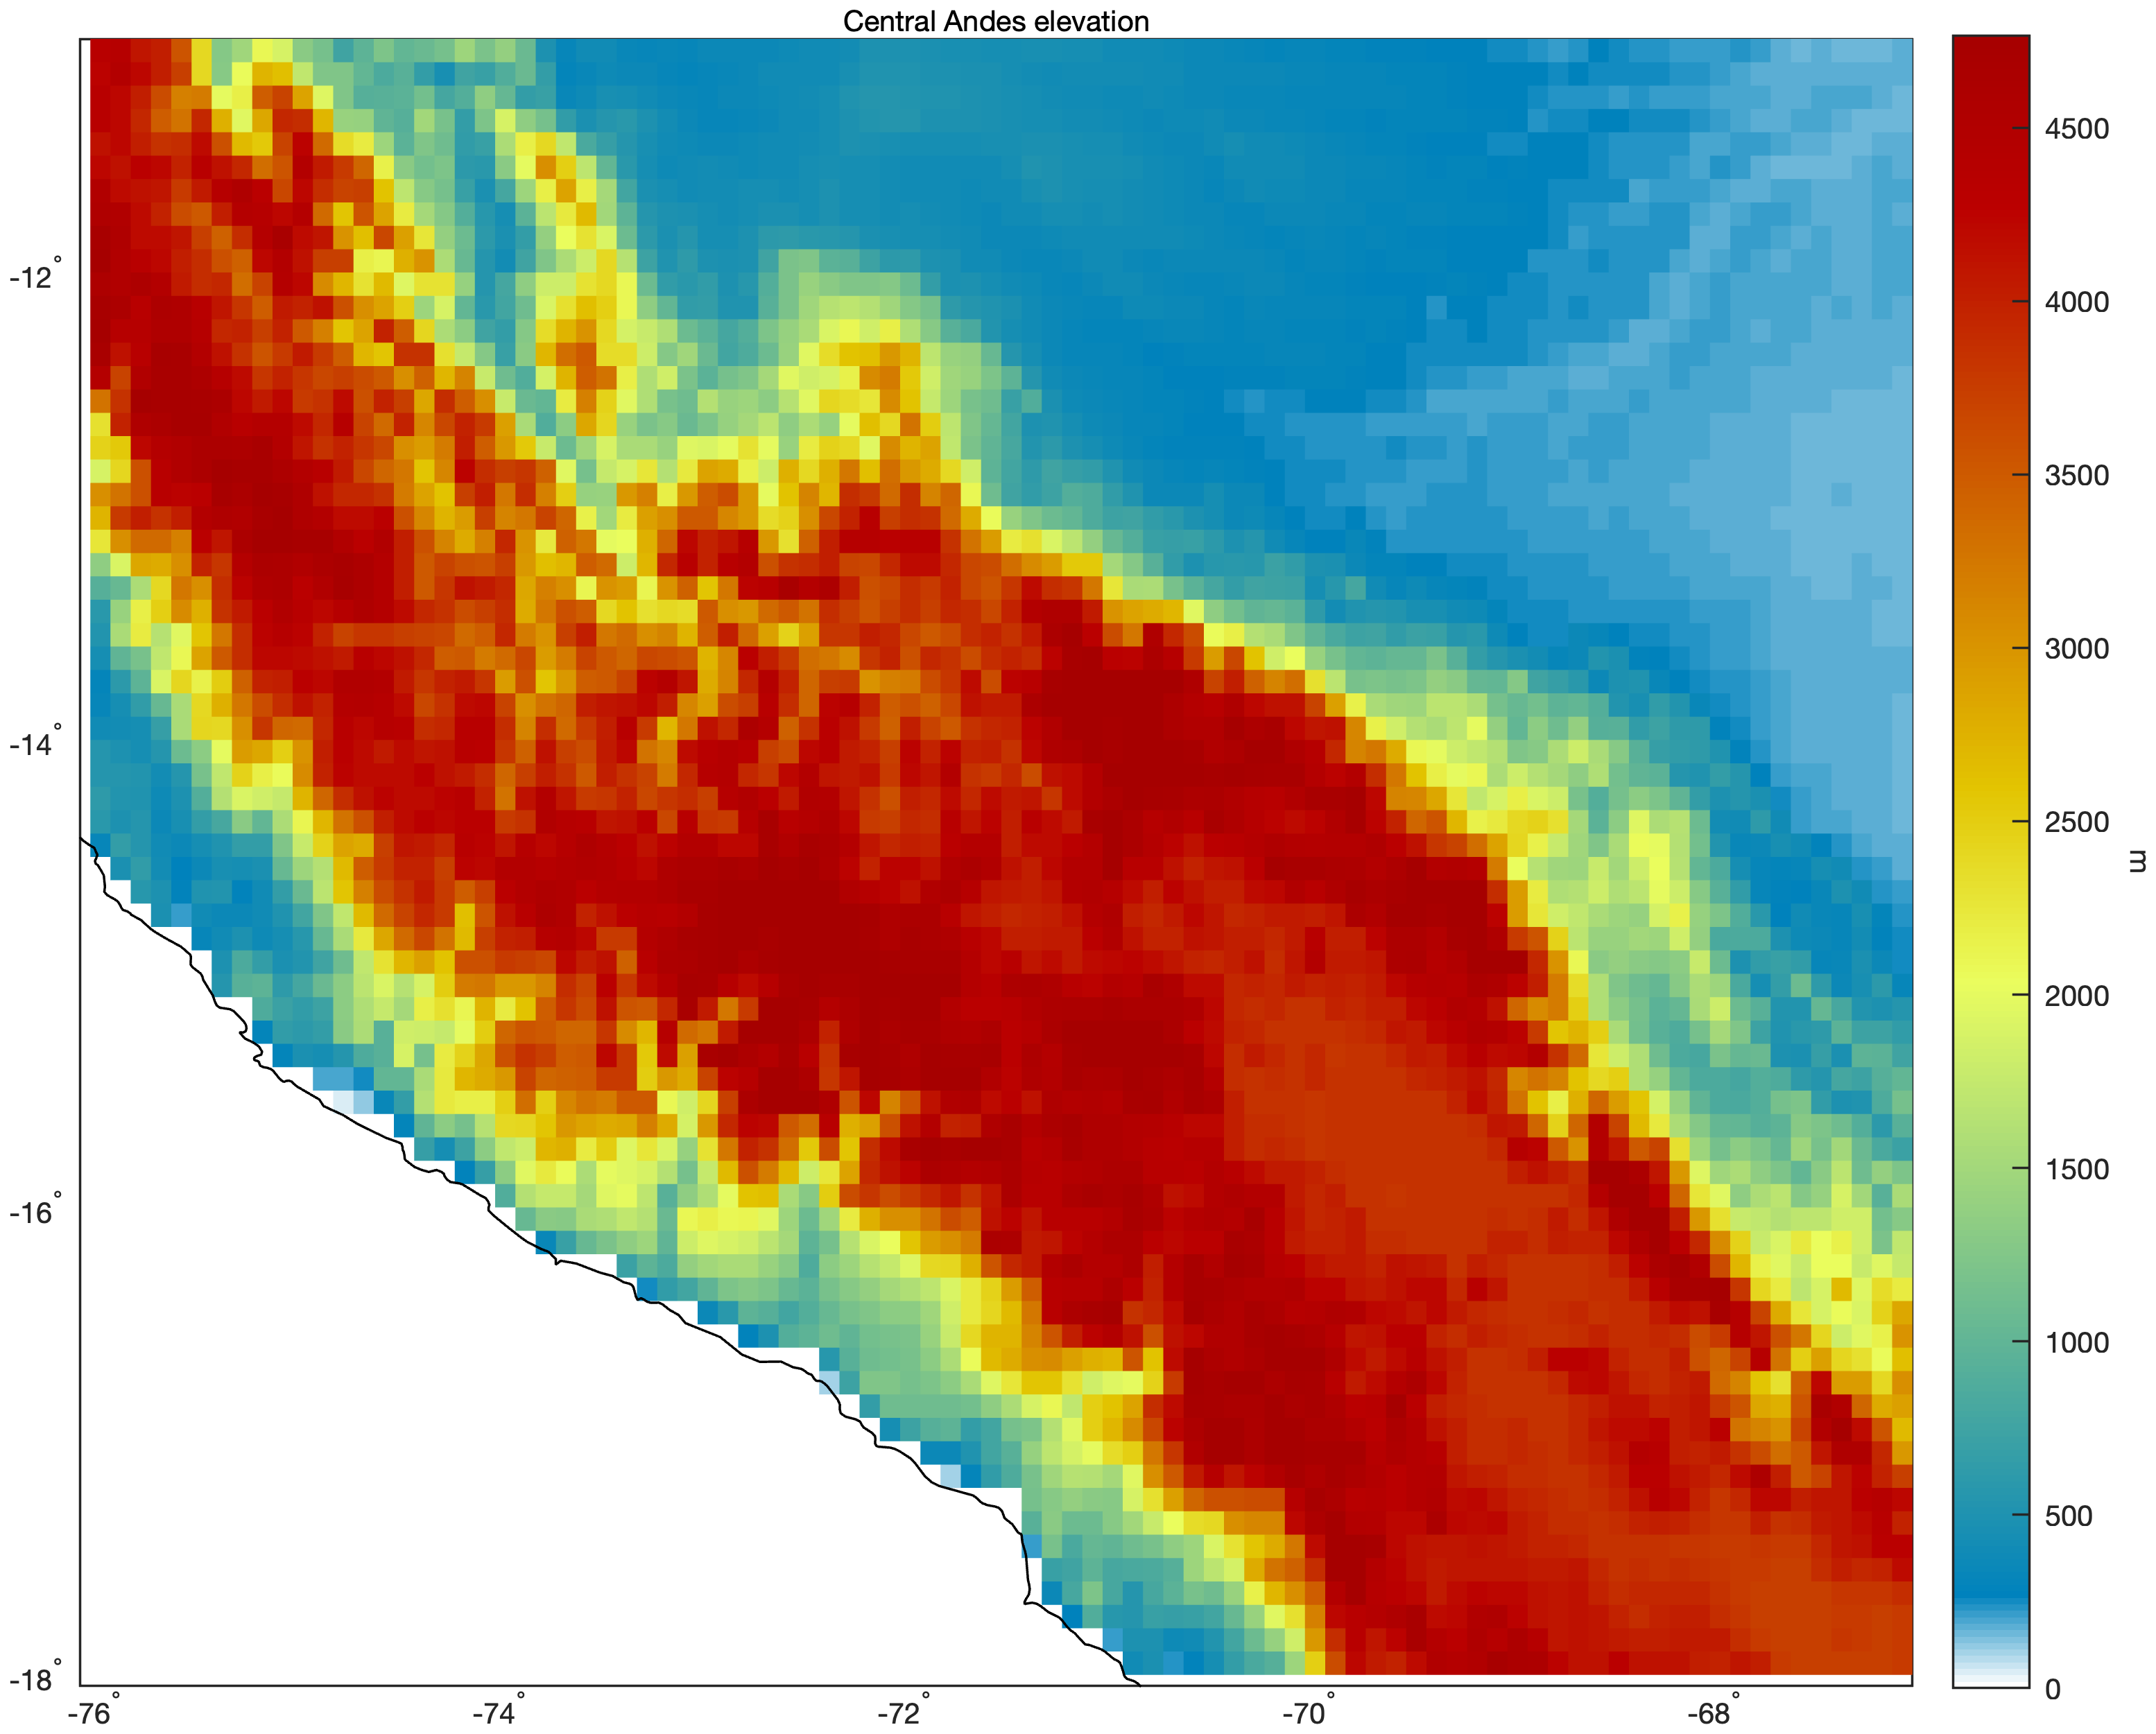
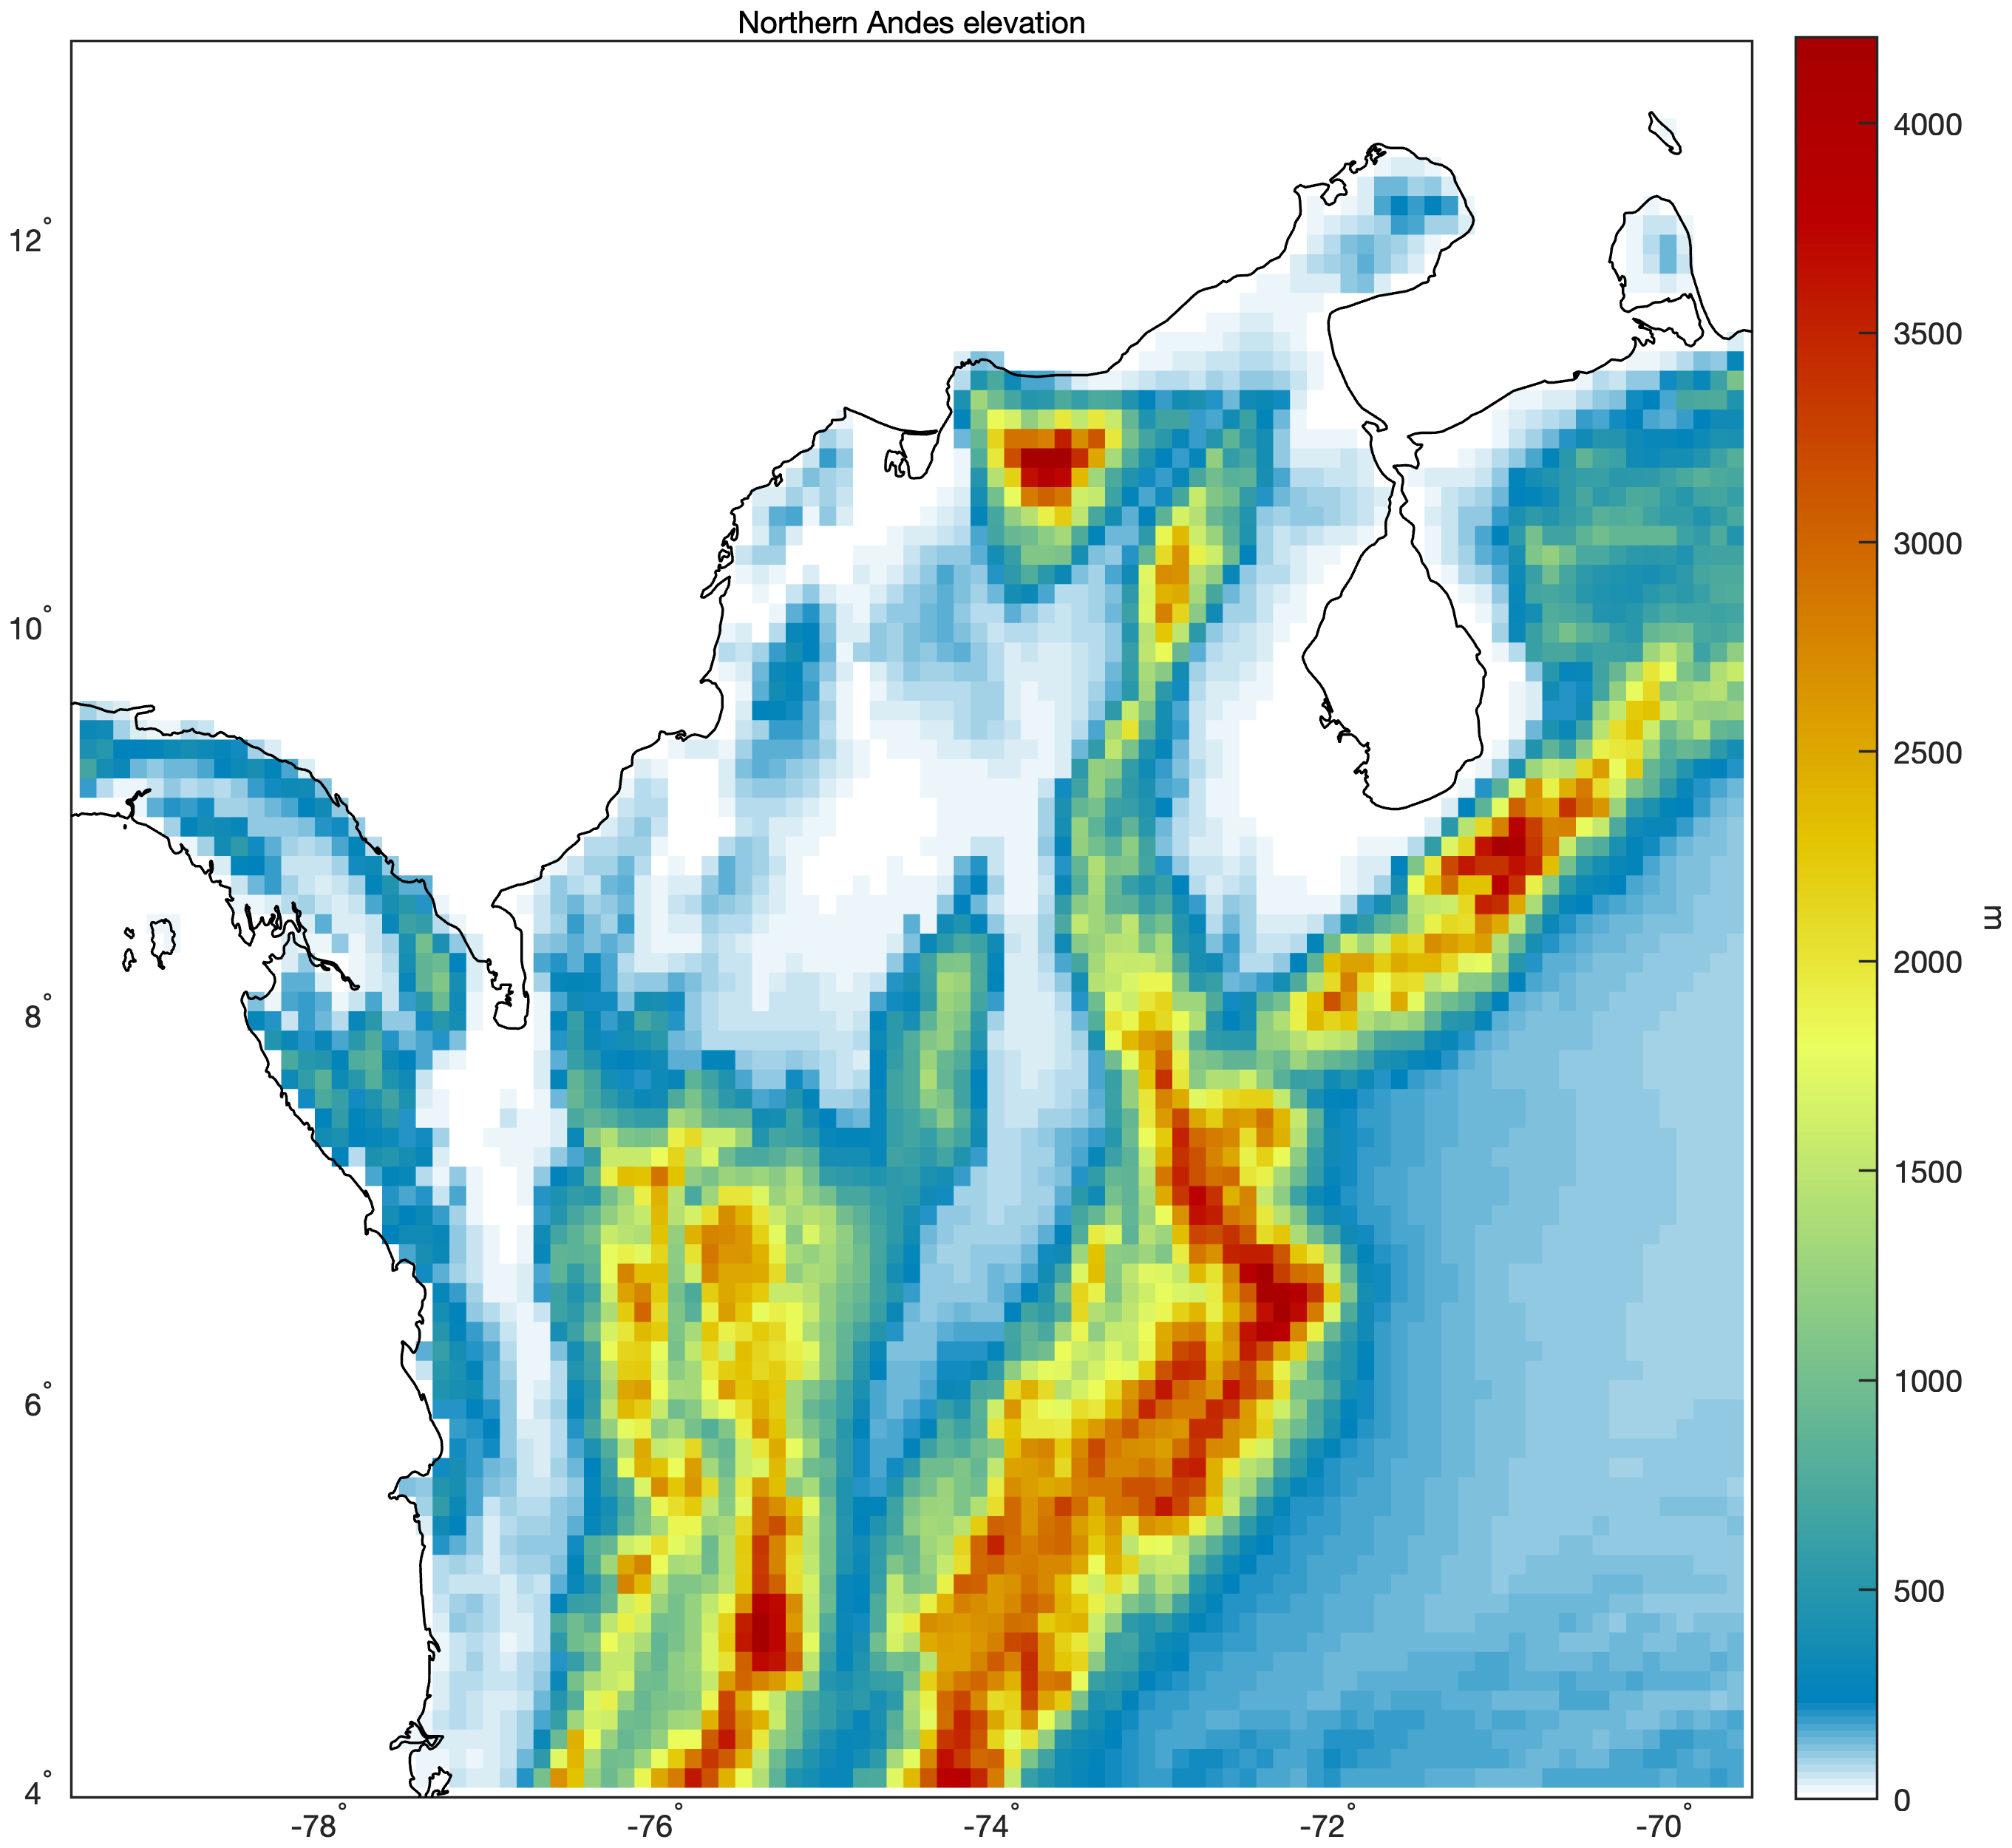
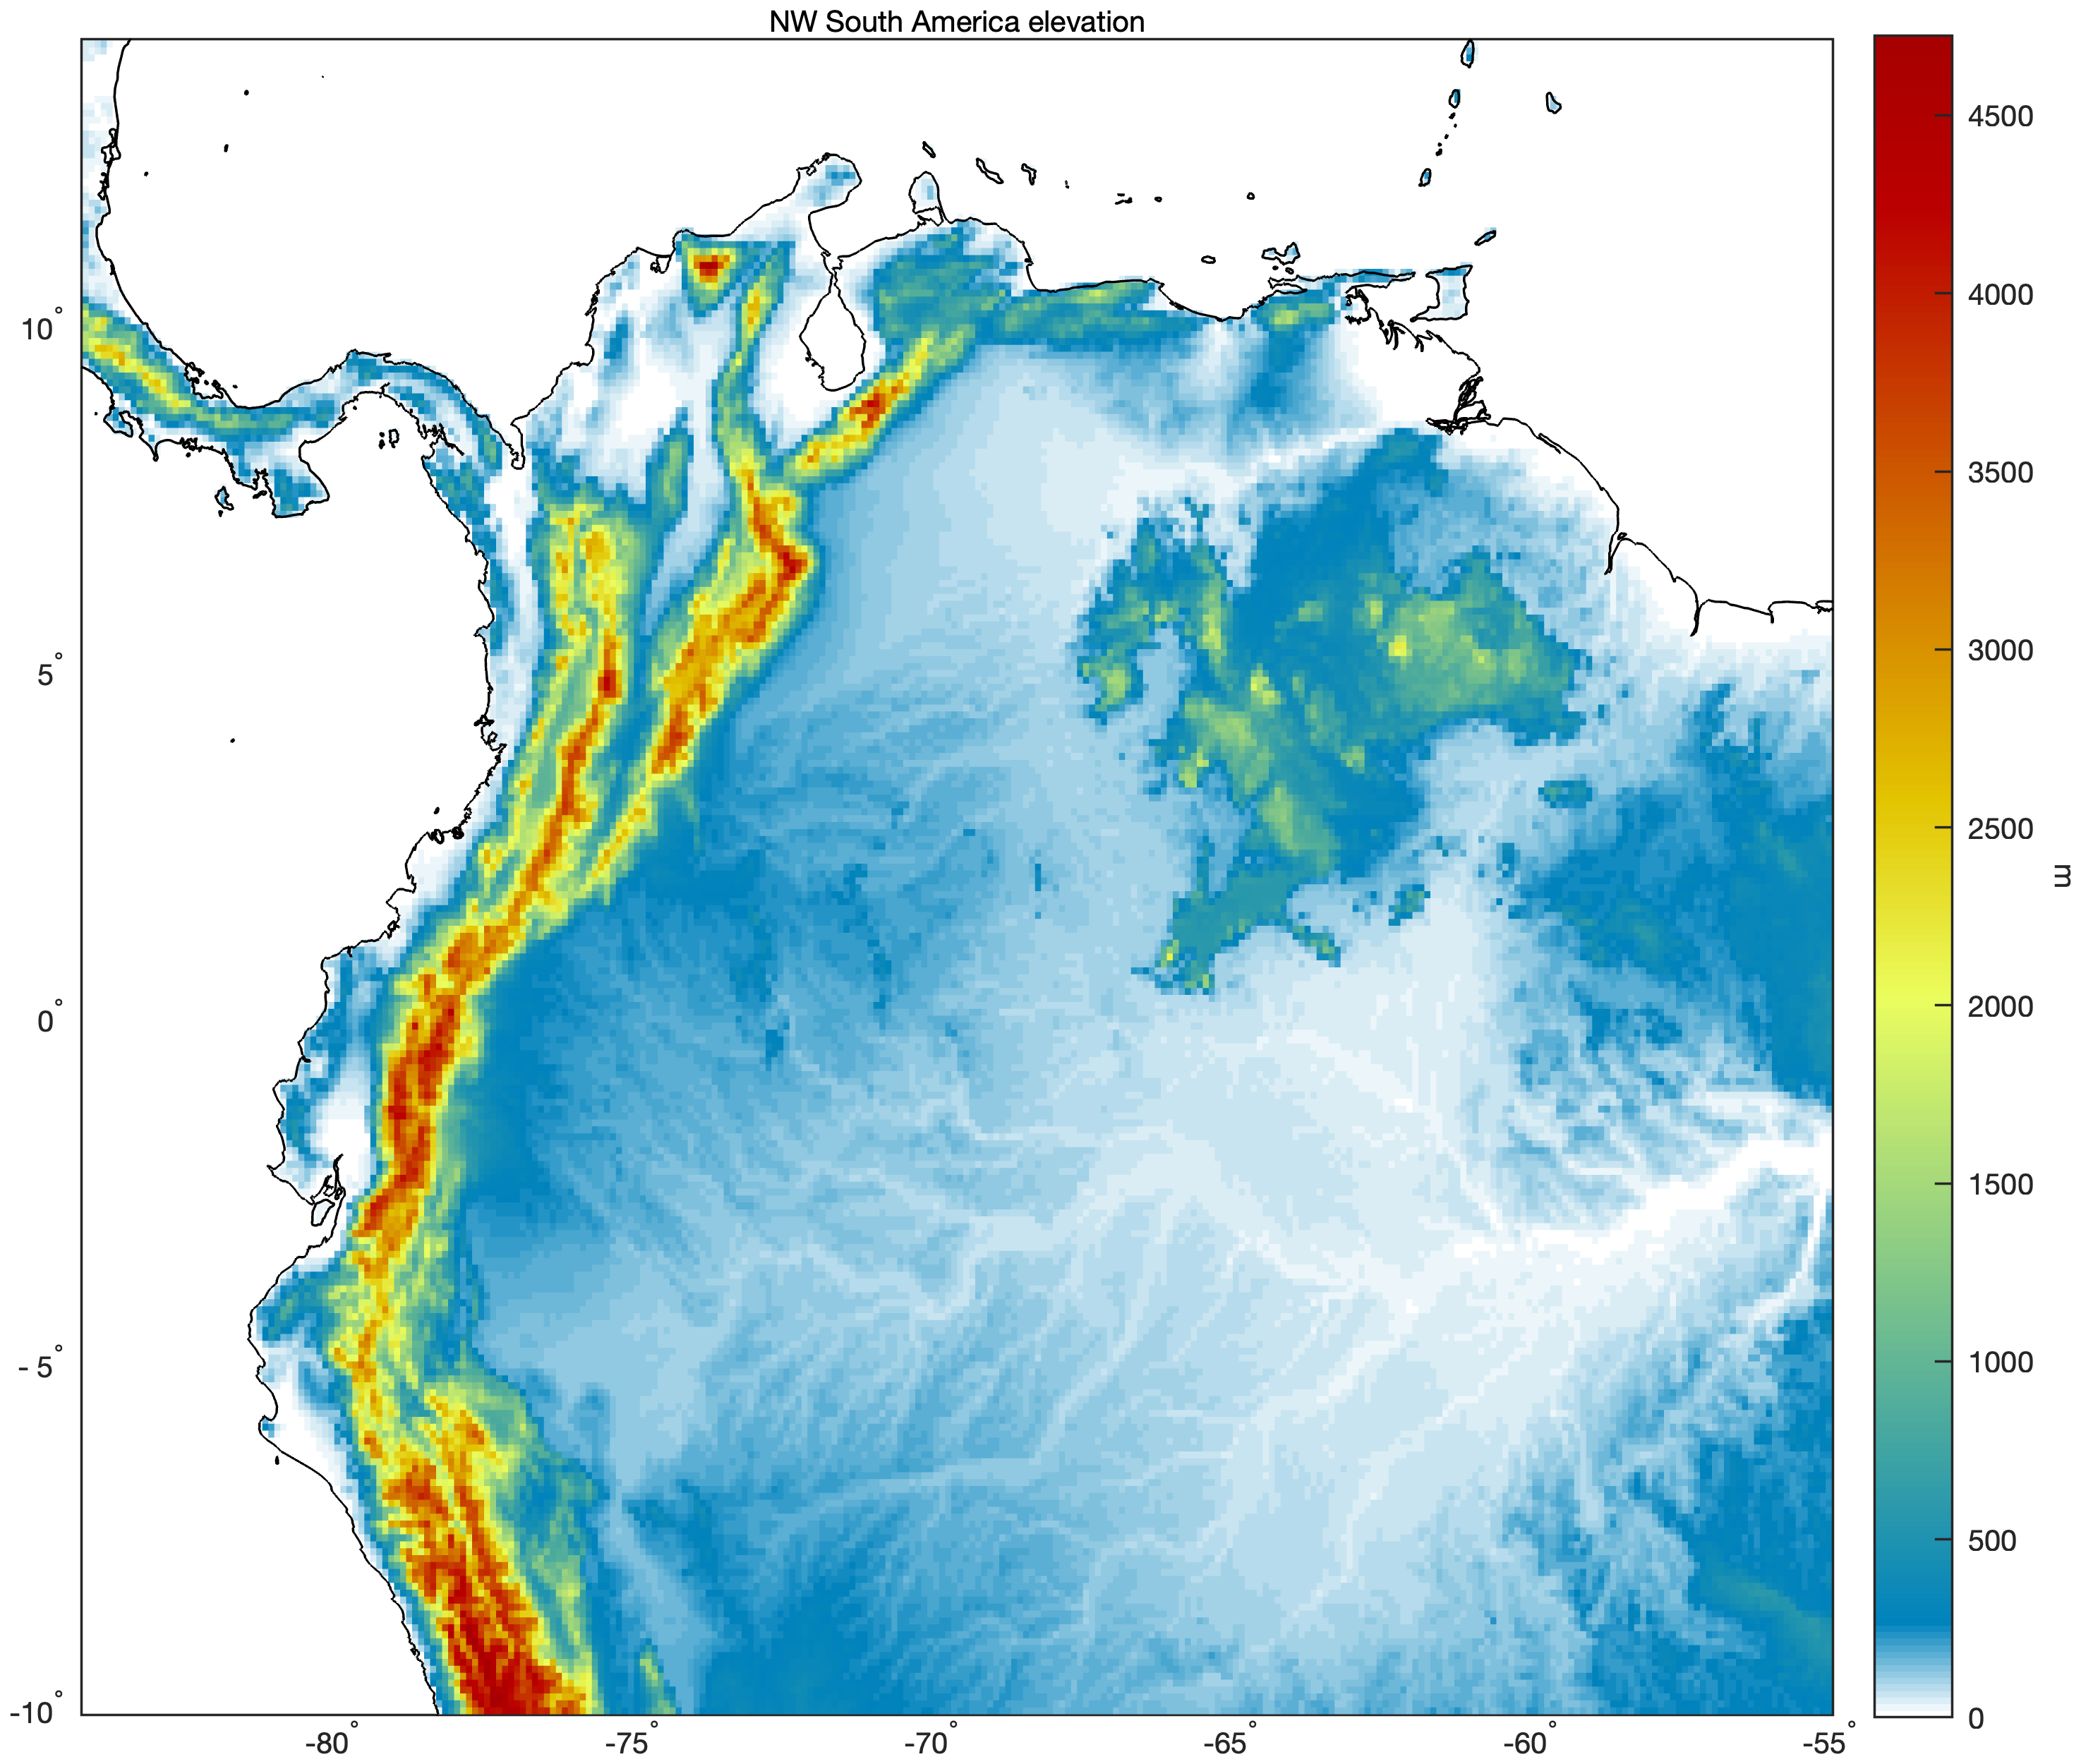
For all maps, WWLLN lightning has been gridded at 0.1º resolution with units of strokes km-2 yr-1; all months are included; thin lines indicate the 100-m, 300-m, 500-m, 1000-m, and 4000-m elevation contours; and the lightning scale is logarithmic. For comparison, we also provide animations of diurnal precipitation based on IMERG.
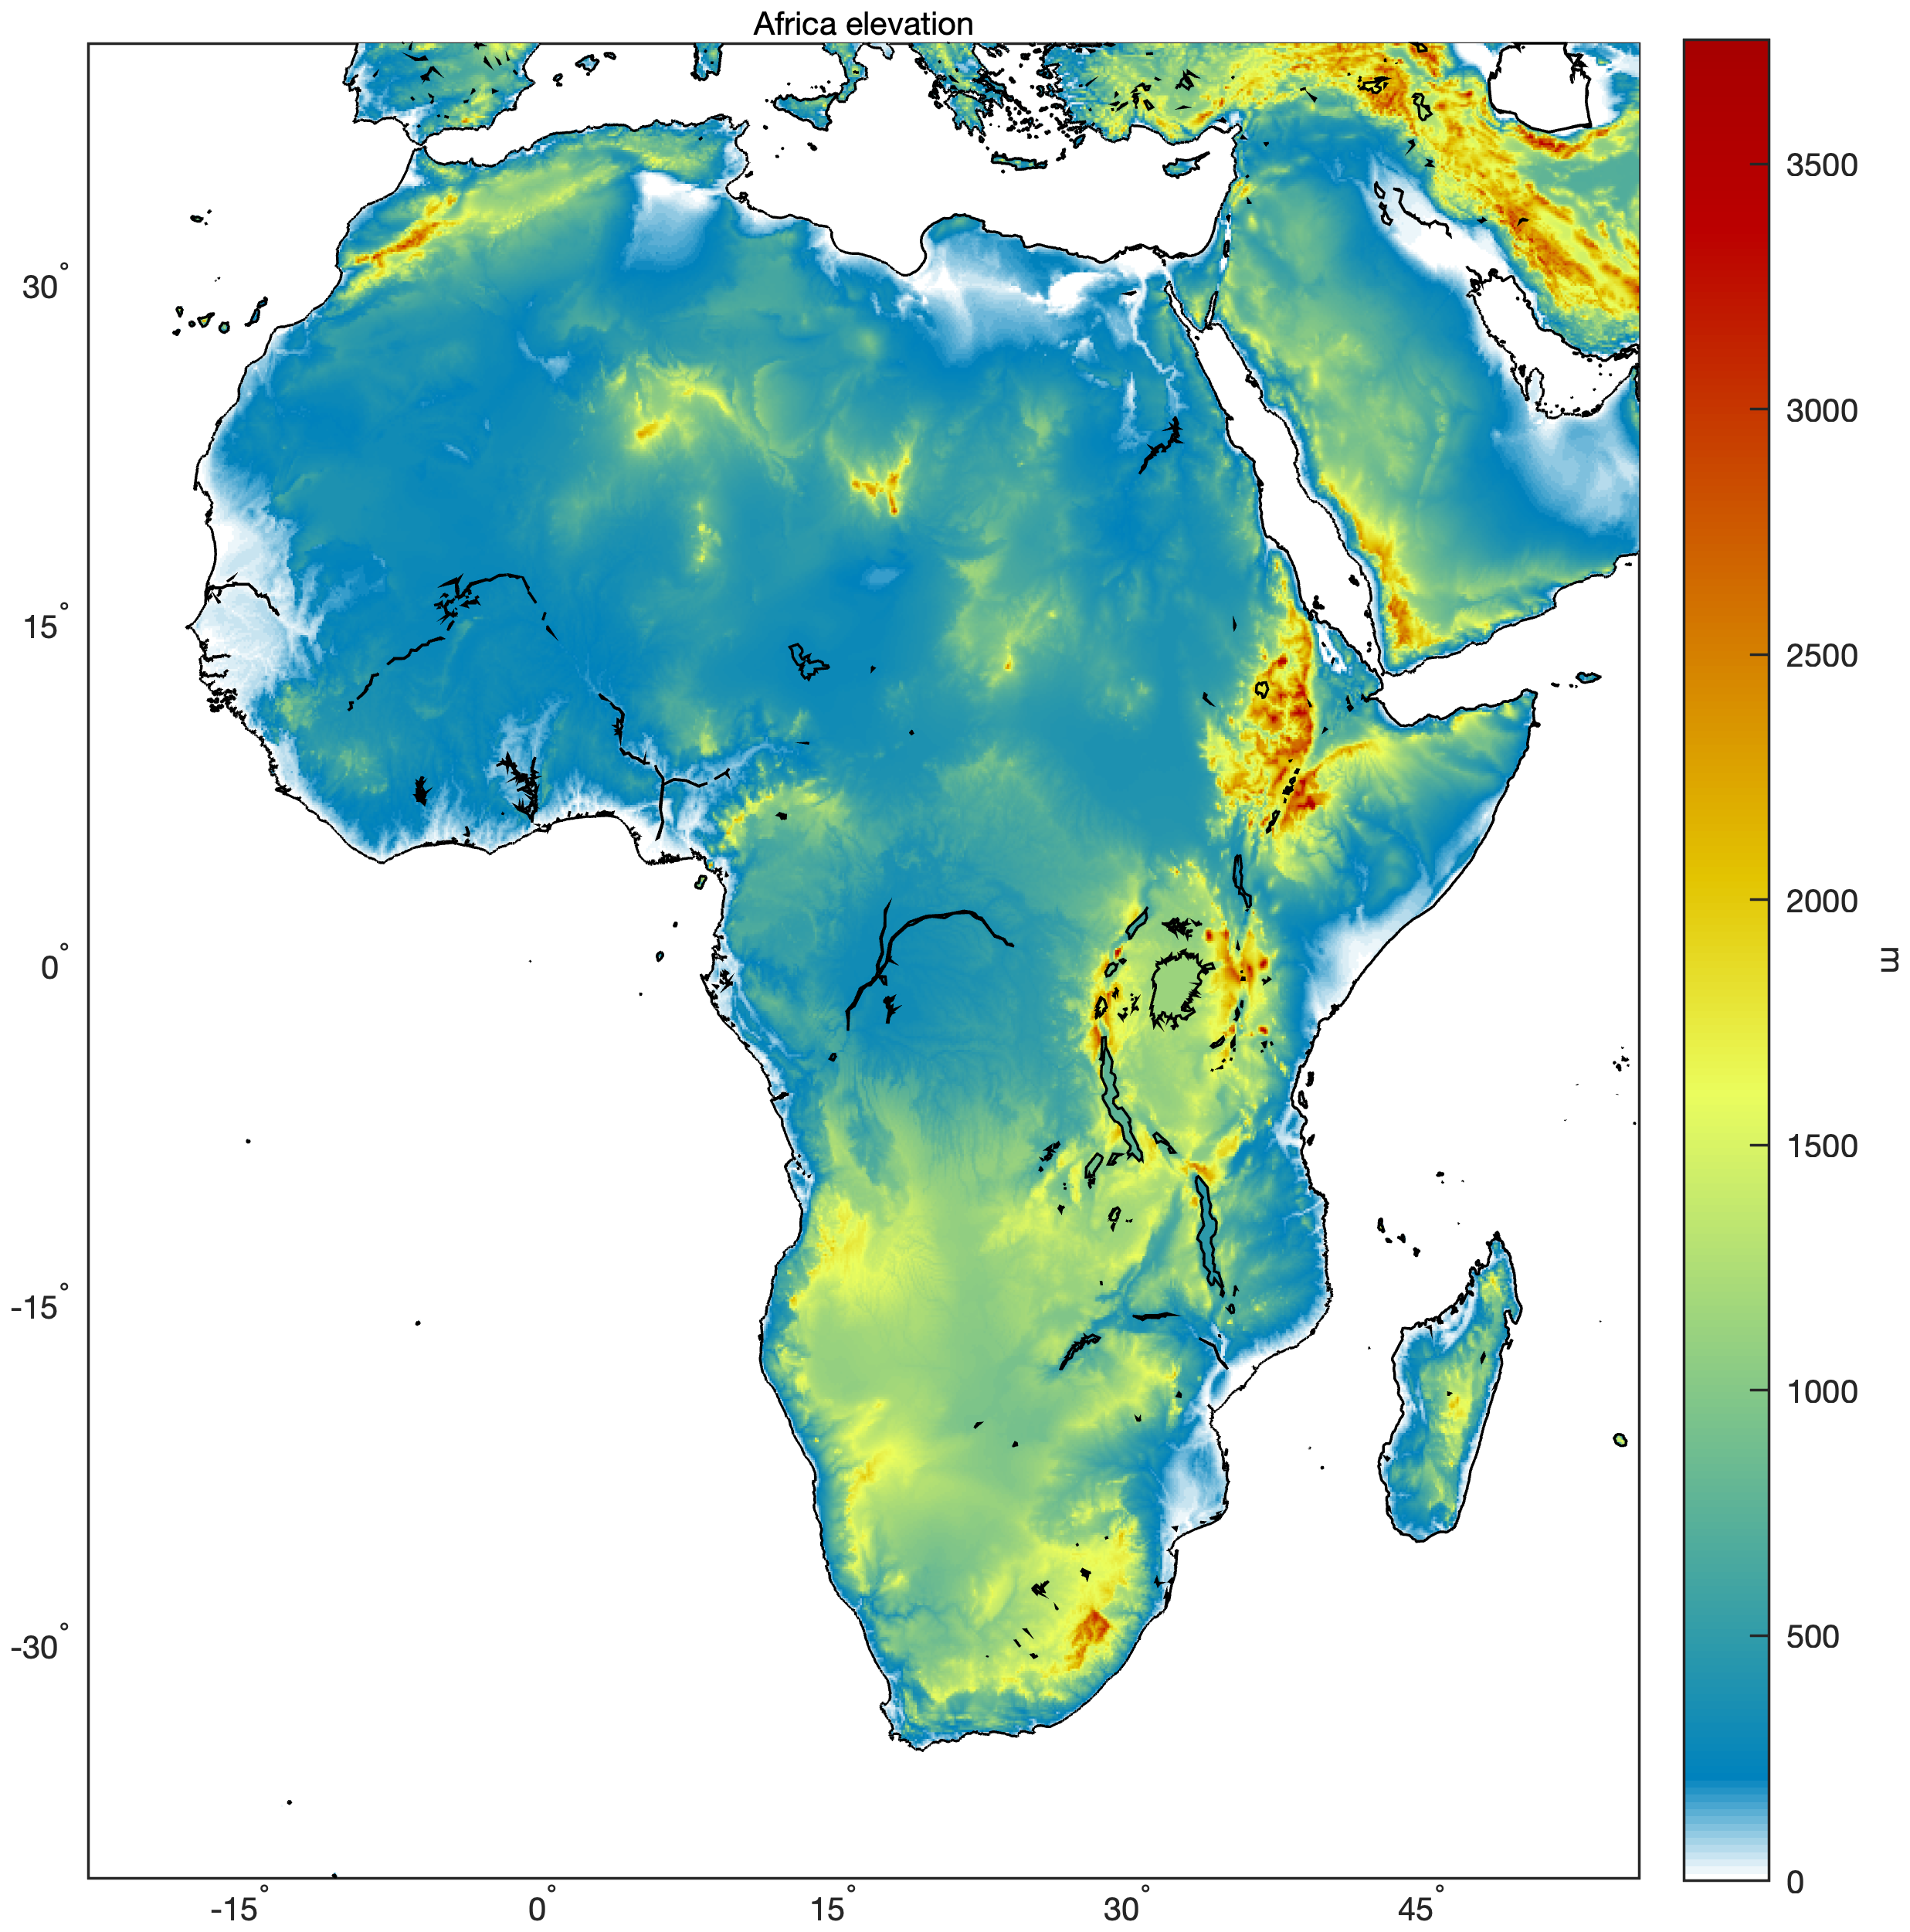
Africa (lightning and precipitation animations, elevation)
· Central Africa (lightning and precipitation animations, elevation)*
· Madagascar (lightning and precipitation animations, elevation)
· Southern Africa (lightning and precipitation animations, elevation)
· Western Africa (lightning and precipitation animations, elevation)*
Asia (lightning and precipitation animations, elevation)
· India (lightning and precipitation animations, elevation)
· Persian Gulf (lightning and precipitation animations, elevation)
· Philippines (lightning and precipitation animations, elevation)
· Red Sea (lightning and precipitation animations, elevation)
· Southeast Asia (lightning and precipitation animations, elevation)
· Southern India (lightning and precipitation animations, elevation)
Australasia/Oceania (lightning and precipitation animations, elevation)
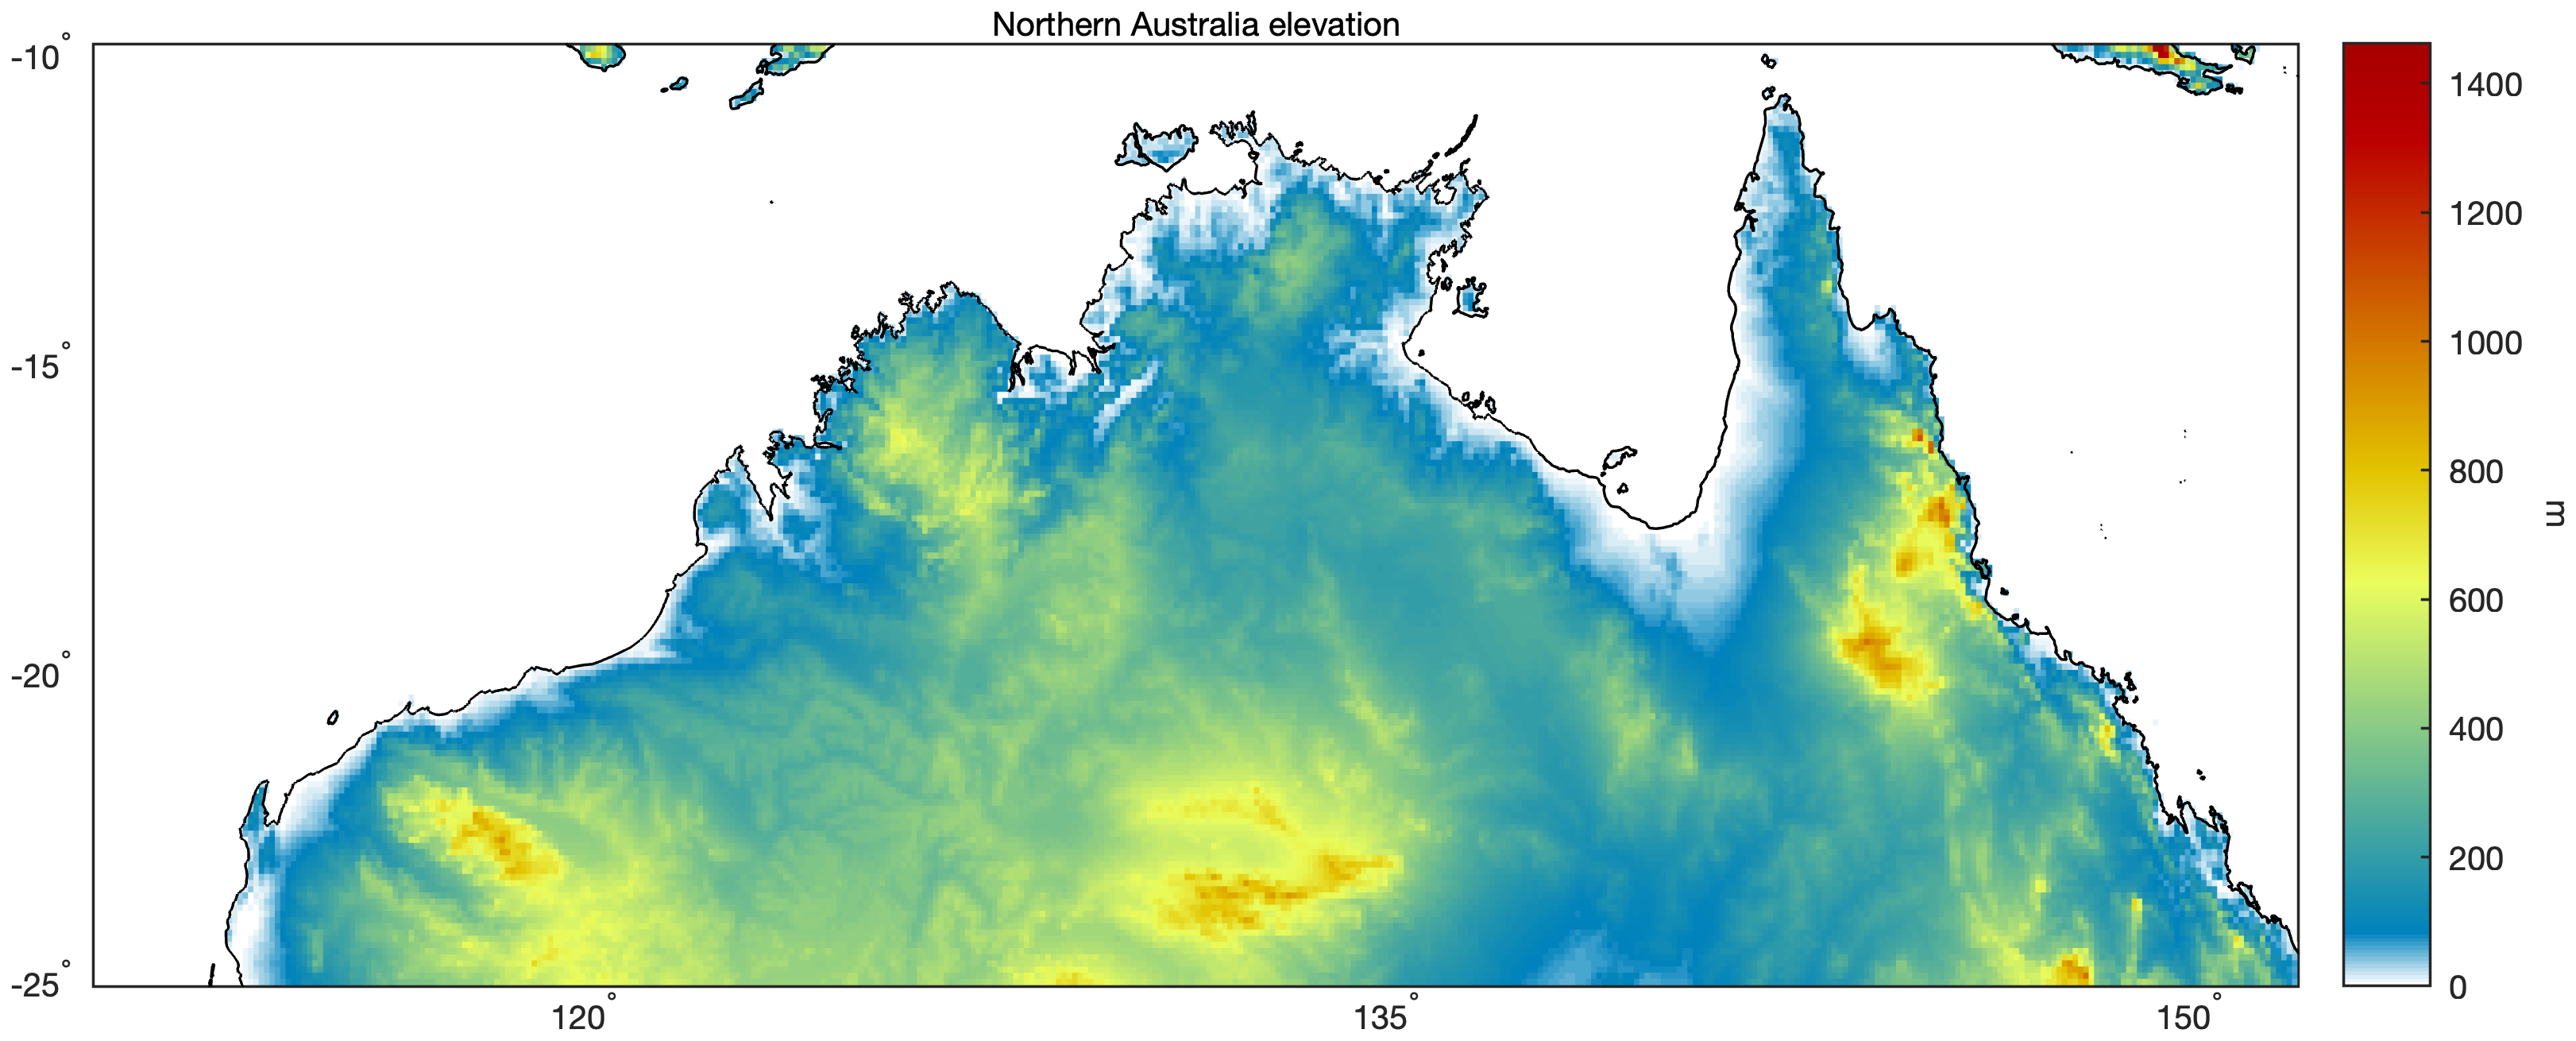
· Australia (lightning and precipitation animations, elevation)
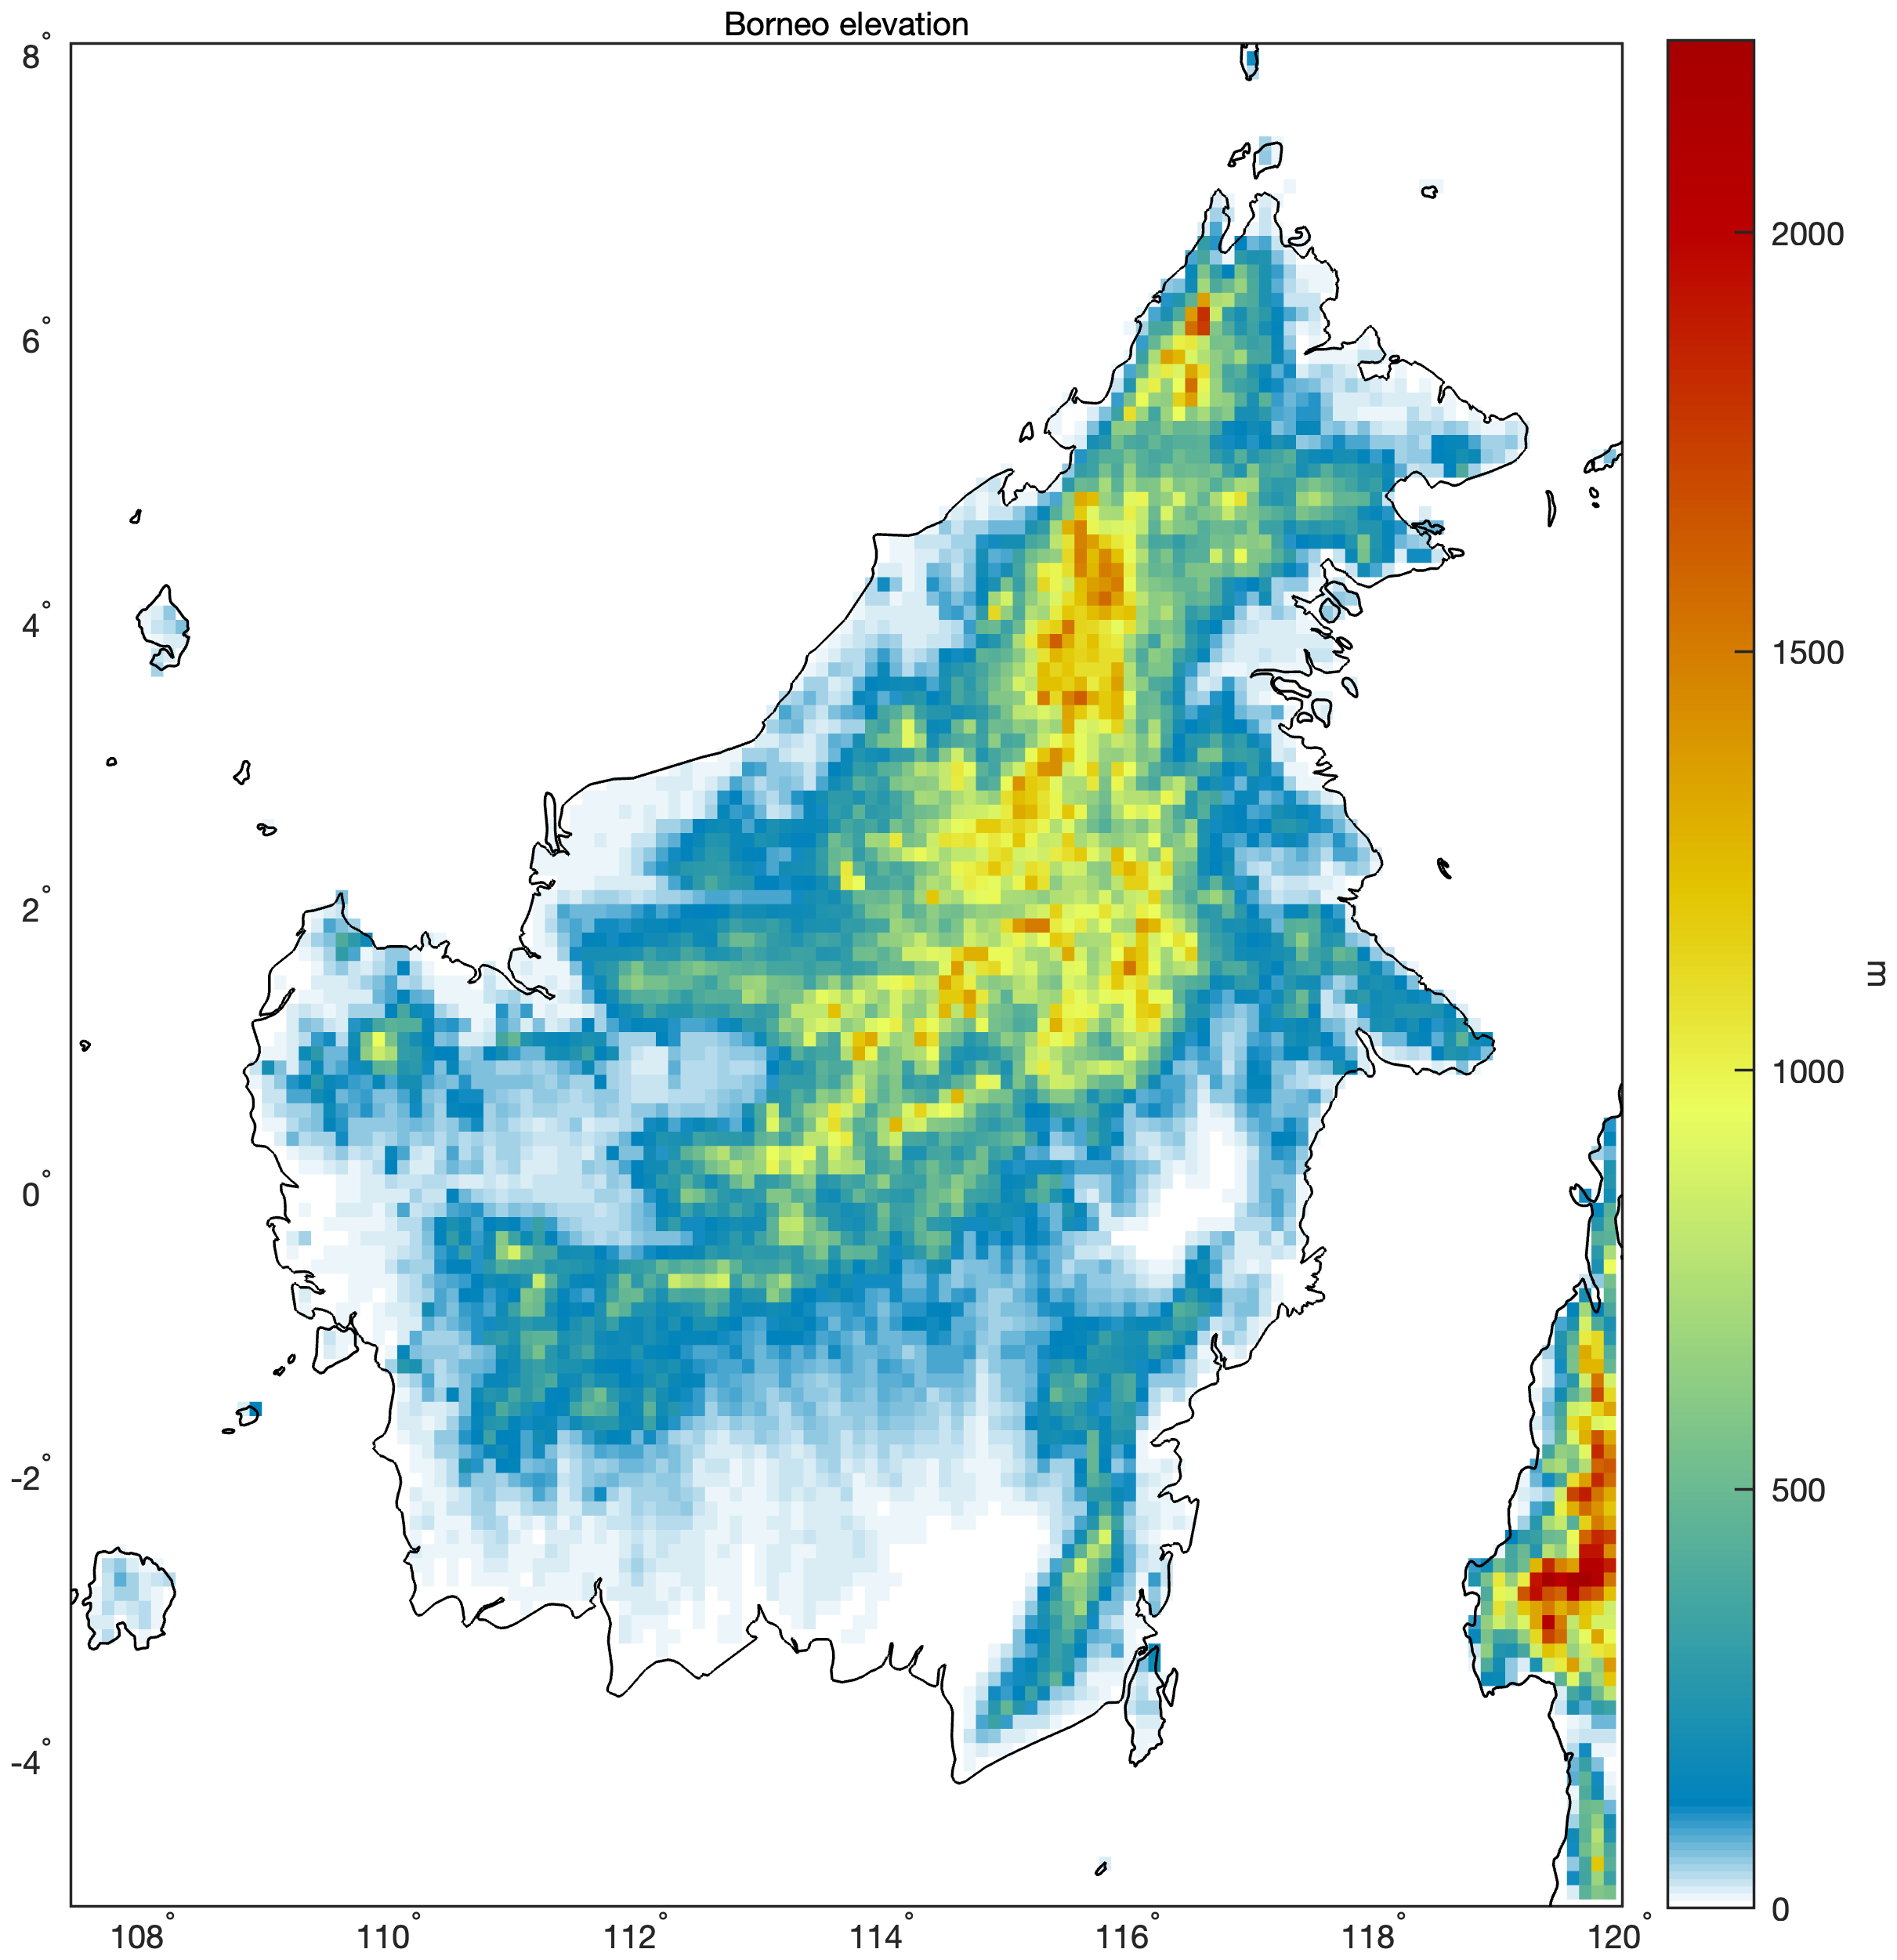
· Borneo (lightning and precipitation animations, elevation)
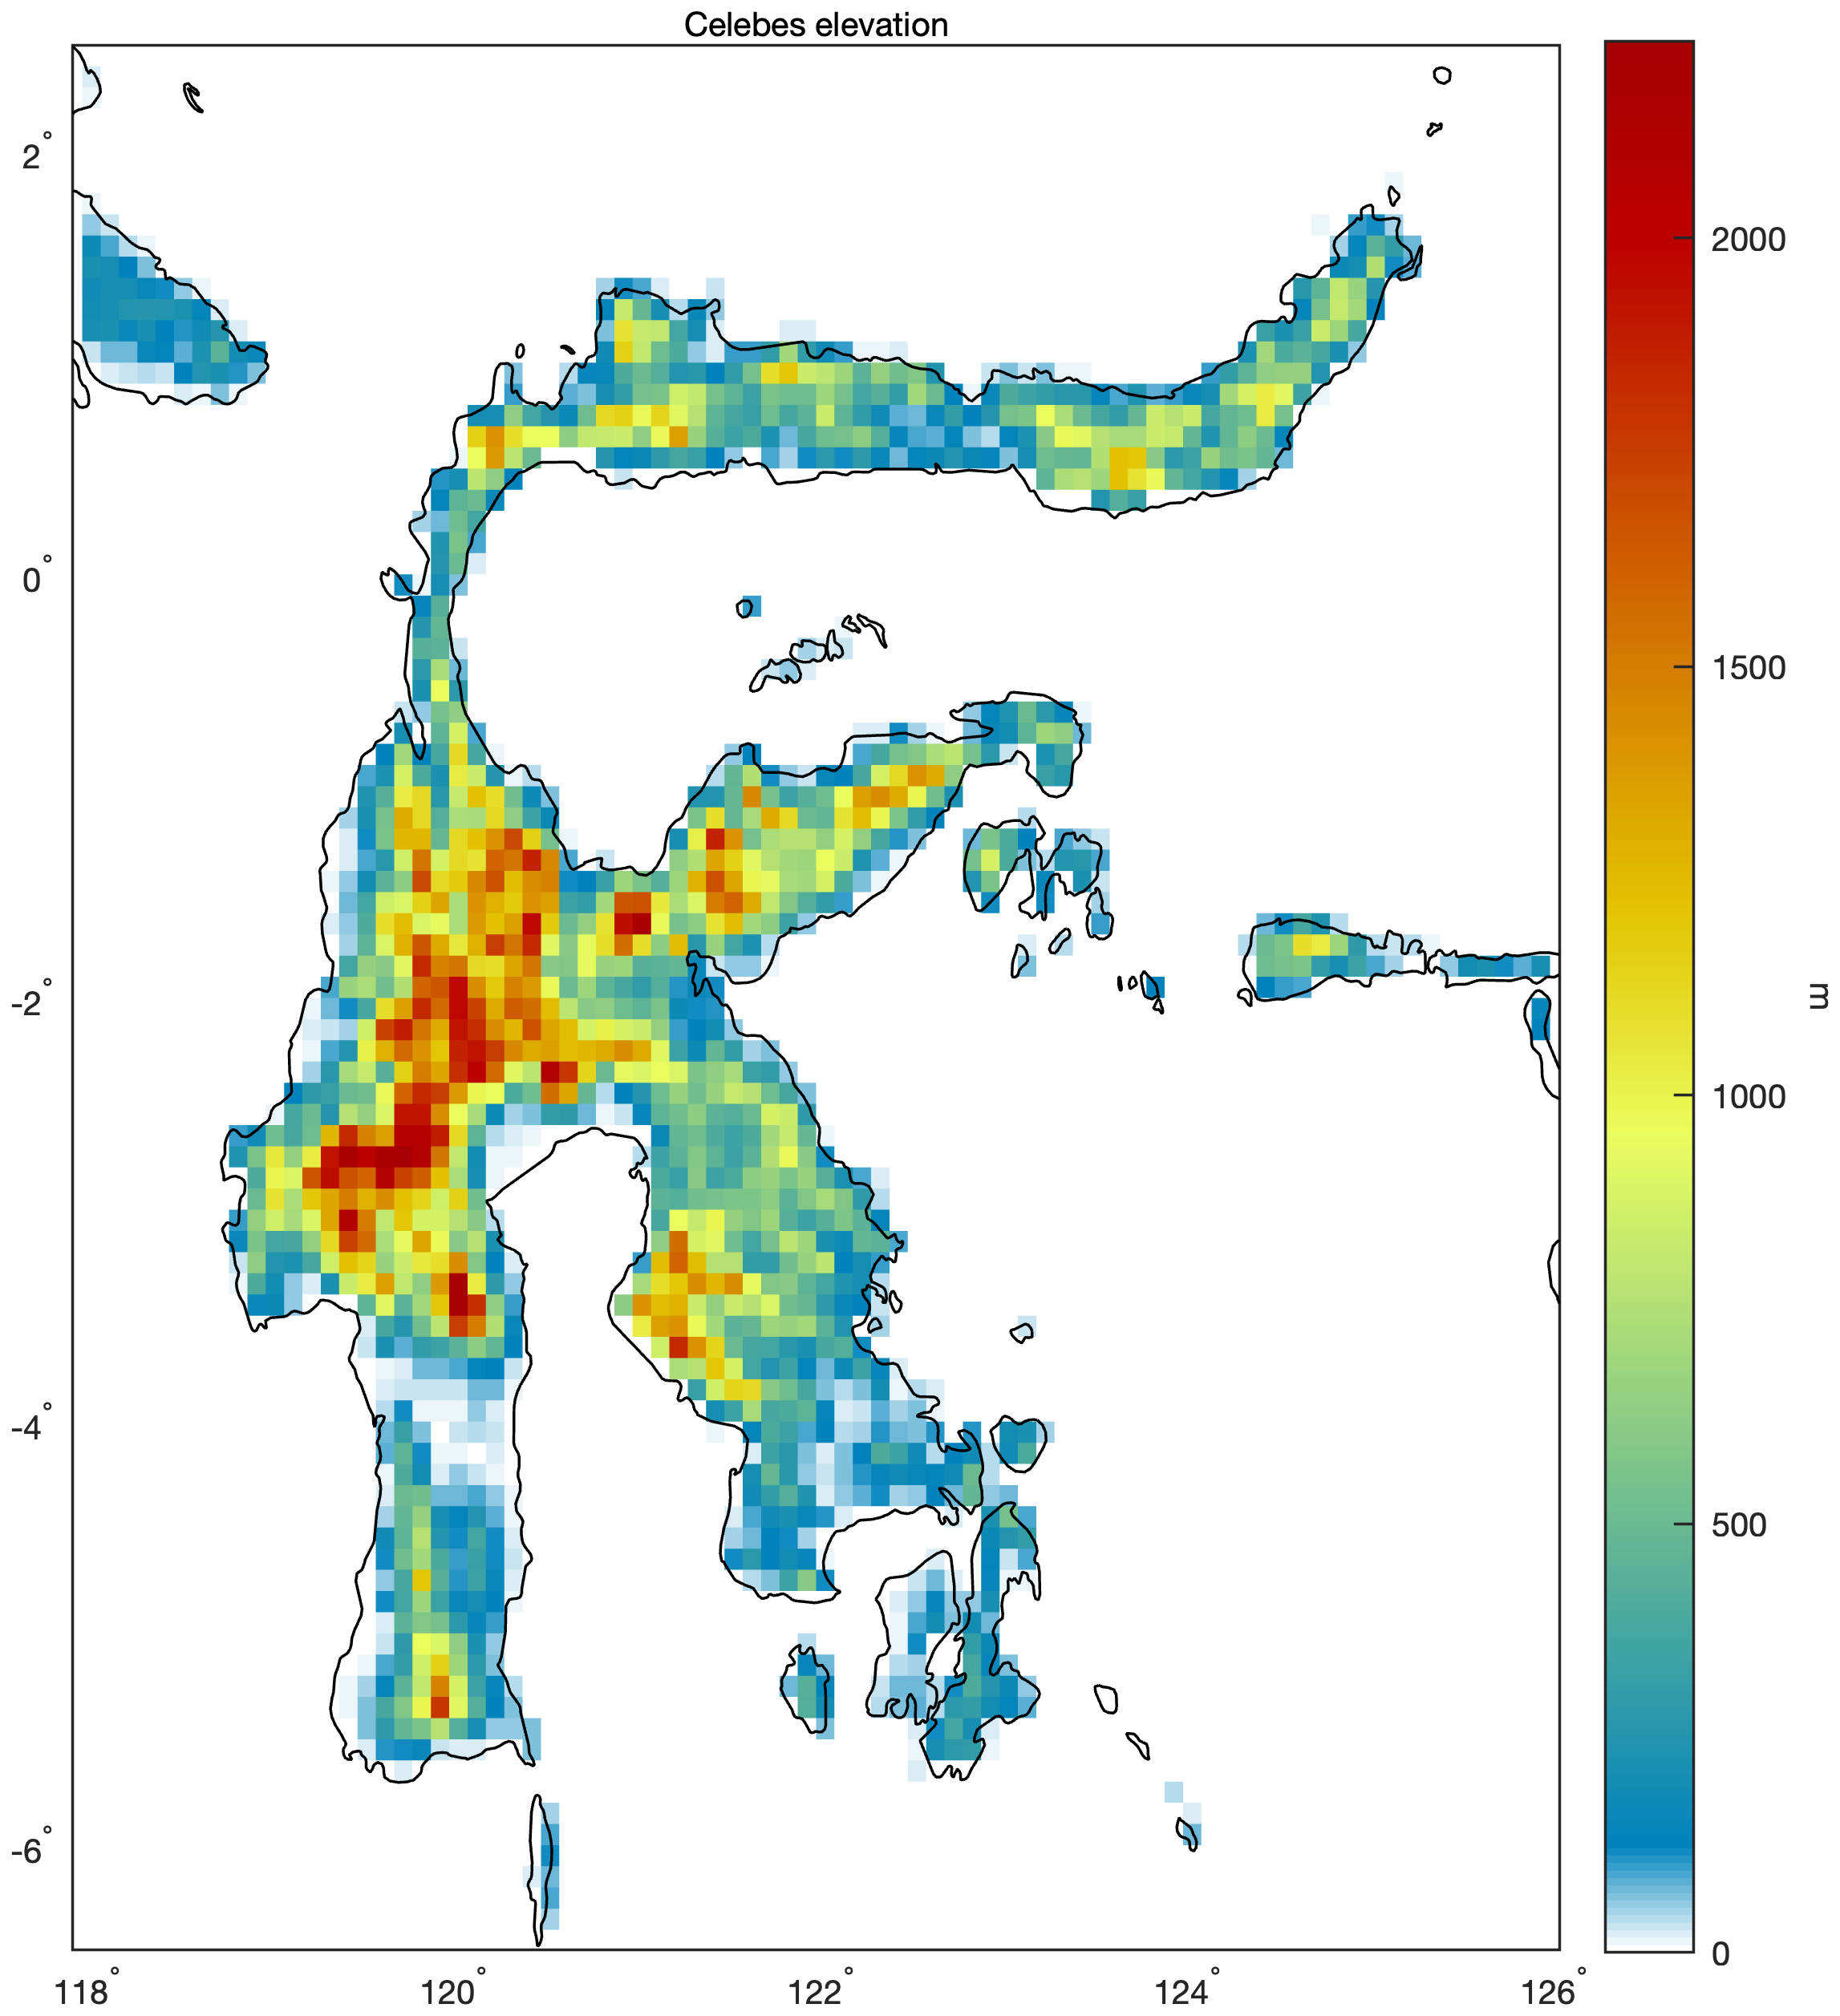
· Celebes (lightning and precipitation animations, elevation)
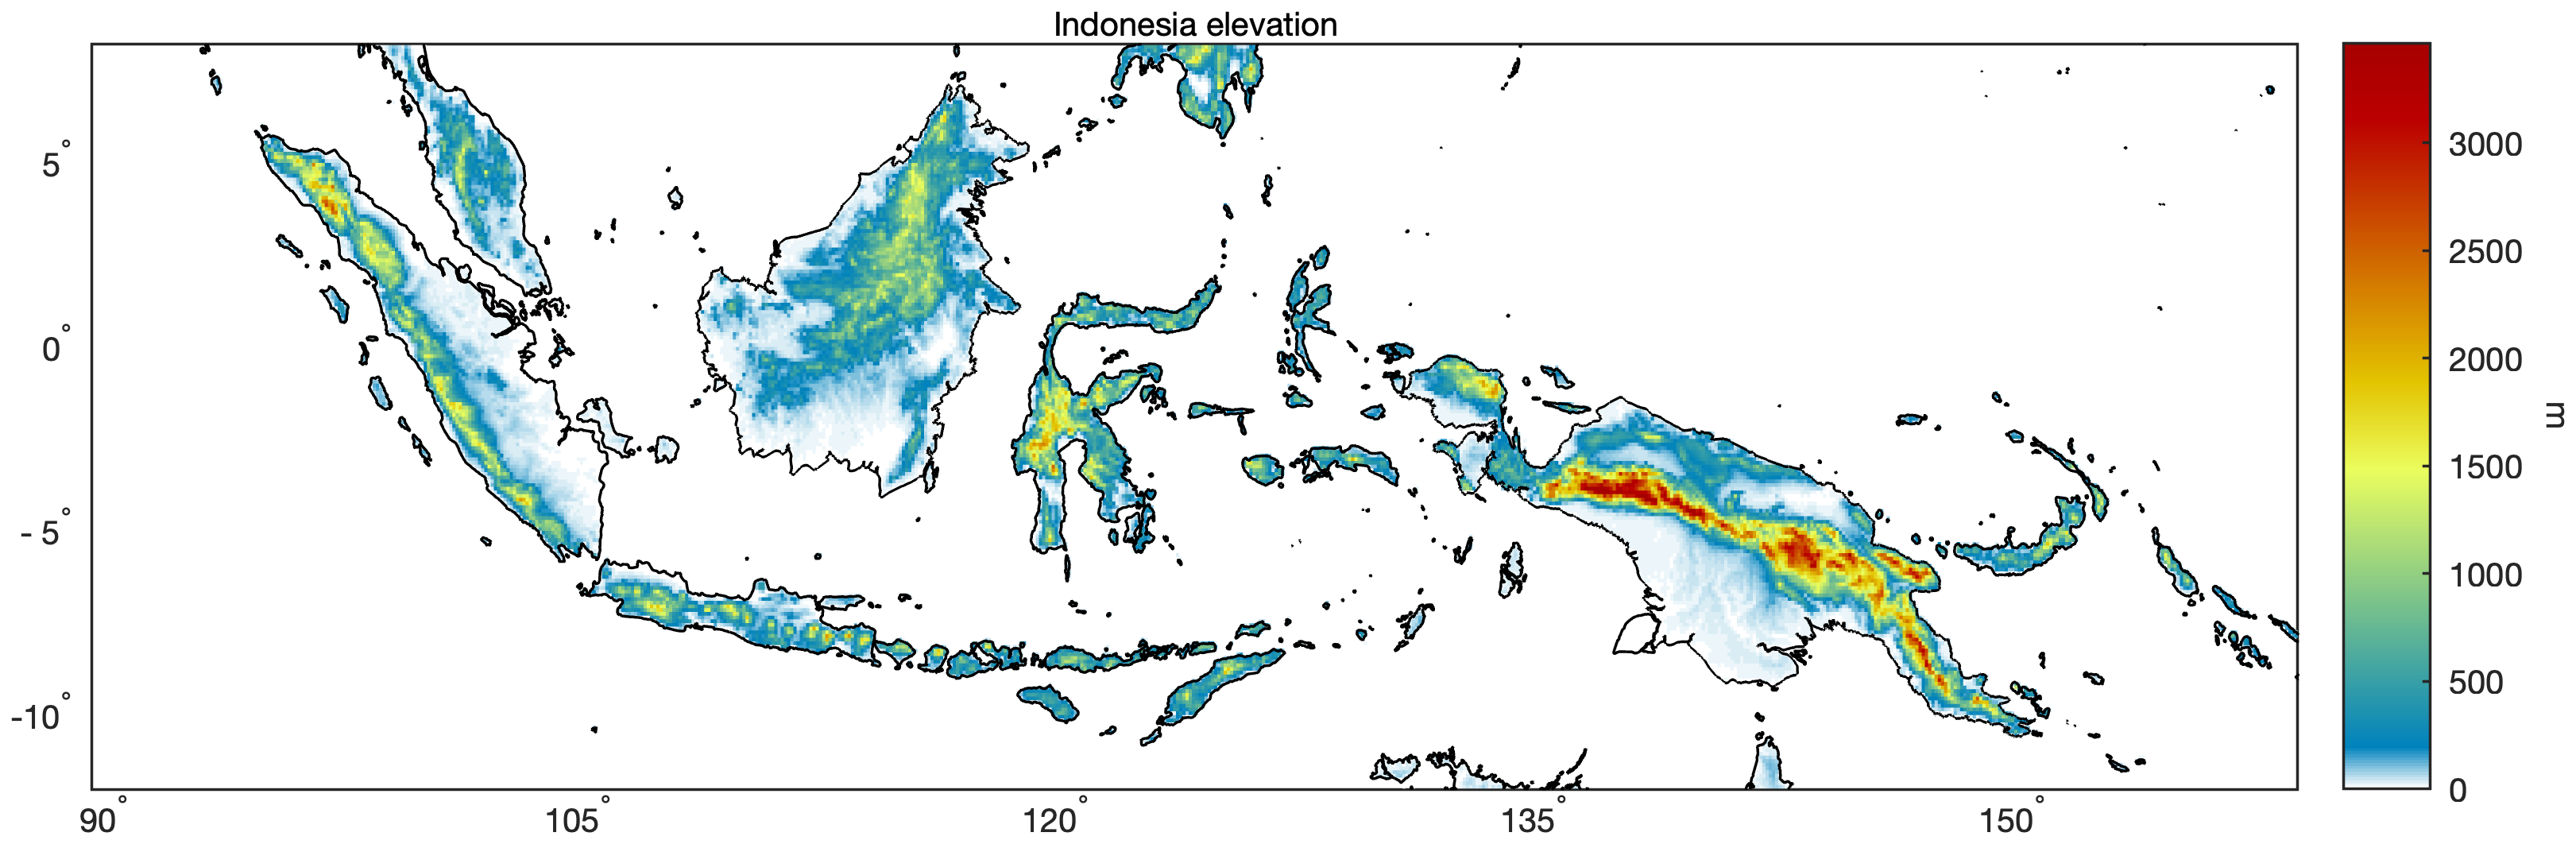
· Indonesia (lightning and precipitation animations, elevation)*
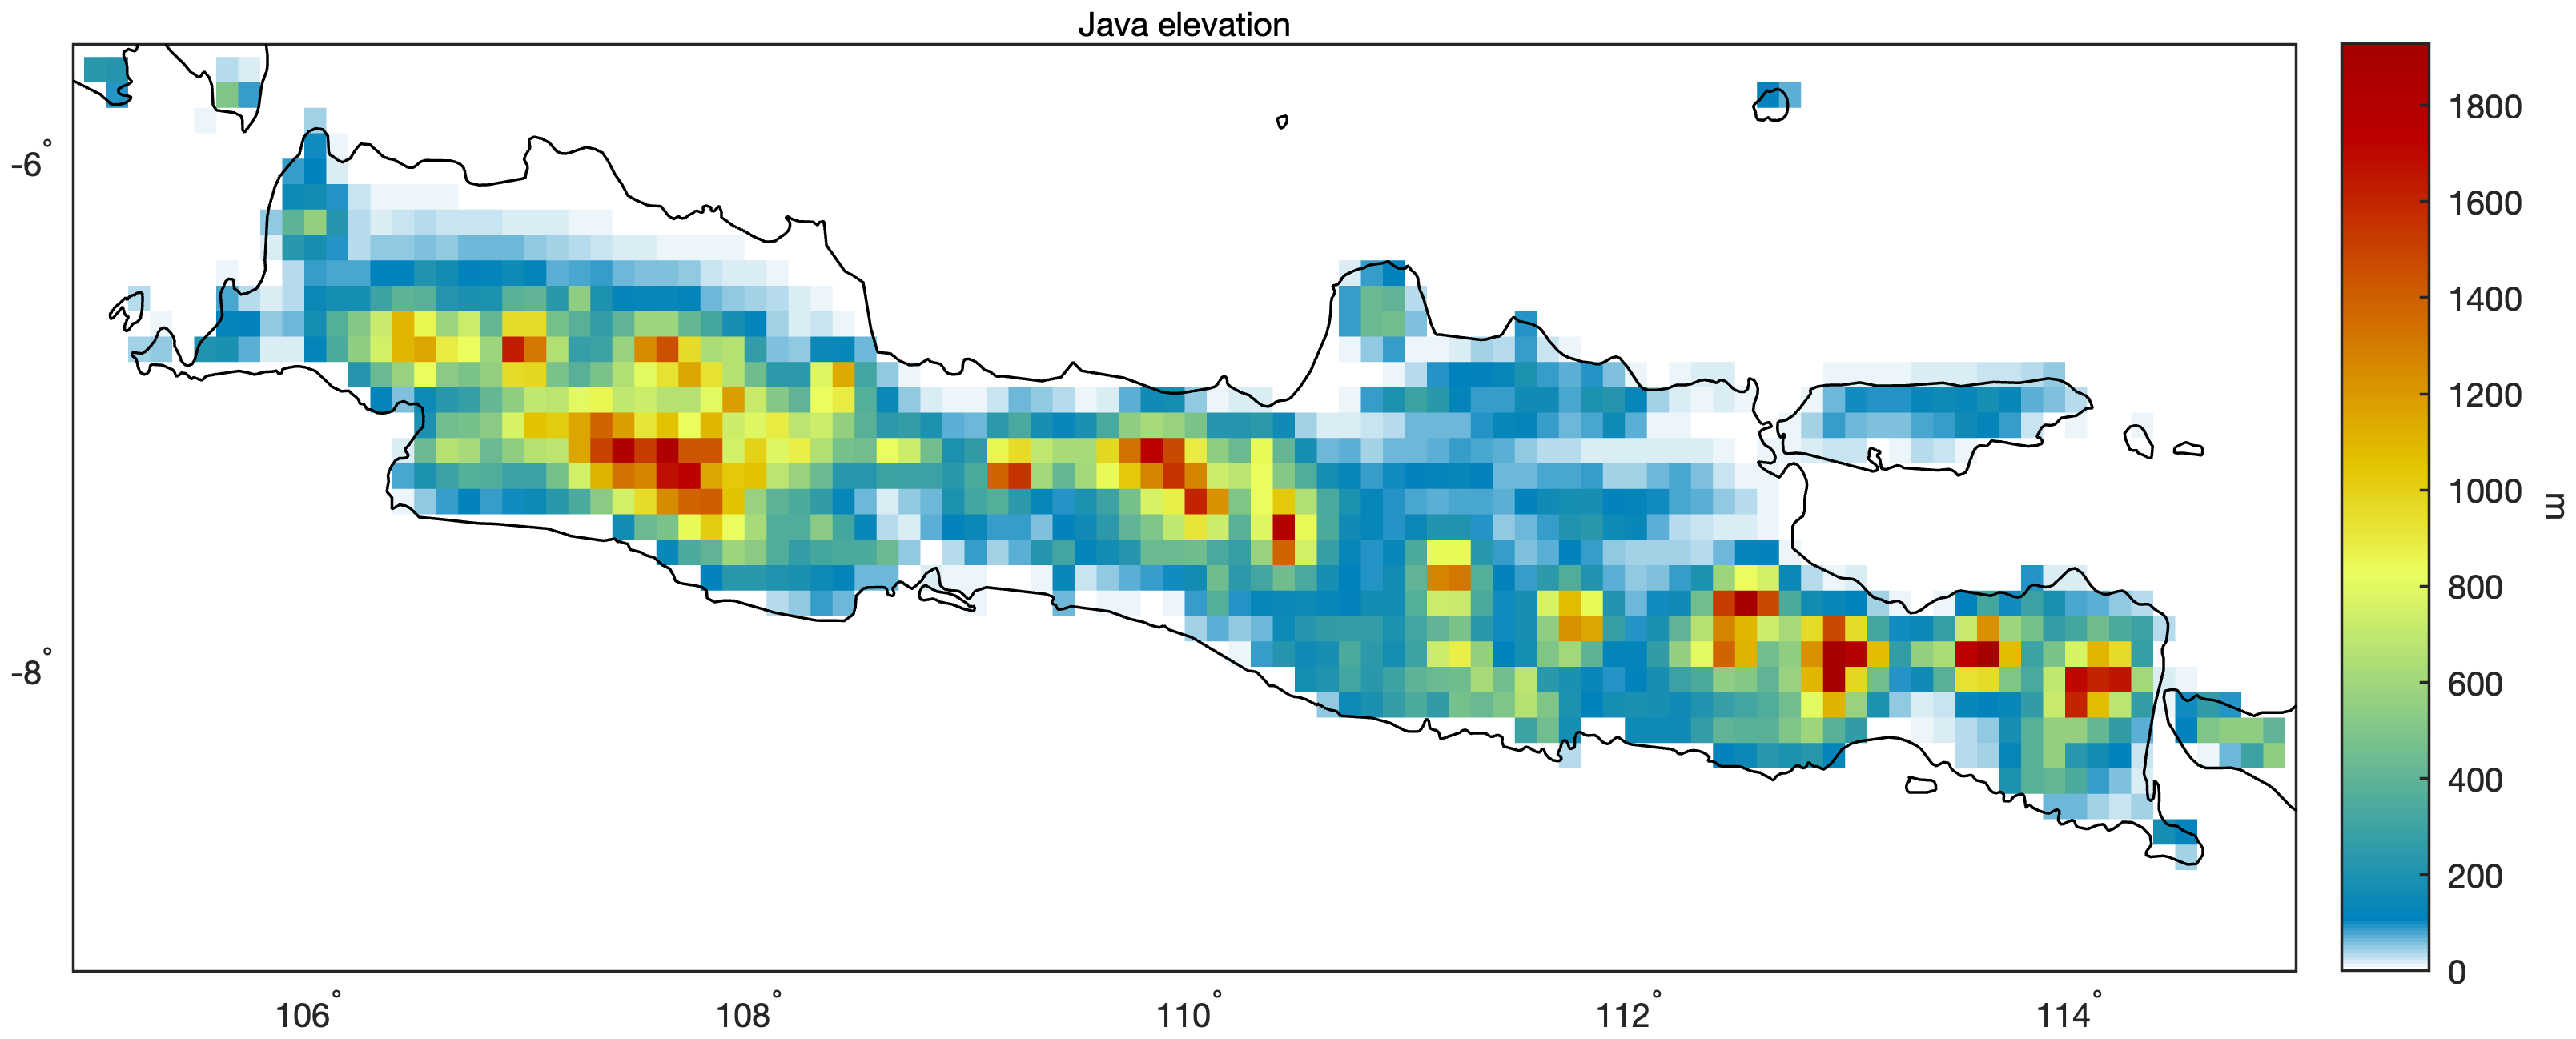
· Java (lightning and precipitation animations, elevation)
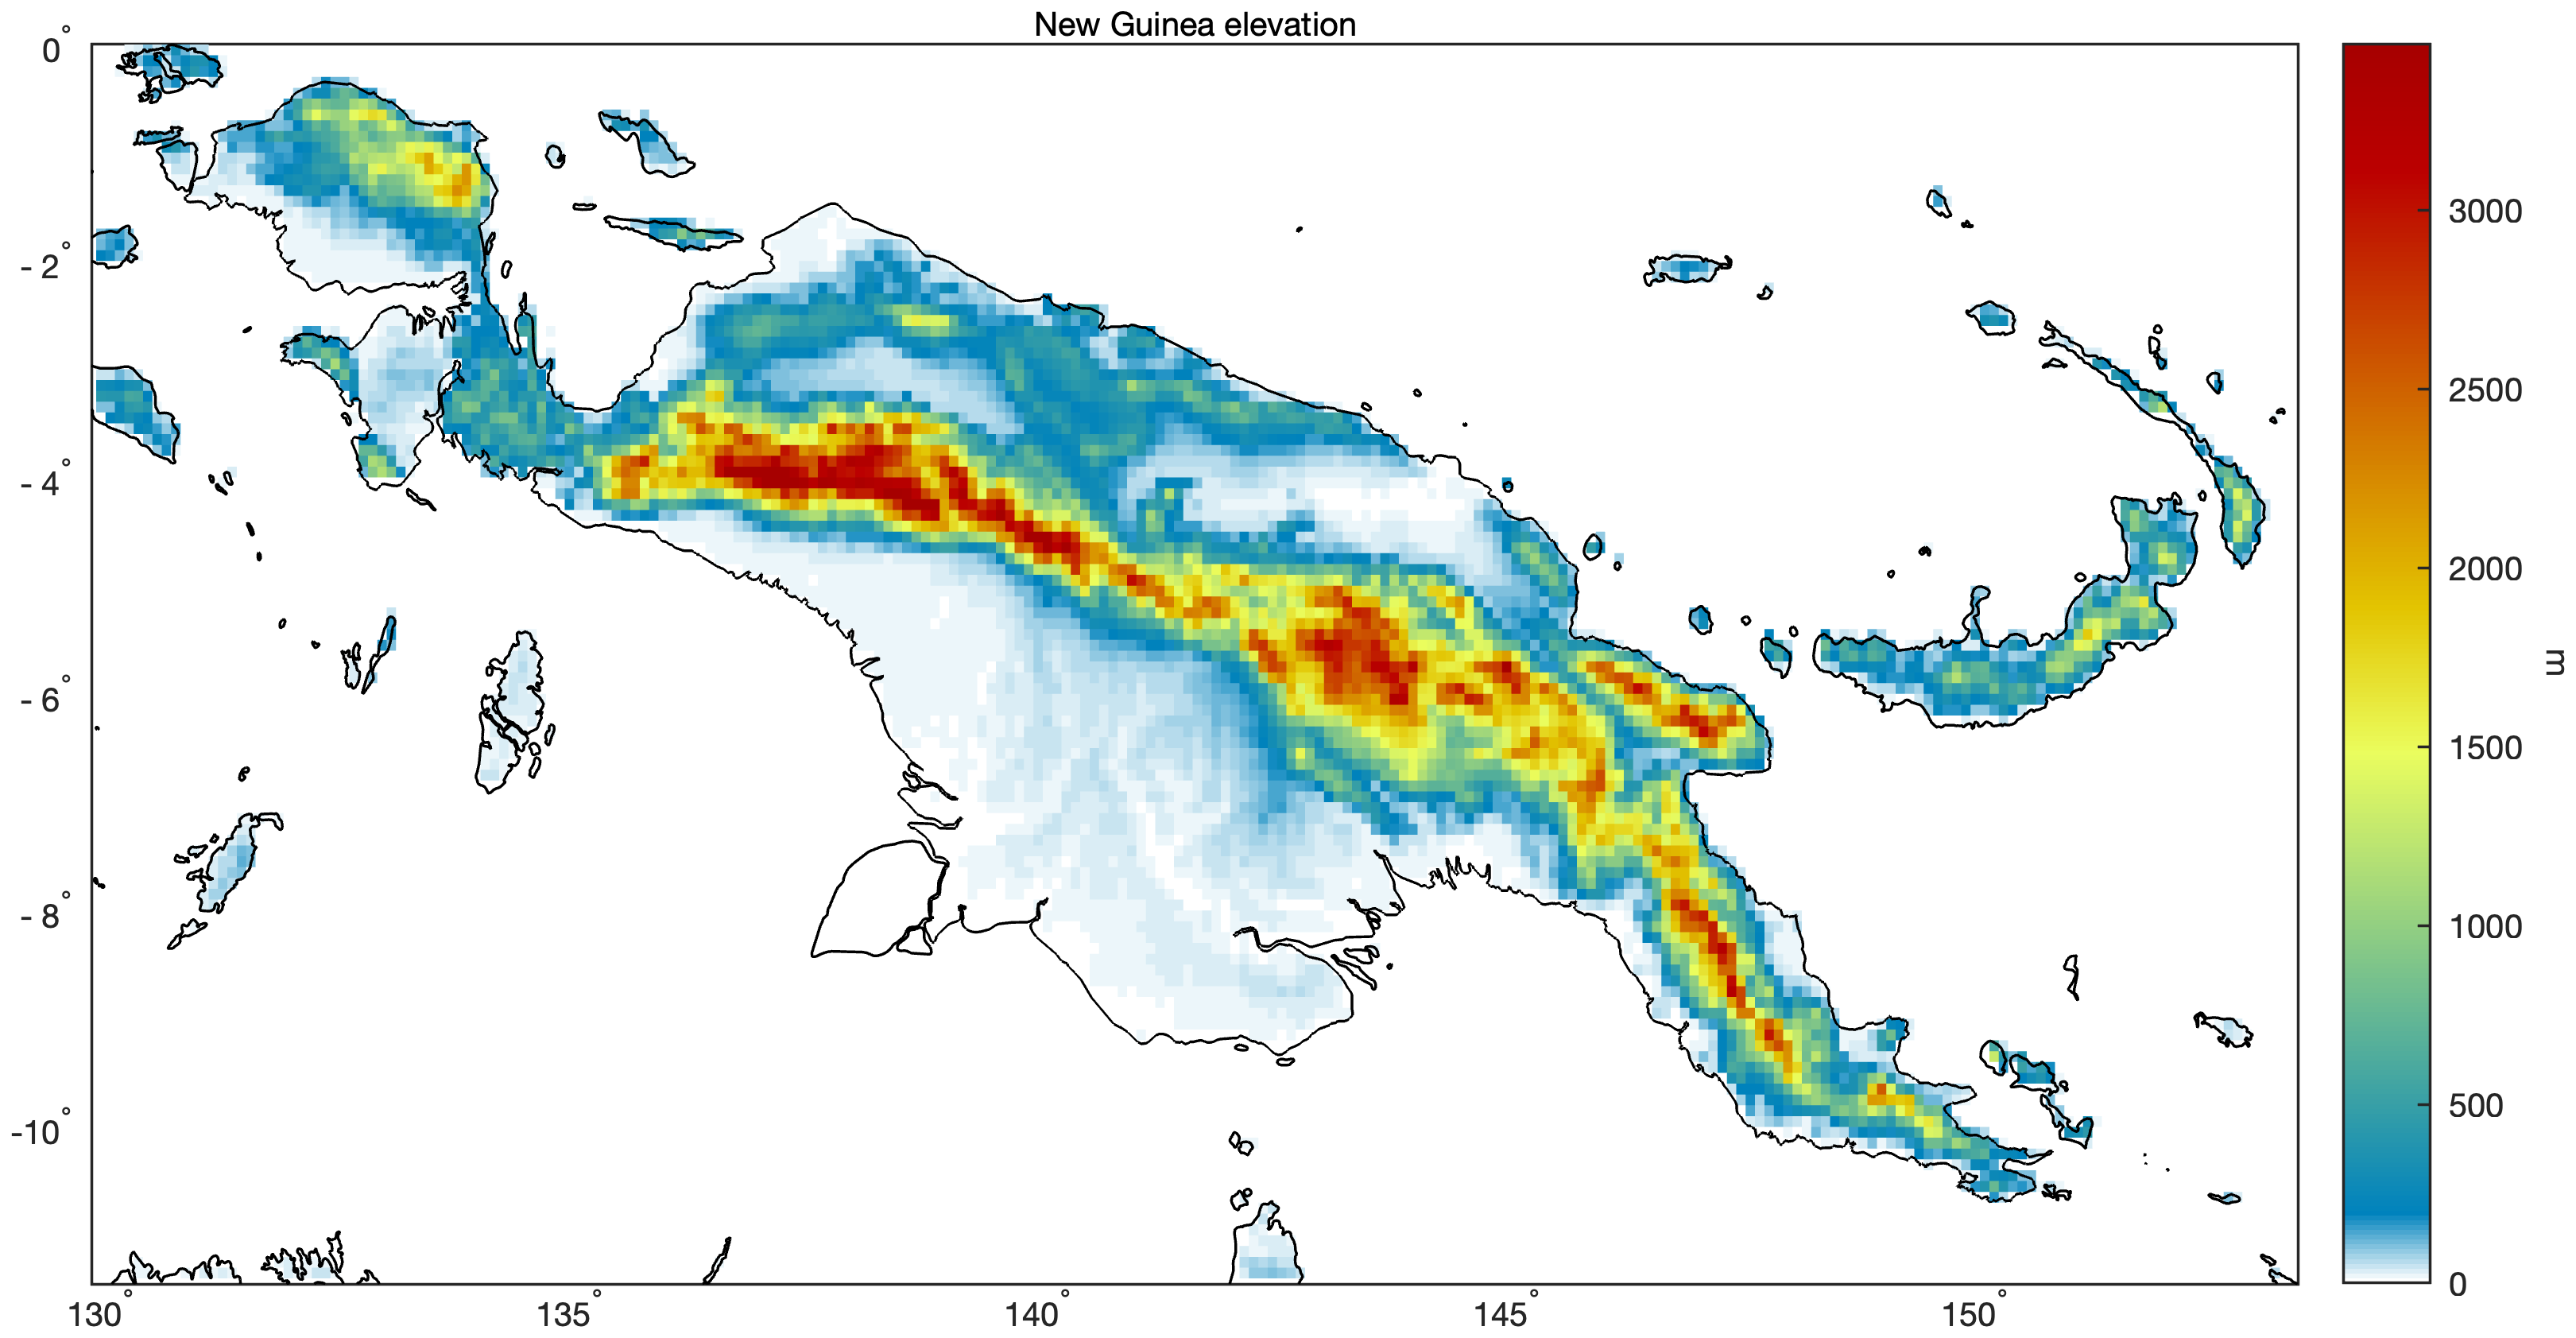
· New Guinea (lightning and precipitation animations, elevation)*
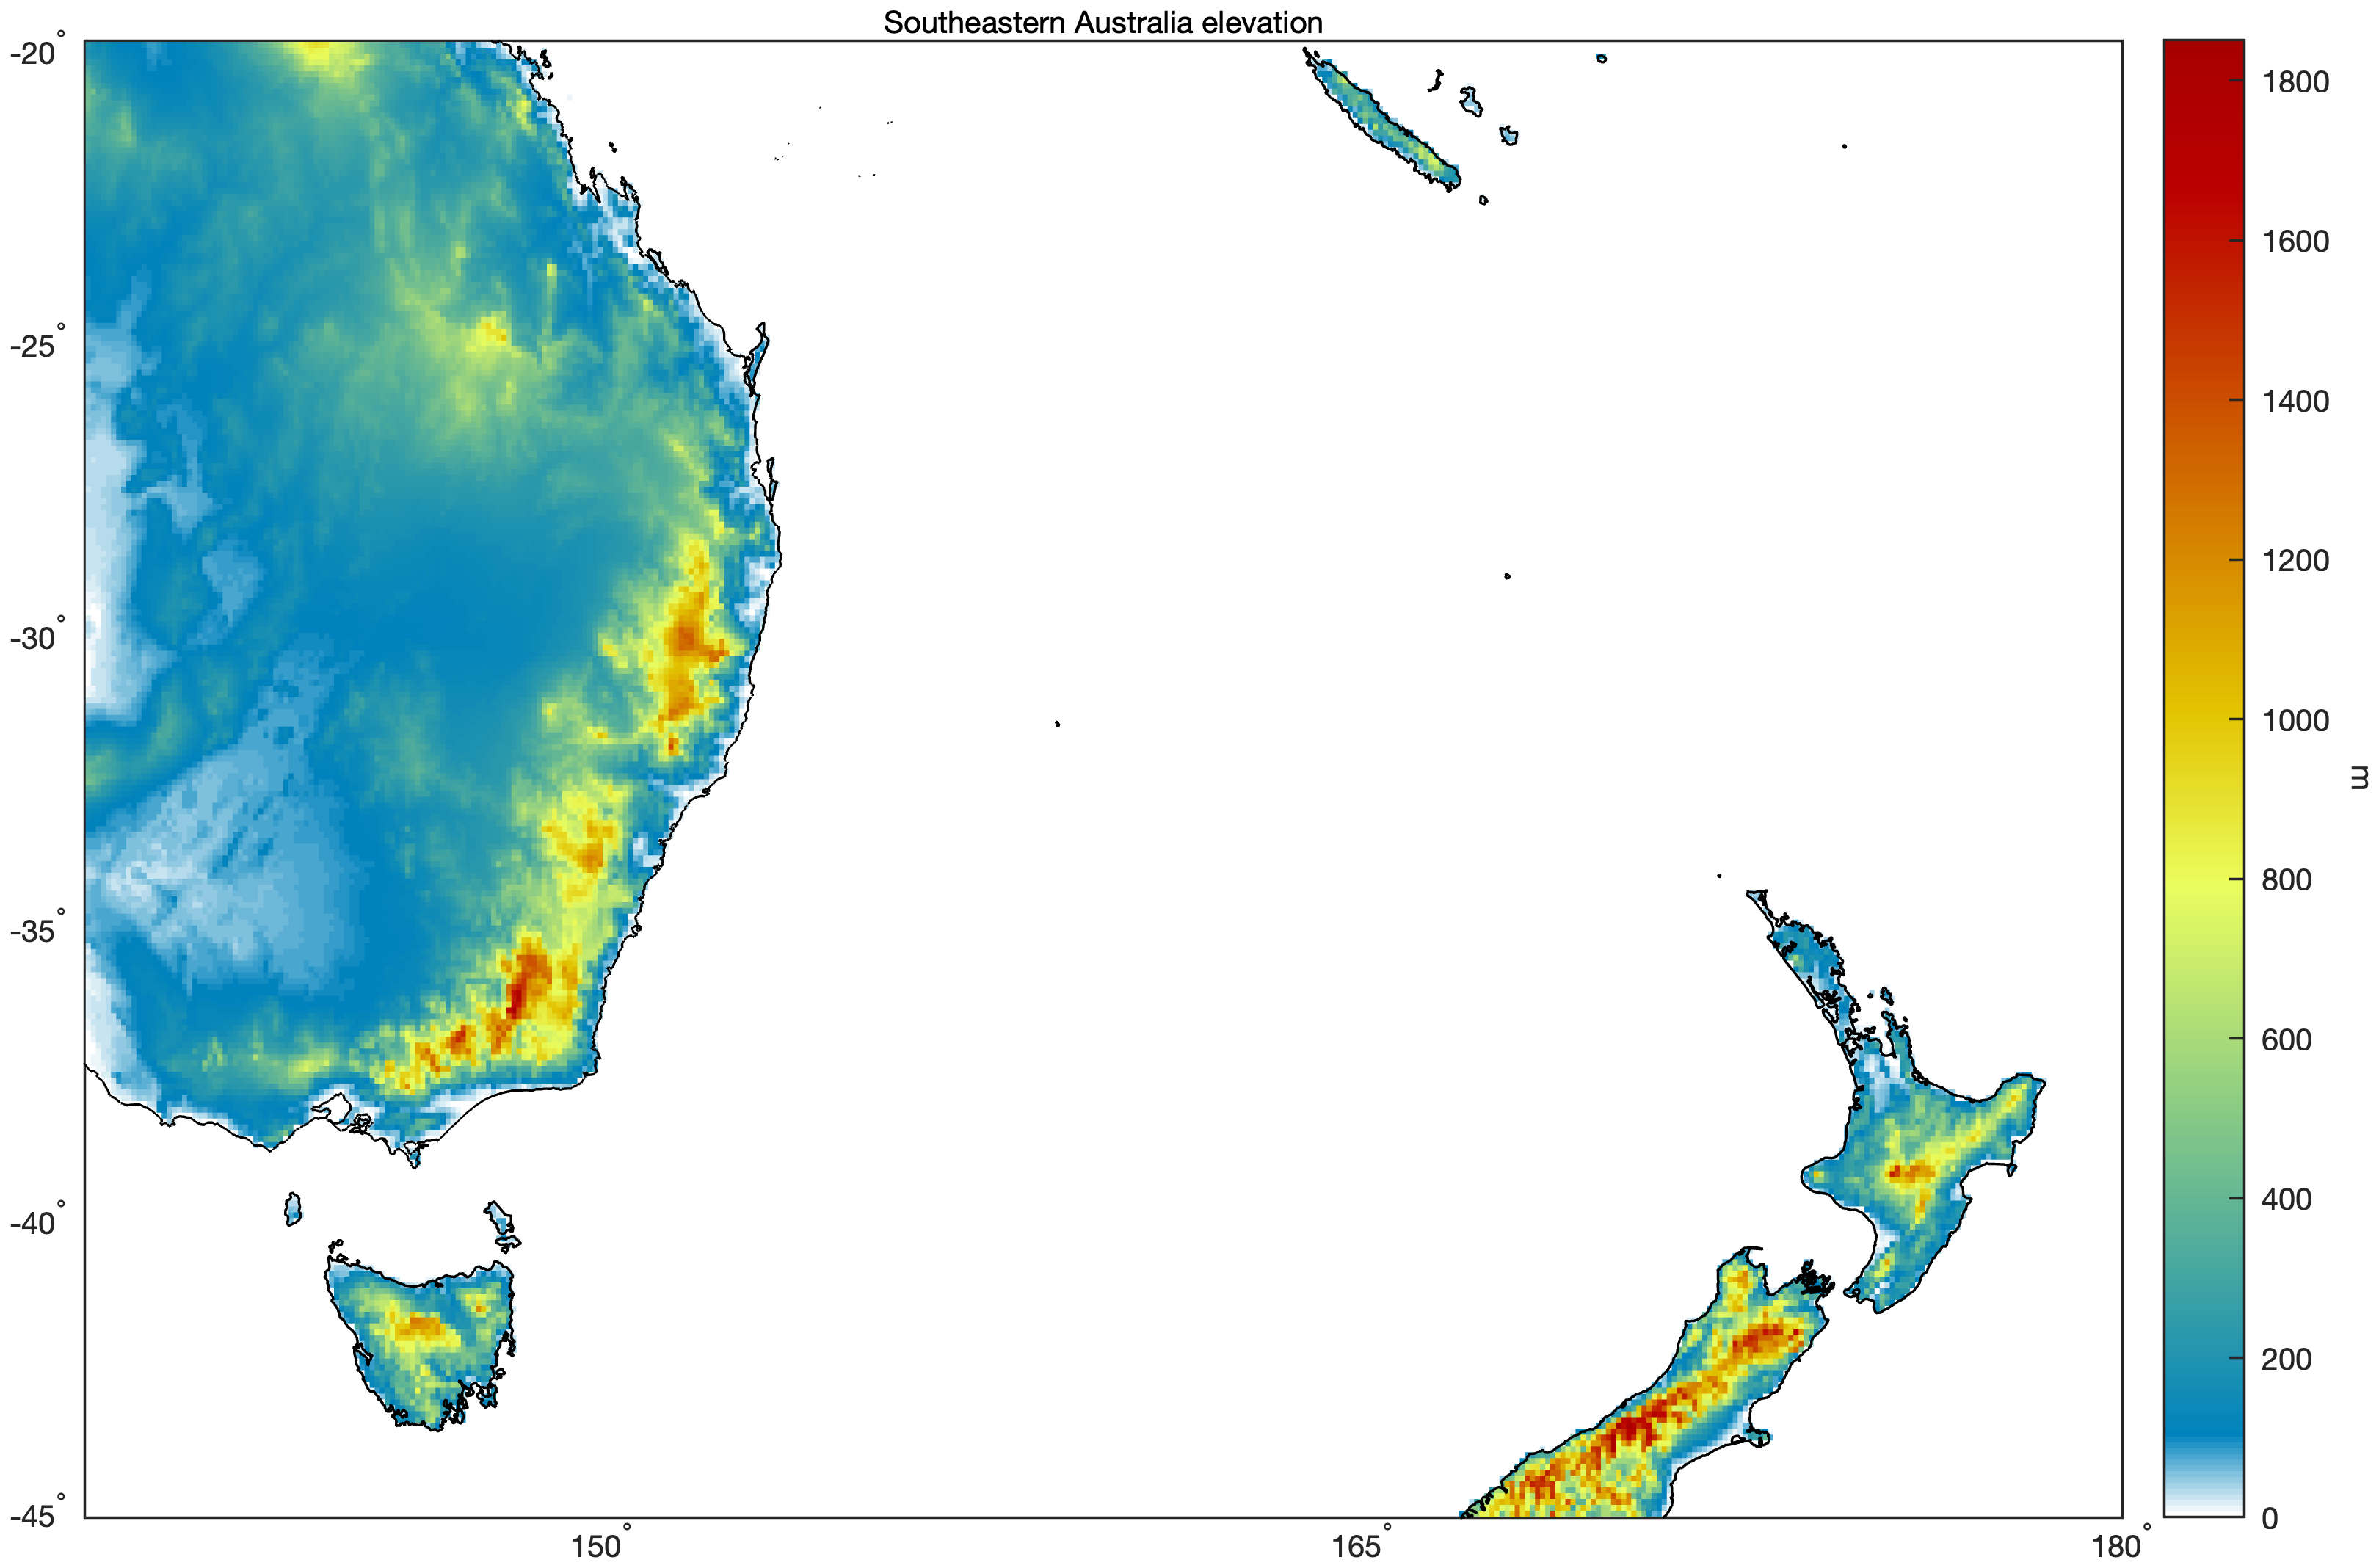
· Southeastern Australia (lightning and precipitation animations, elevation)
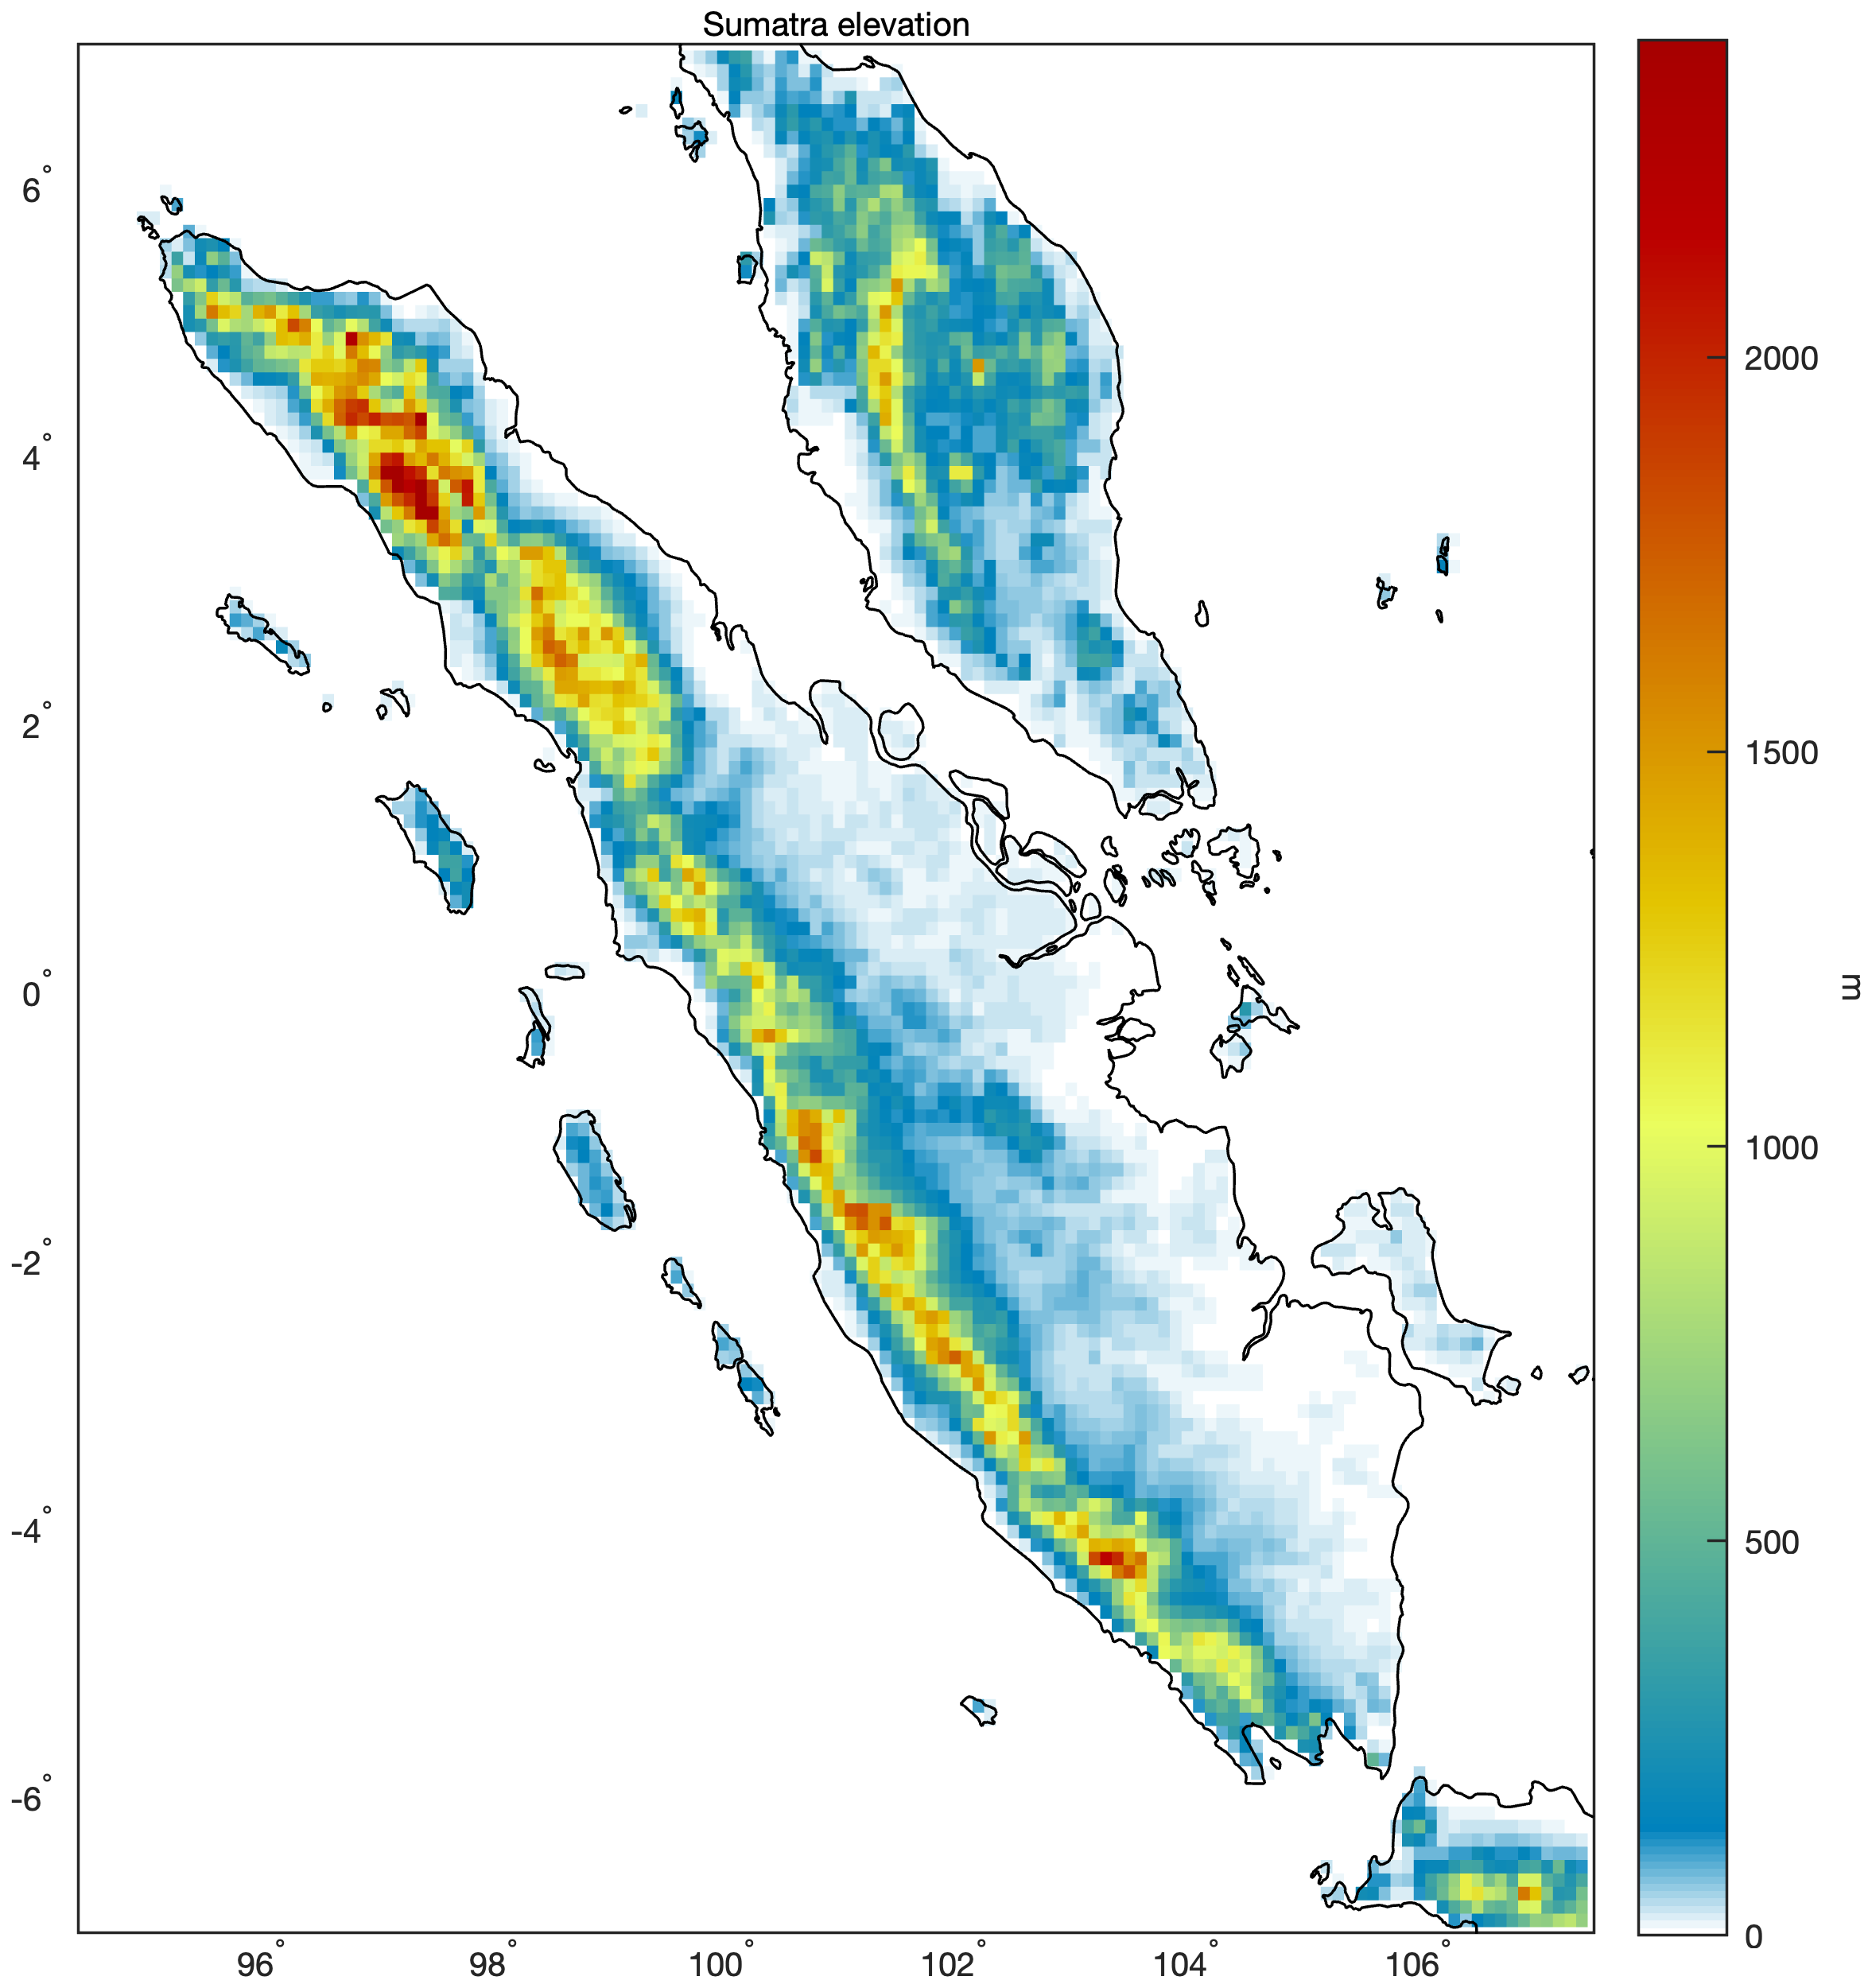
· Sumatra (lightning and precipitation animations, elevation)*
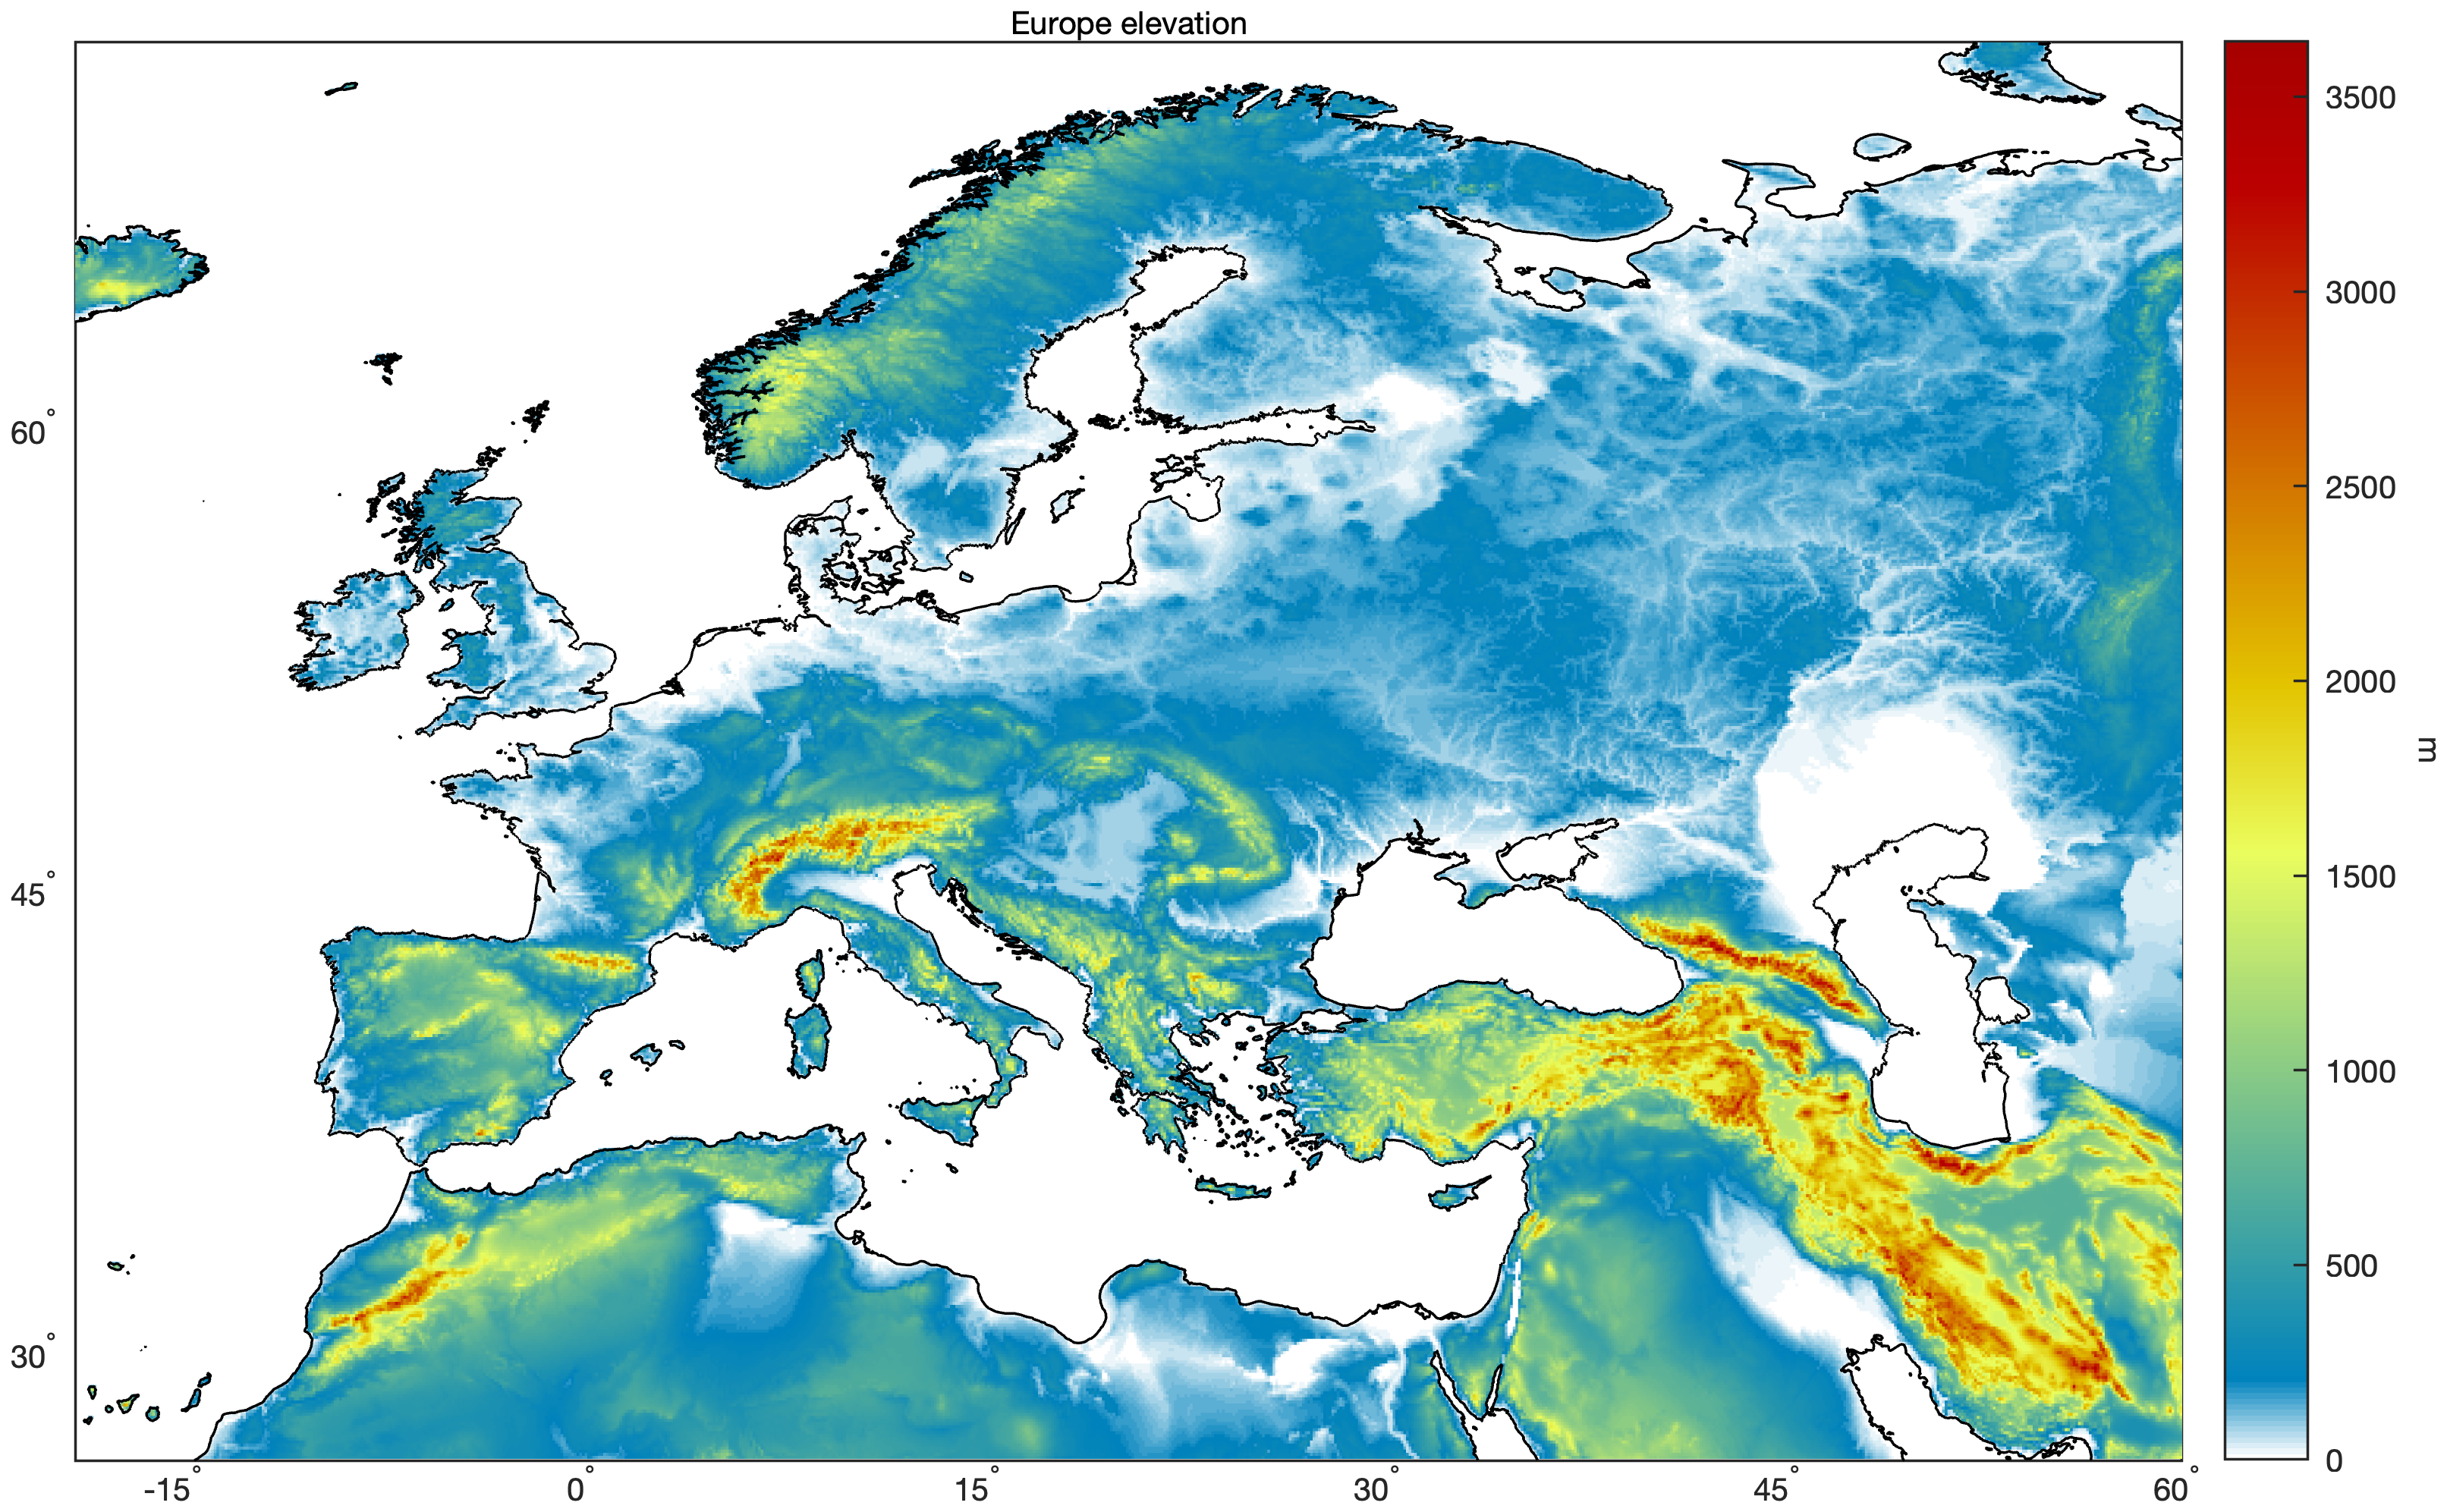
Europe (lightning and precipitation animations, elevation)
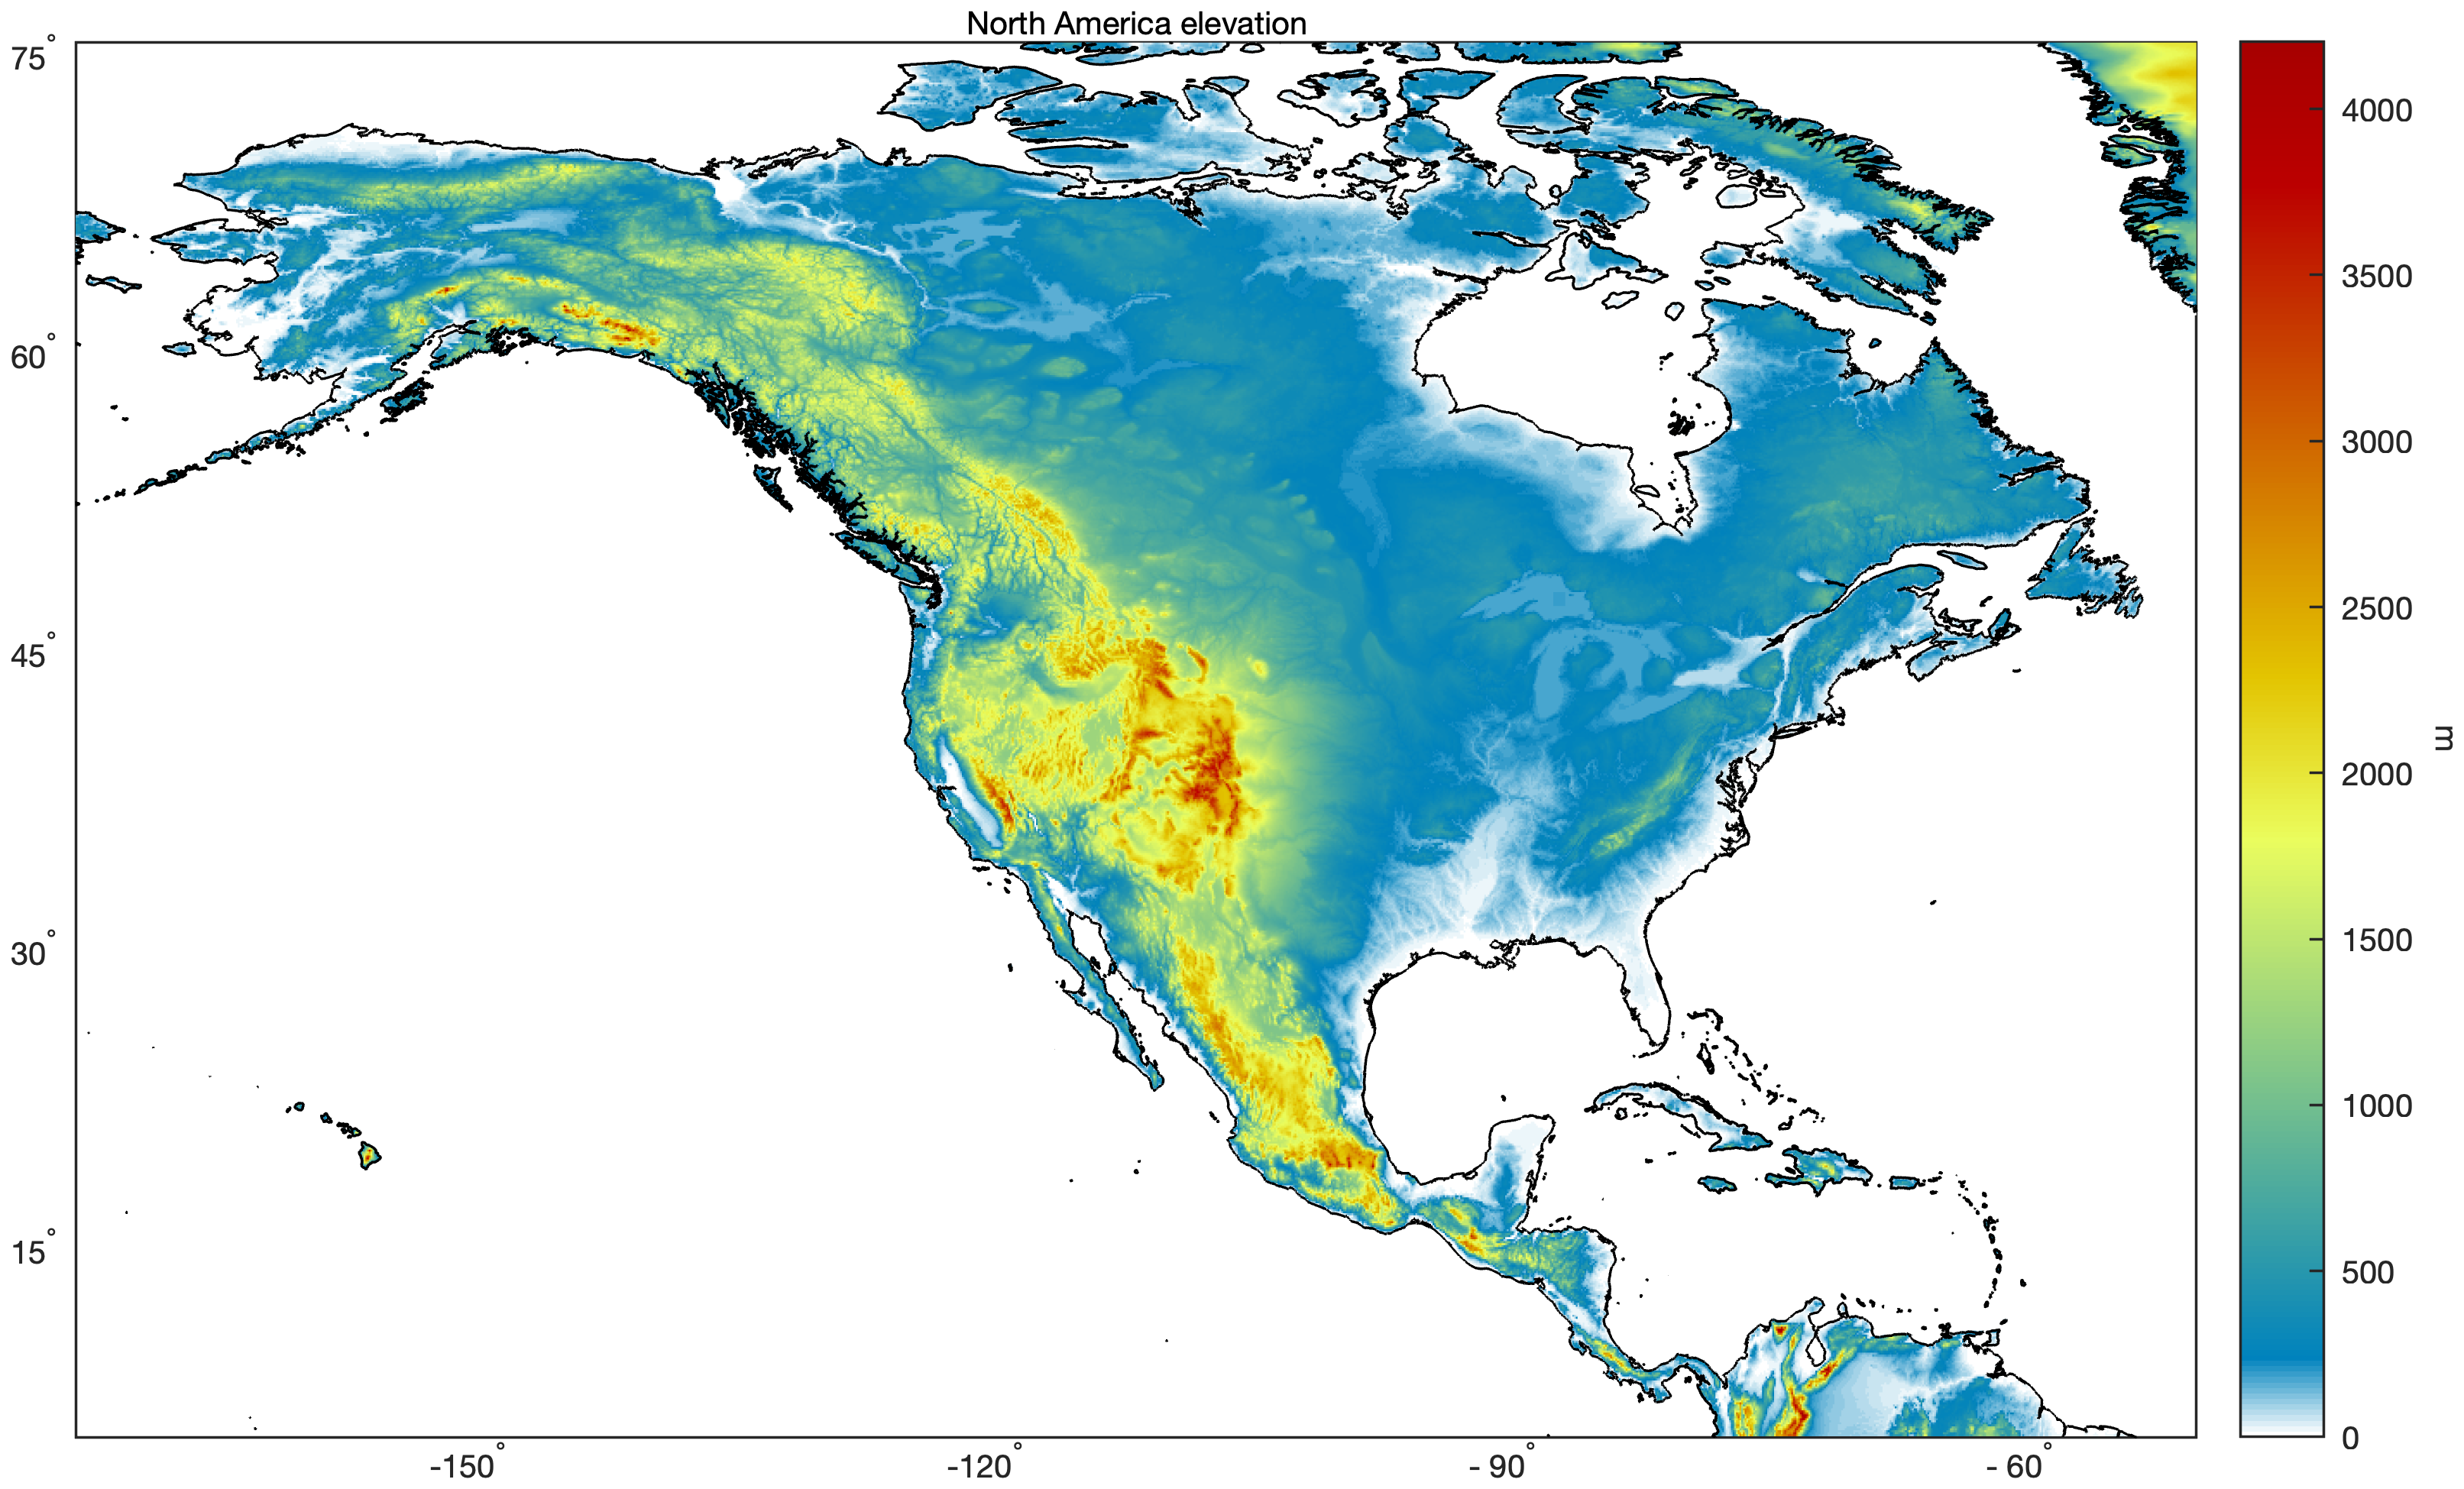
North America (lightning and precipitation animations, elevation)
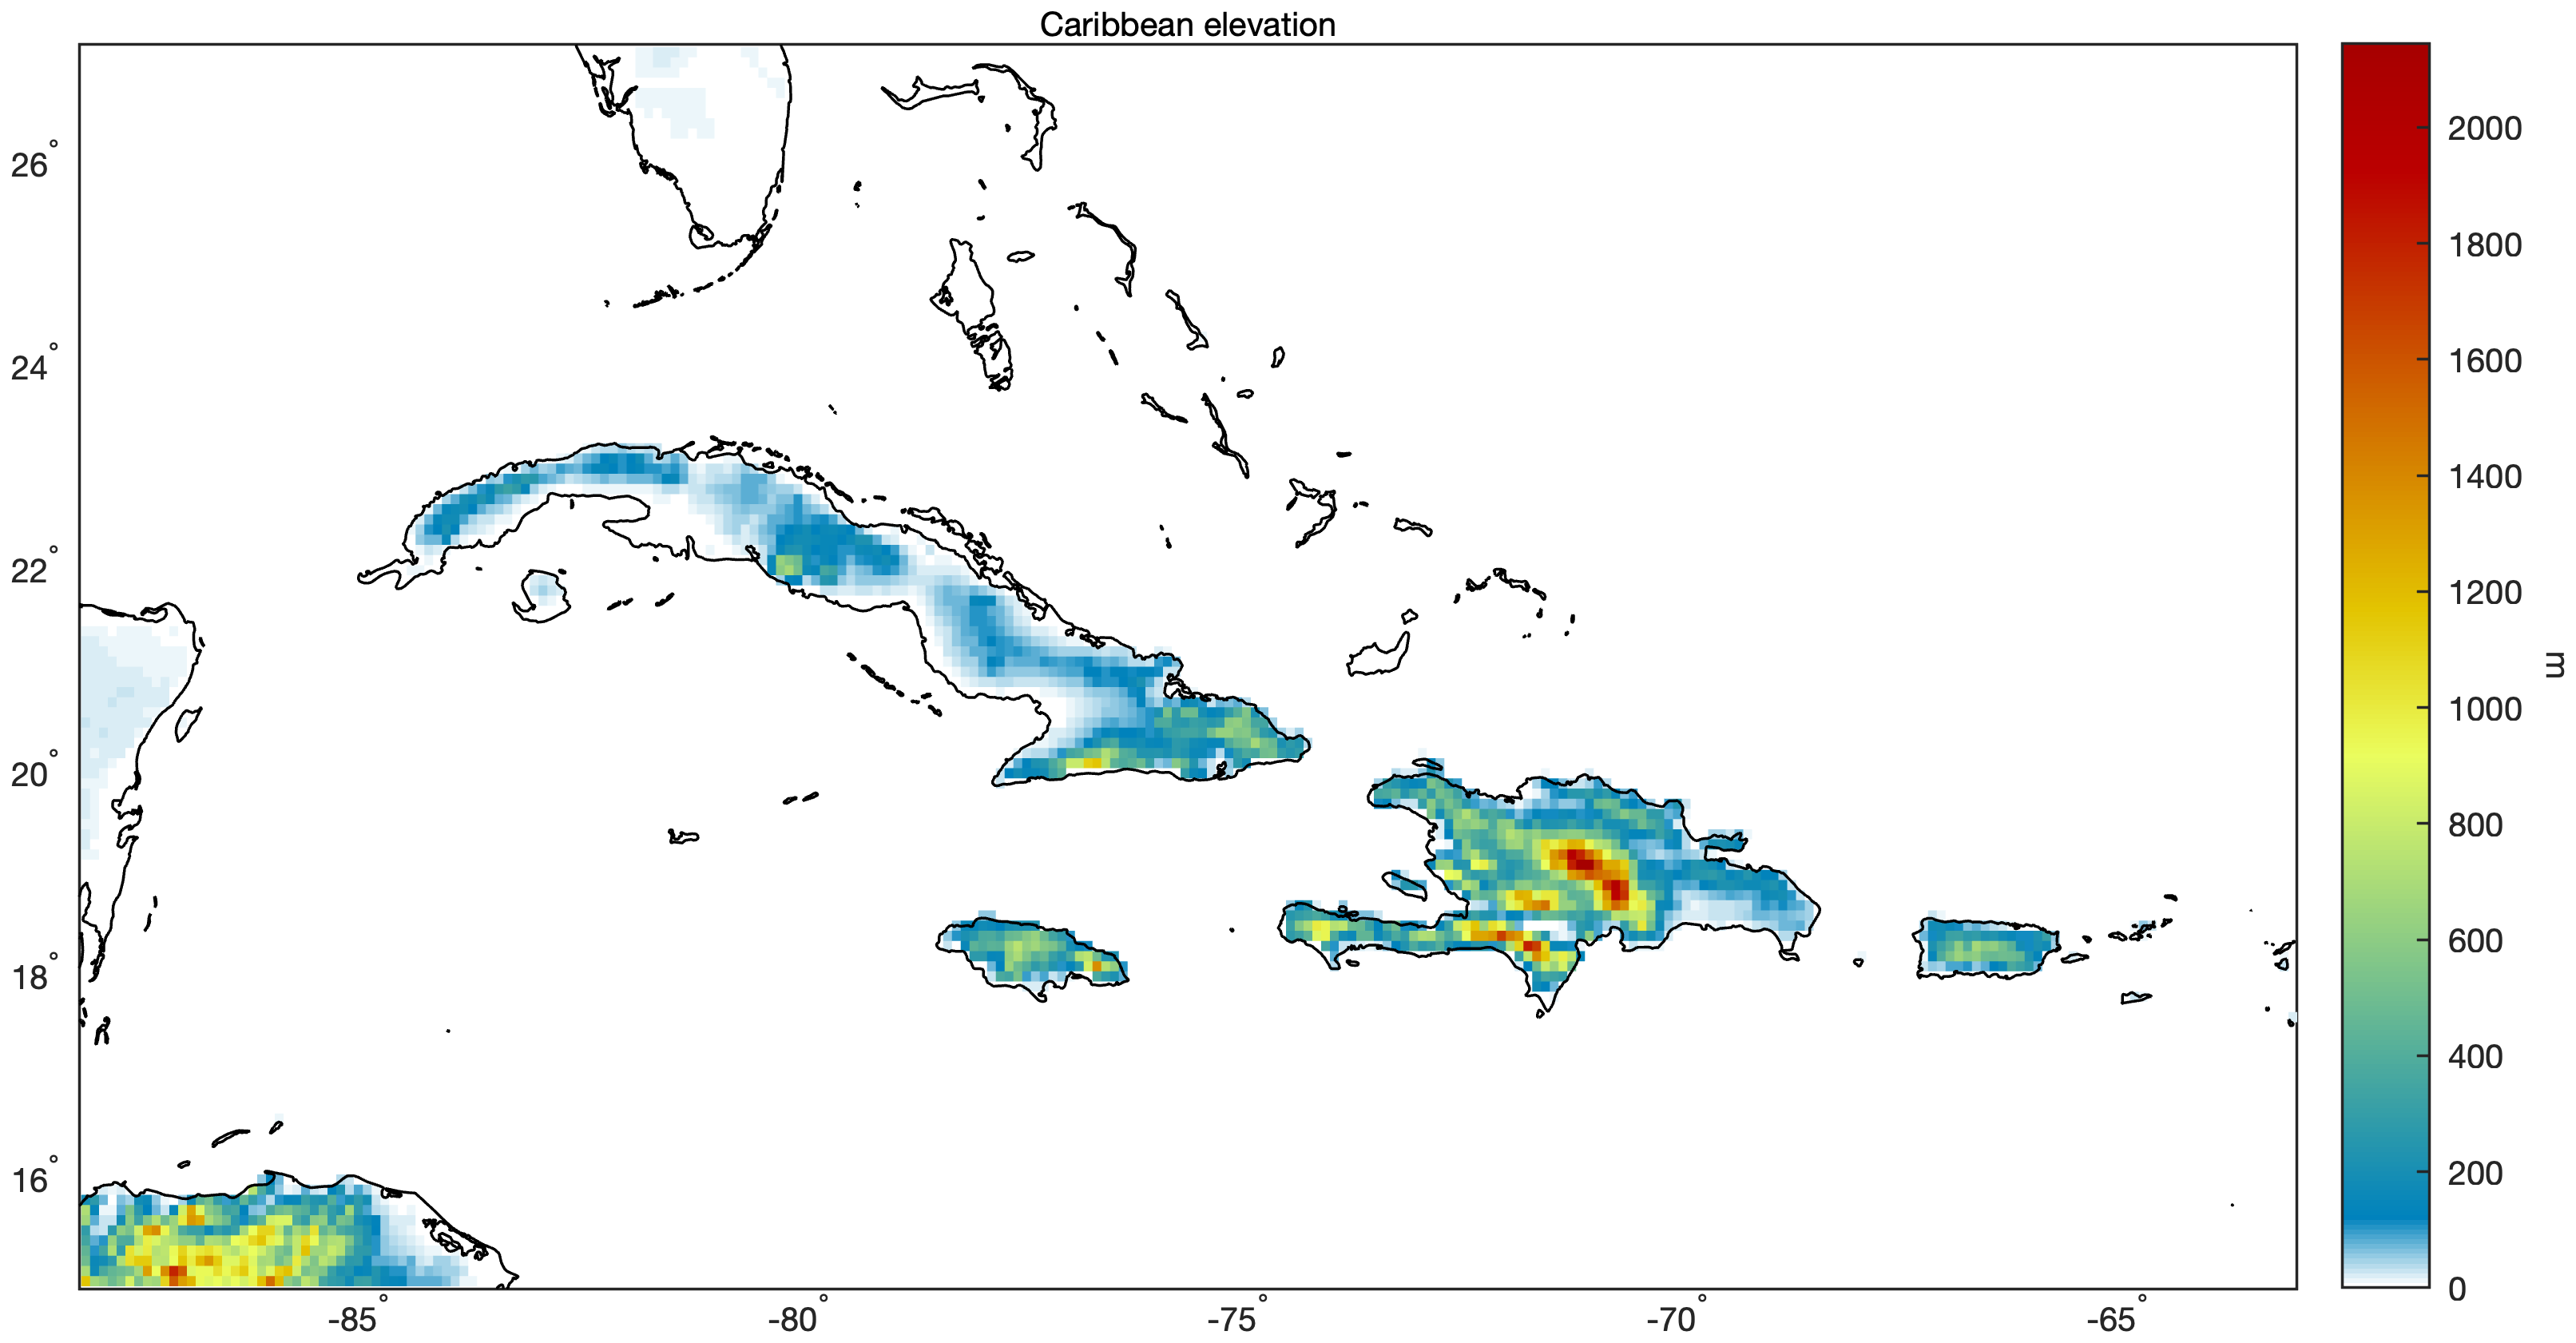
· Caribbean (lightning and precipitation animations, elevation)
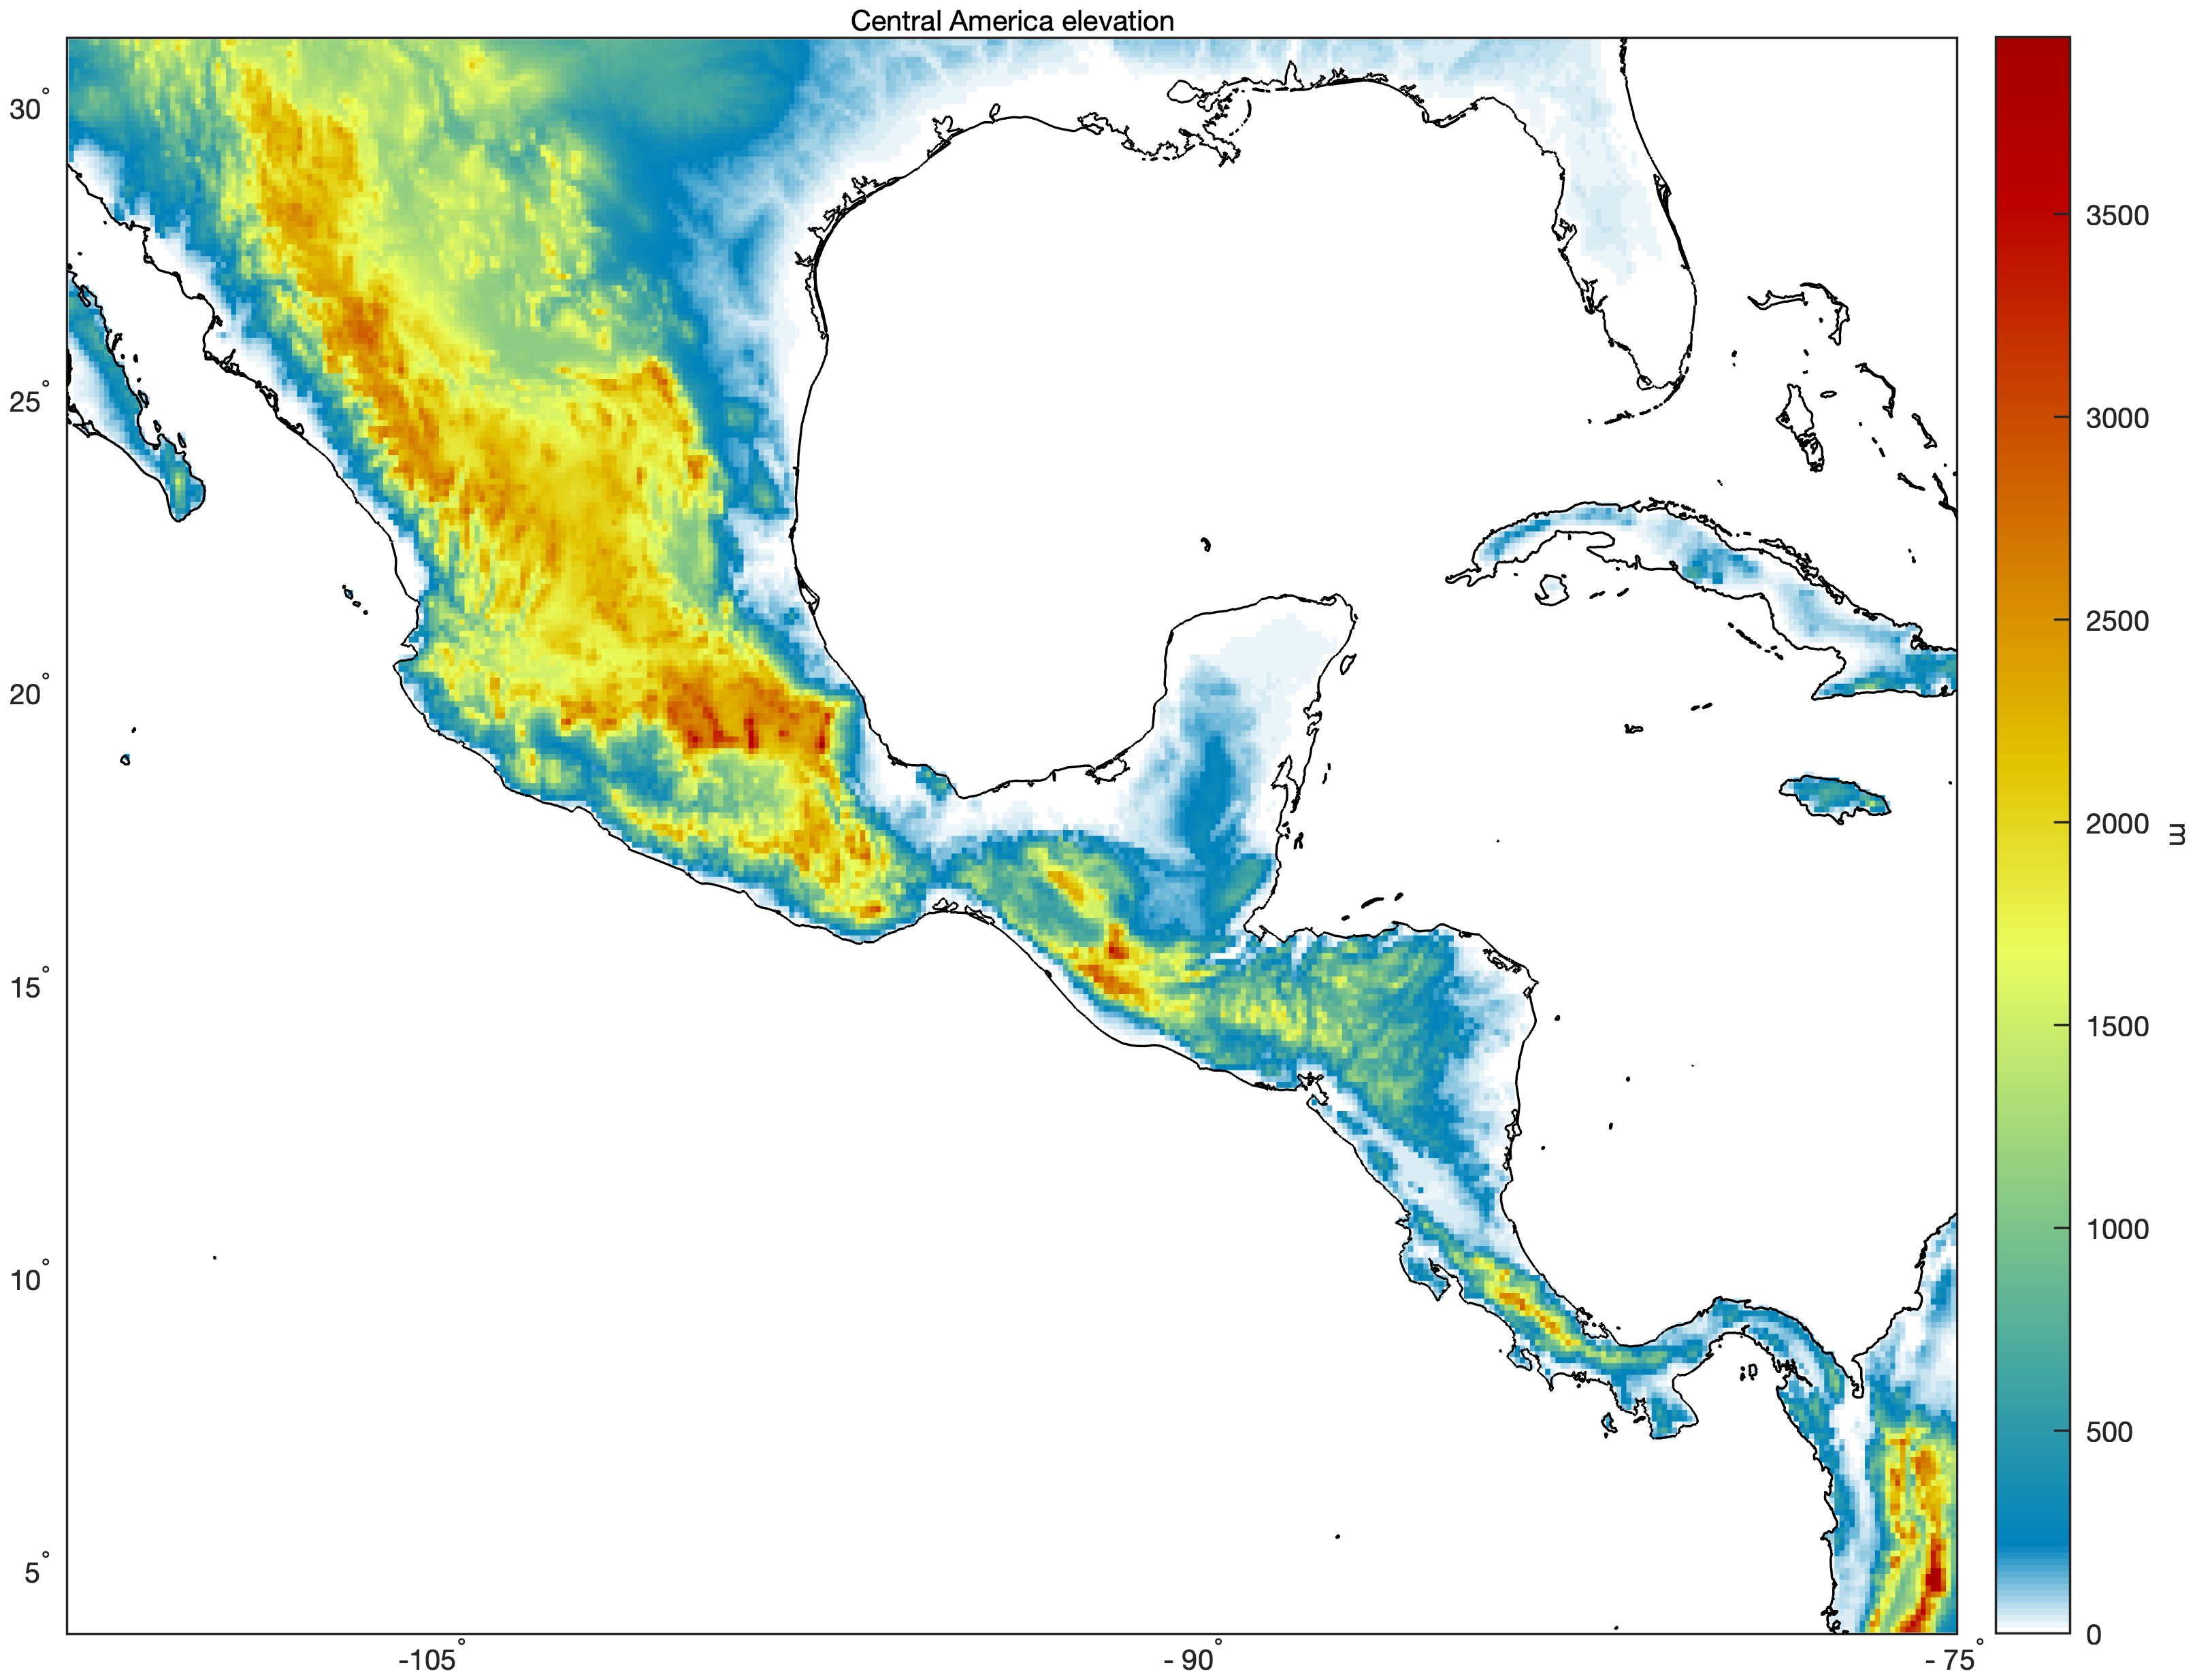
· Central America (lightning and precipitation animations, elevation)*
· Central USA (lightning and precipitation animations, elevation)
· Florida (lightning and precipitation animations, elevation)
· Hispaniola (lightning and precipitation animations, elevation)
· Panama (lightning and precipitation animations, elevation)
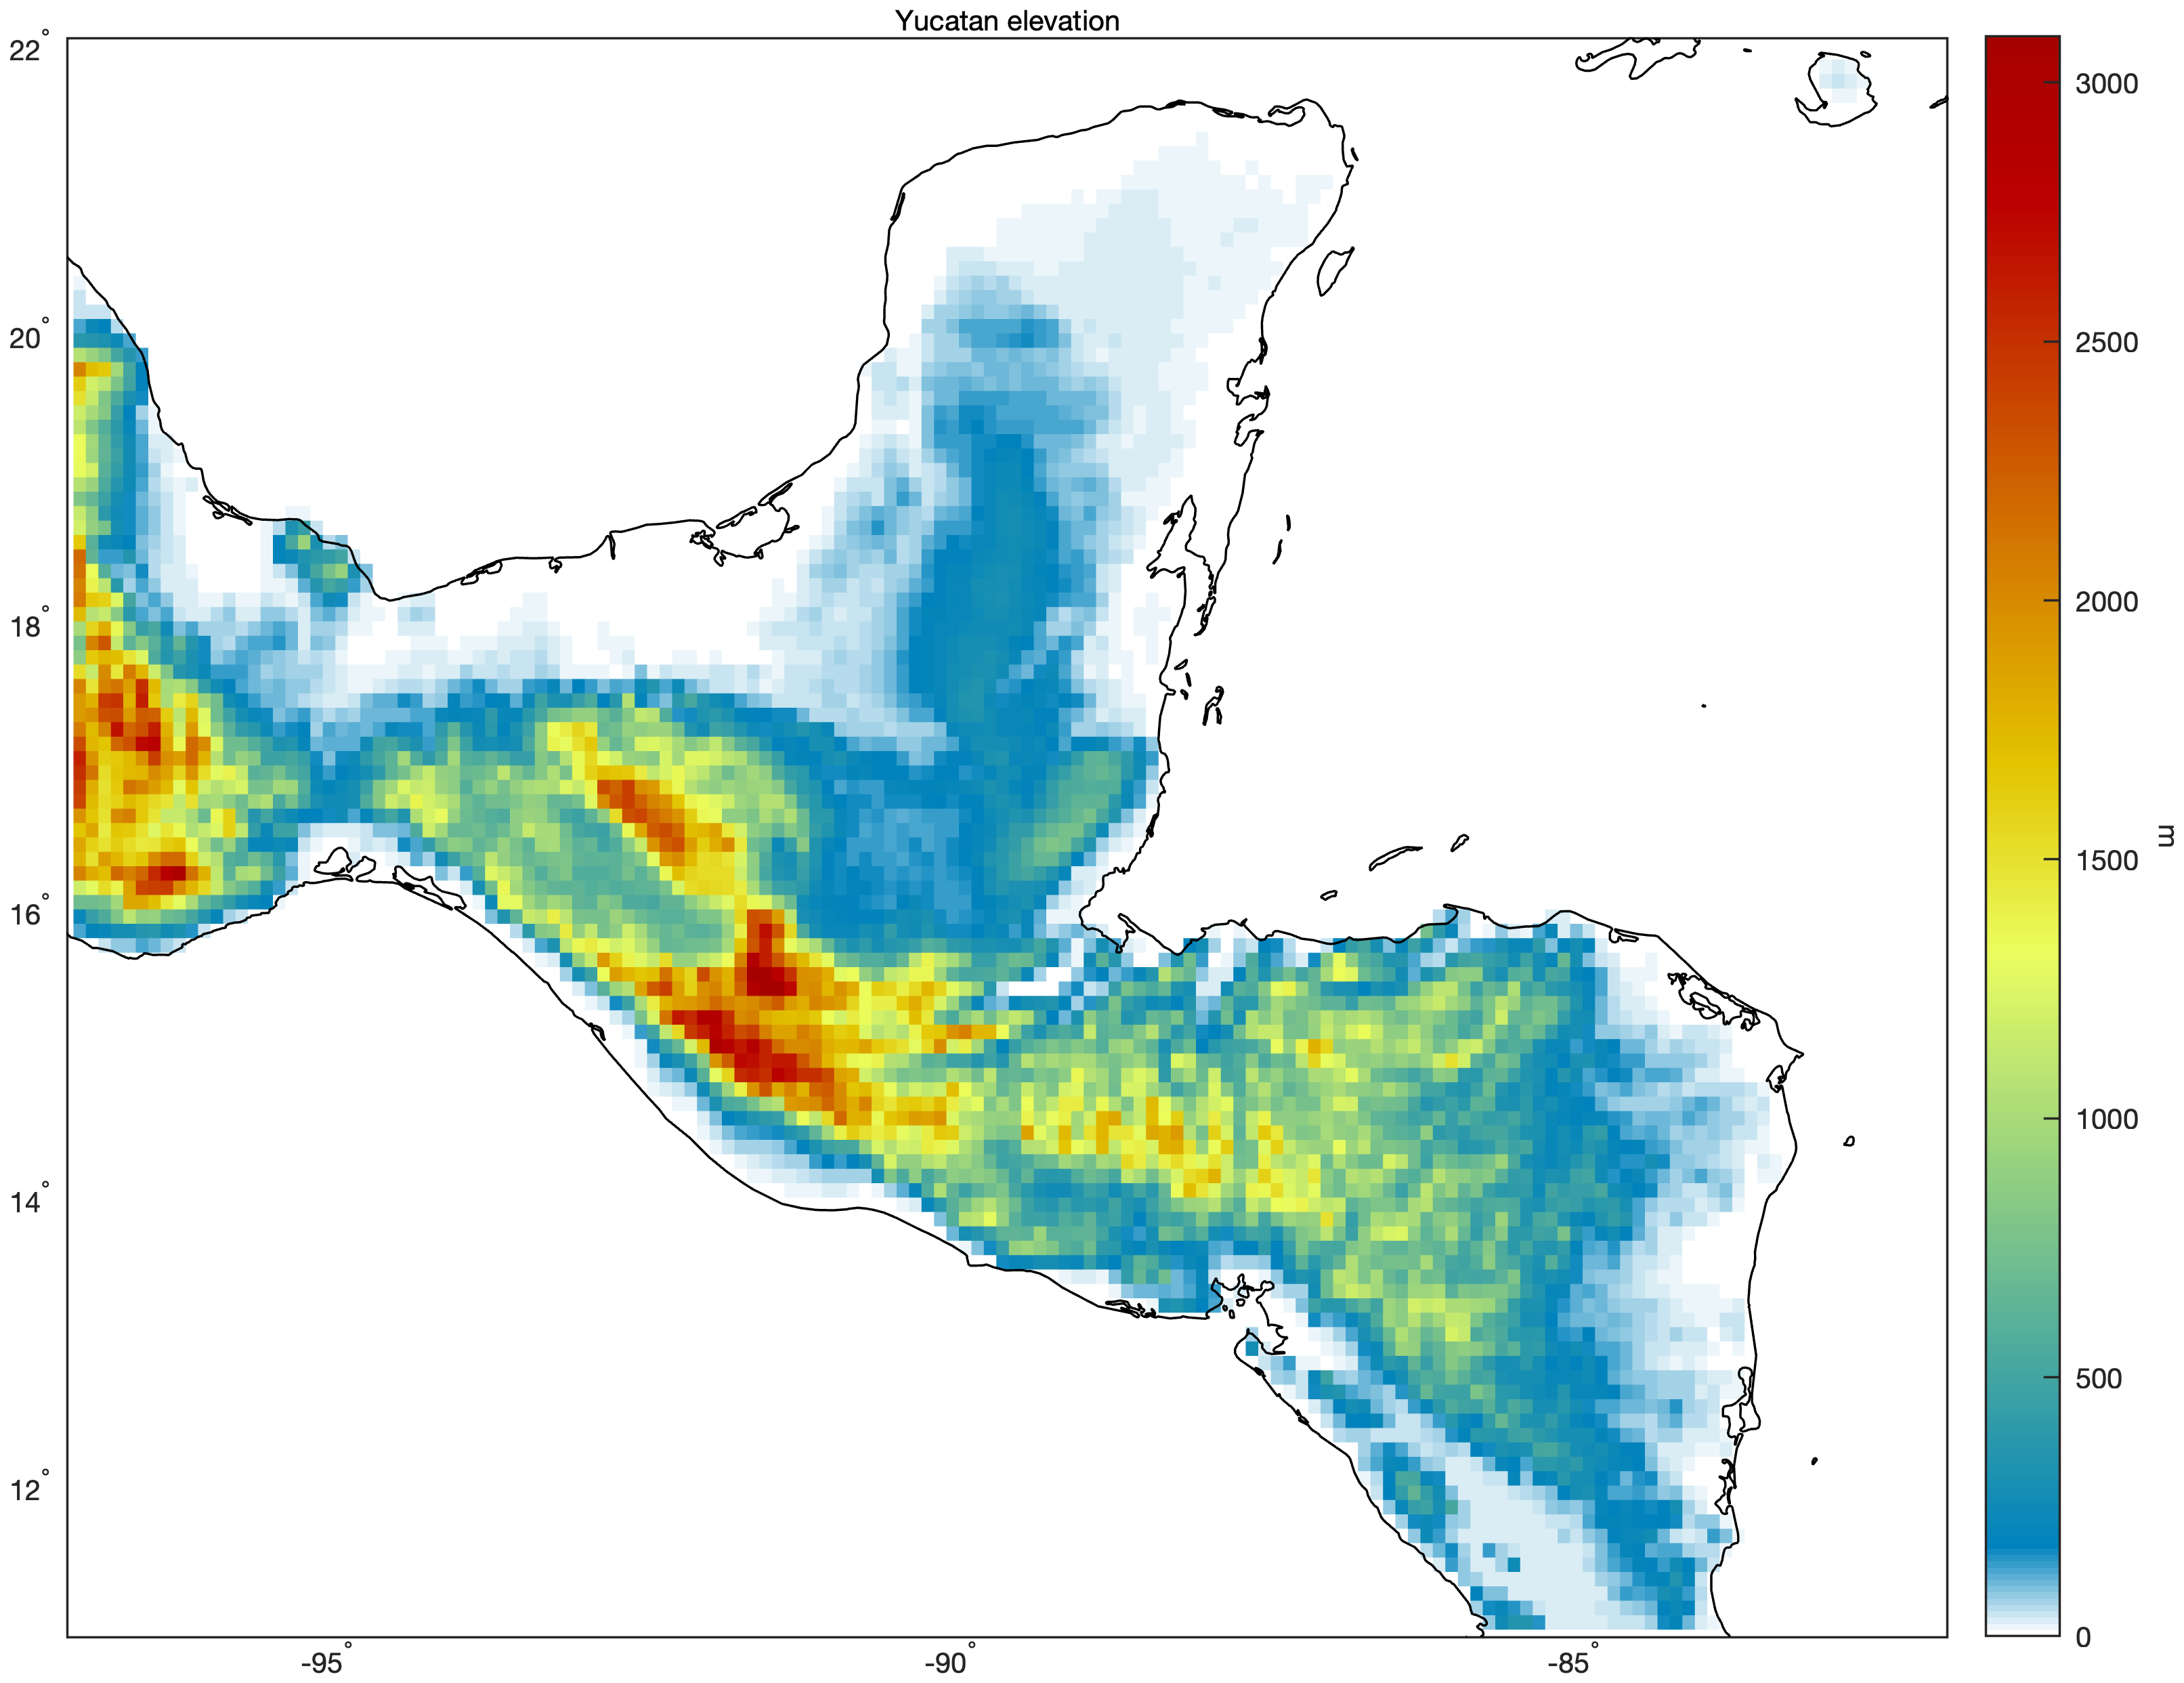
· Yucatan (lightning and precipitation animations, elevation)
Oceans
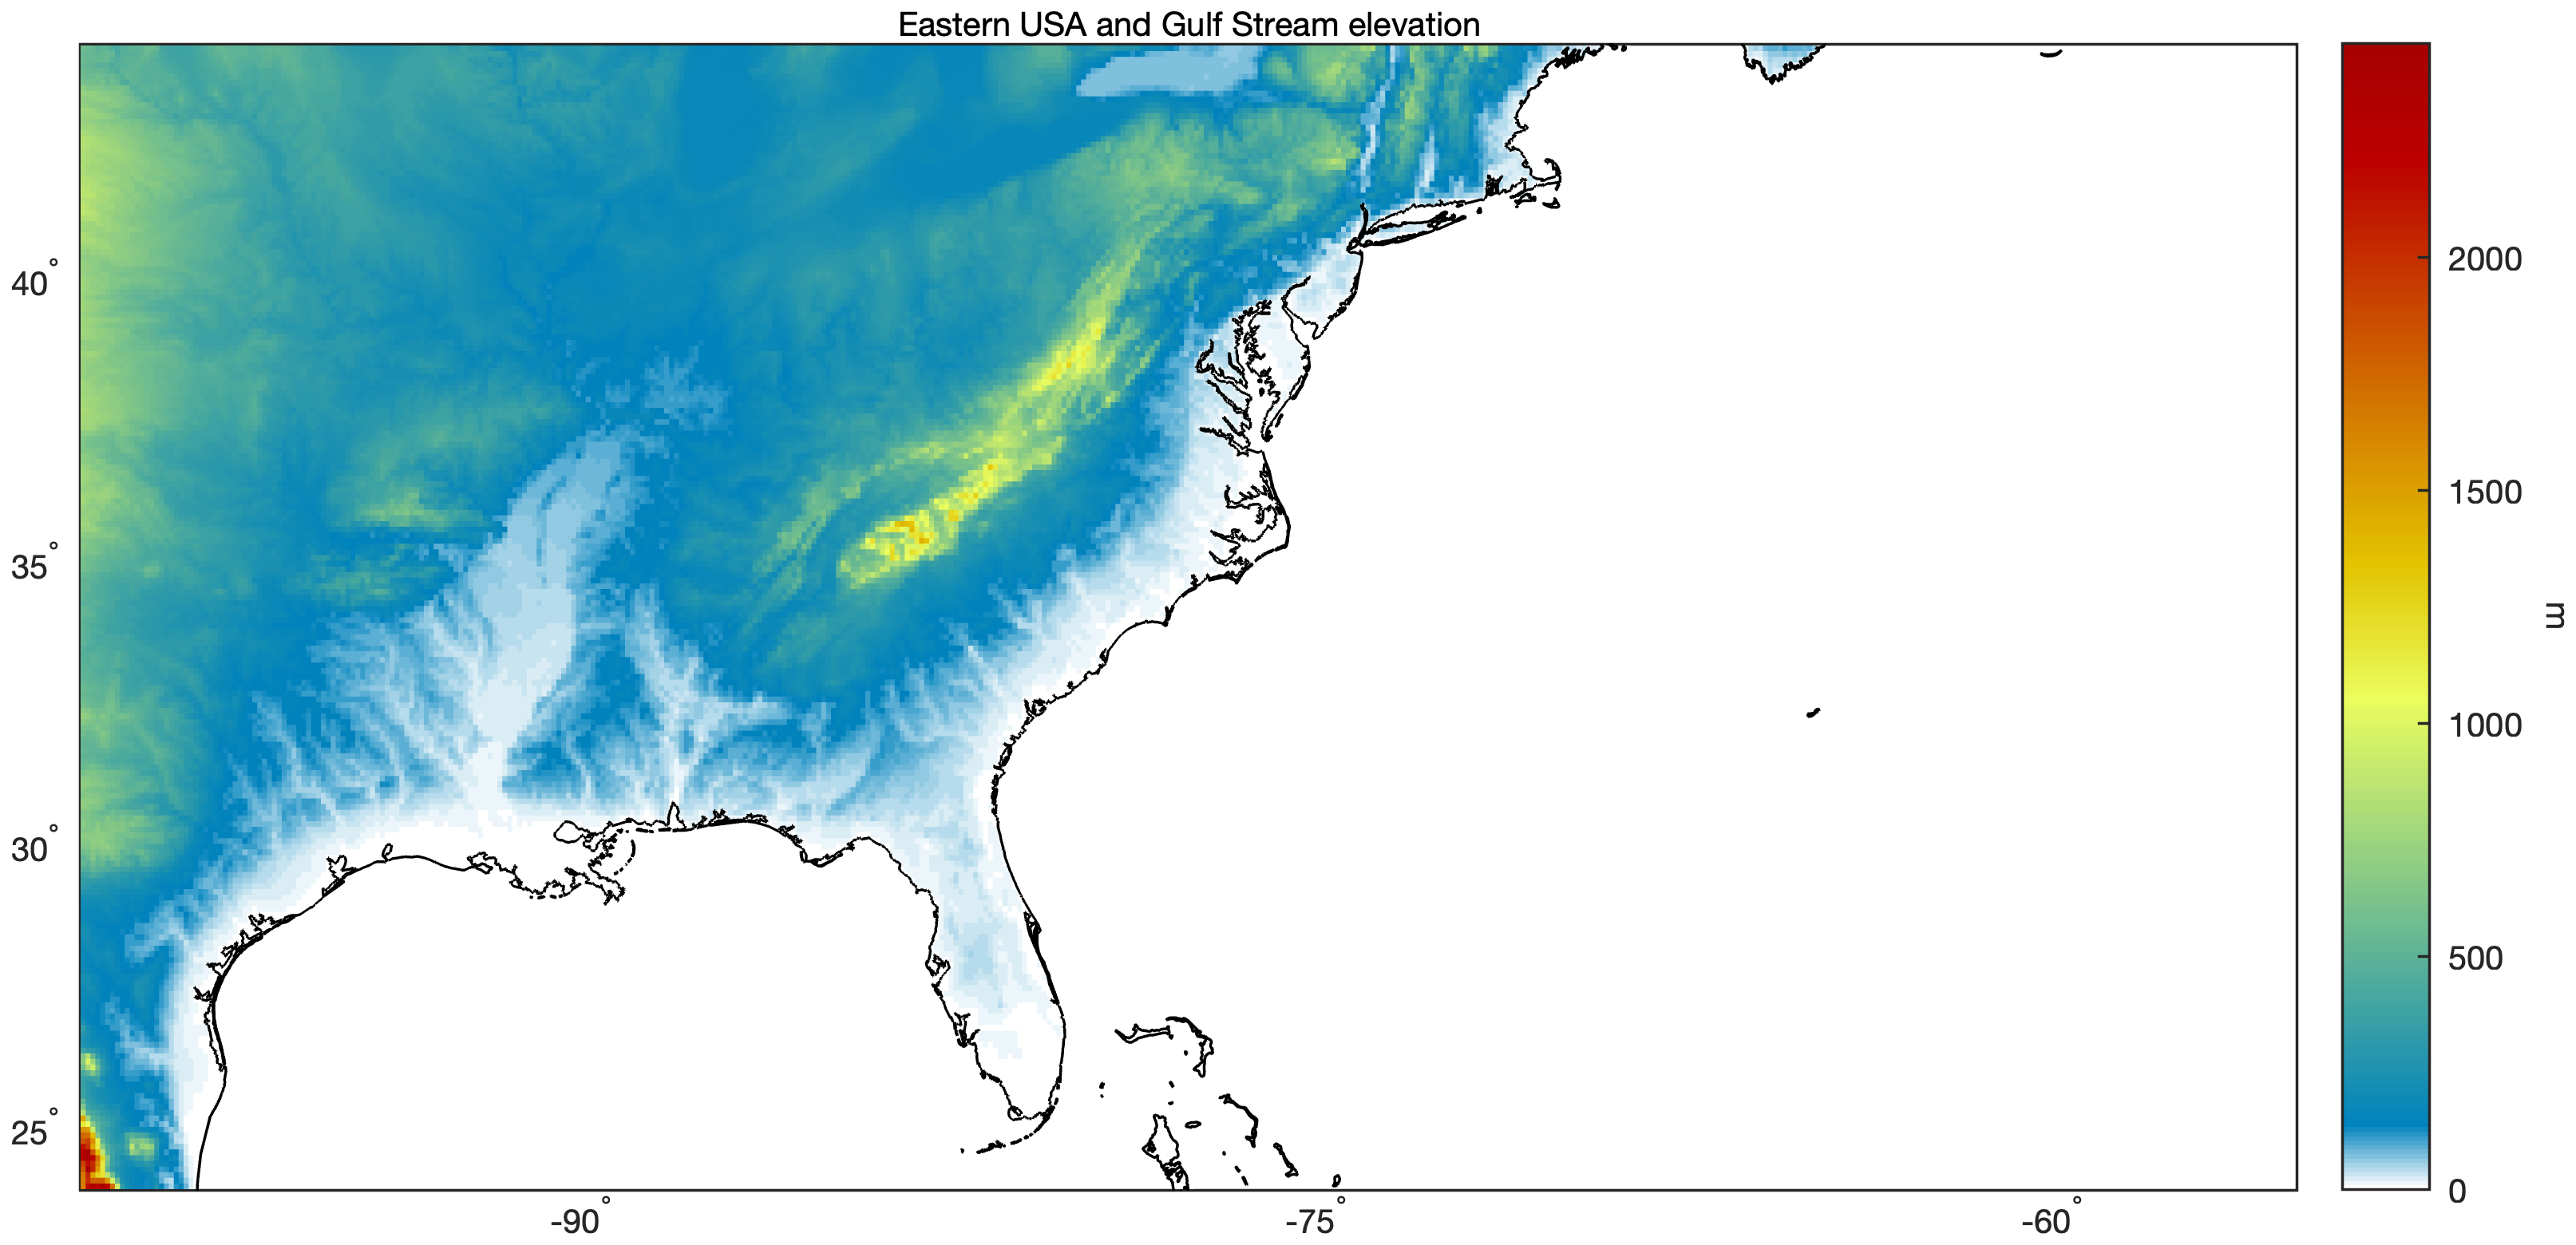
· Gulf Stream (lightning and precipitation animations, elevation)
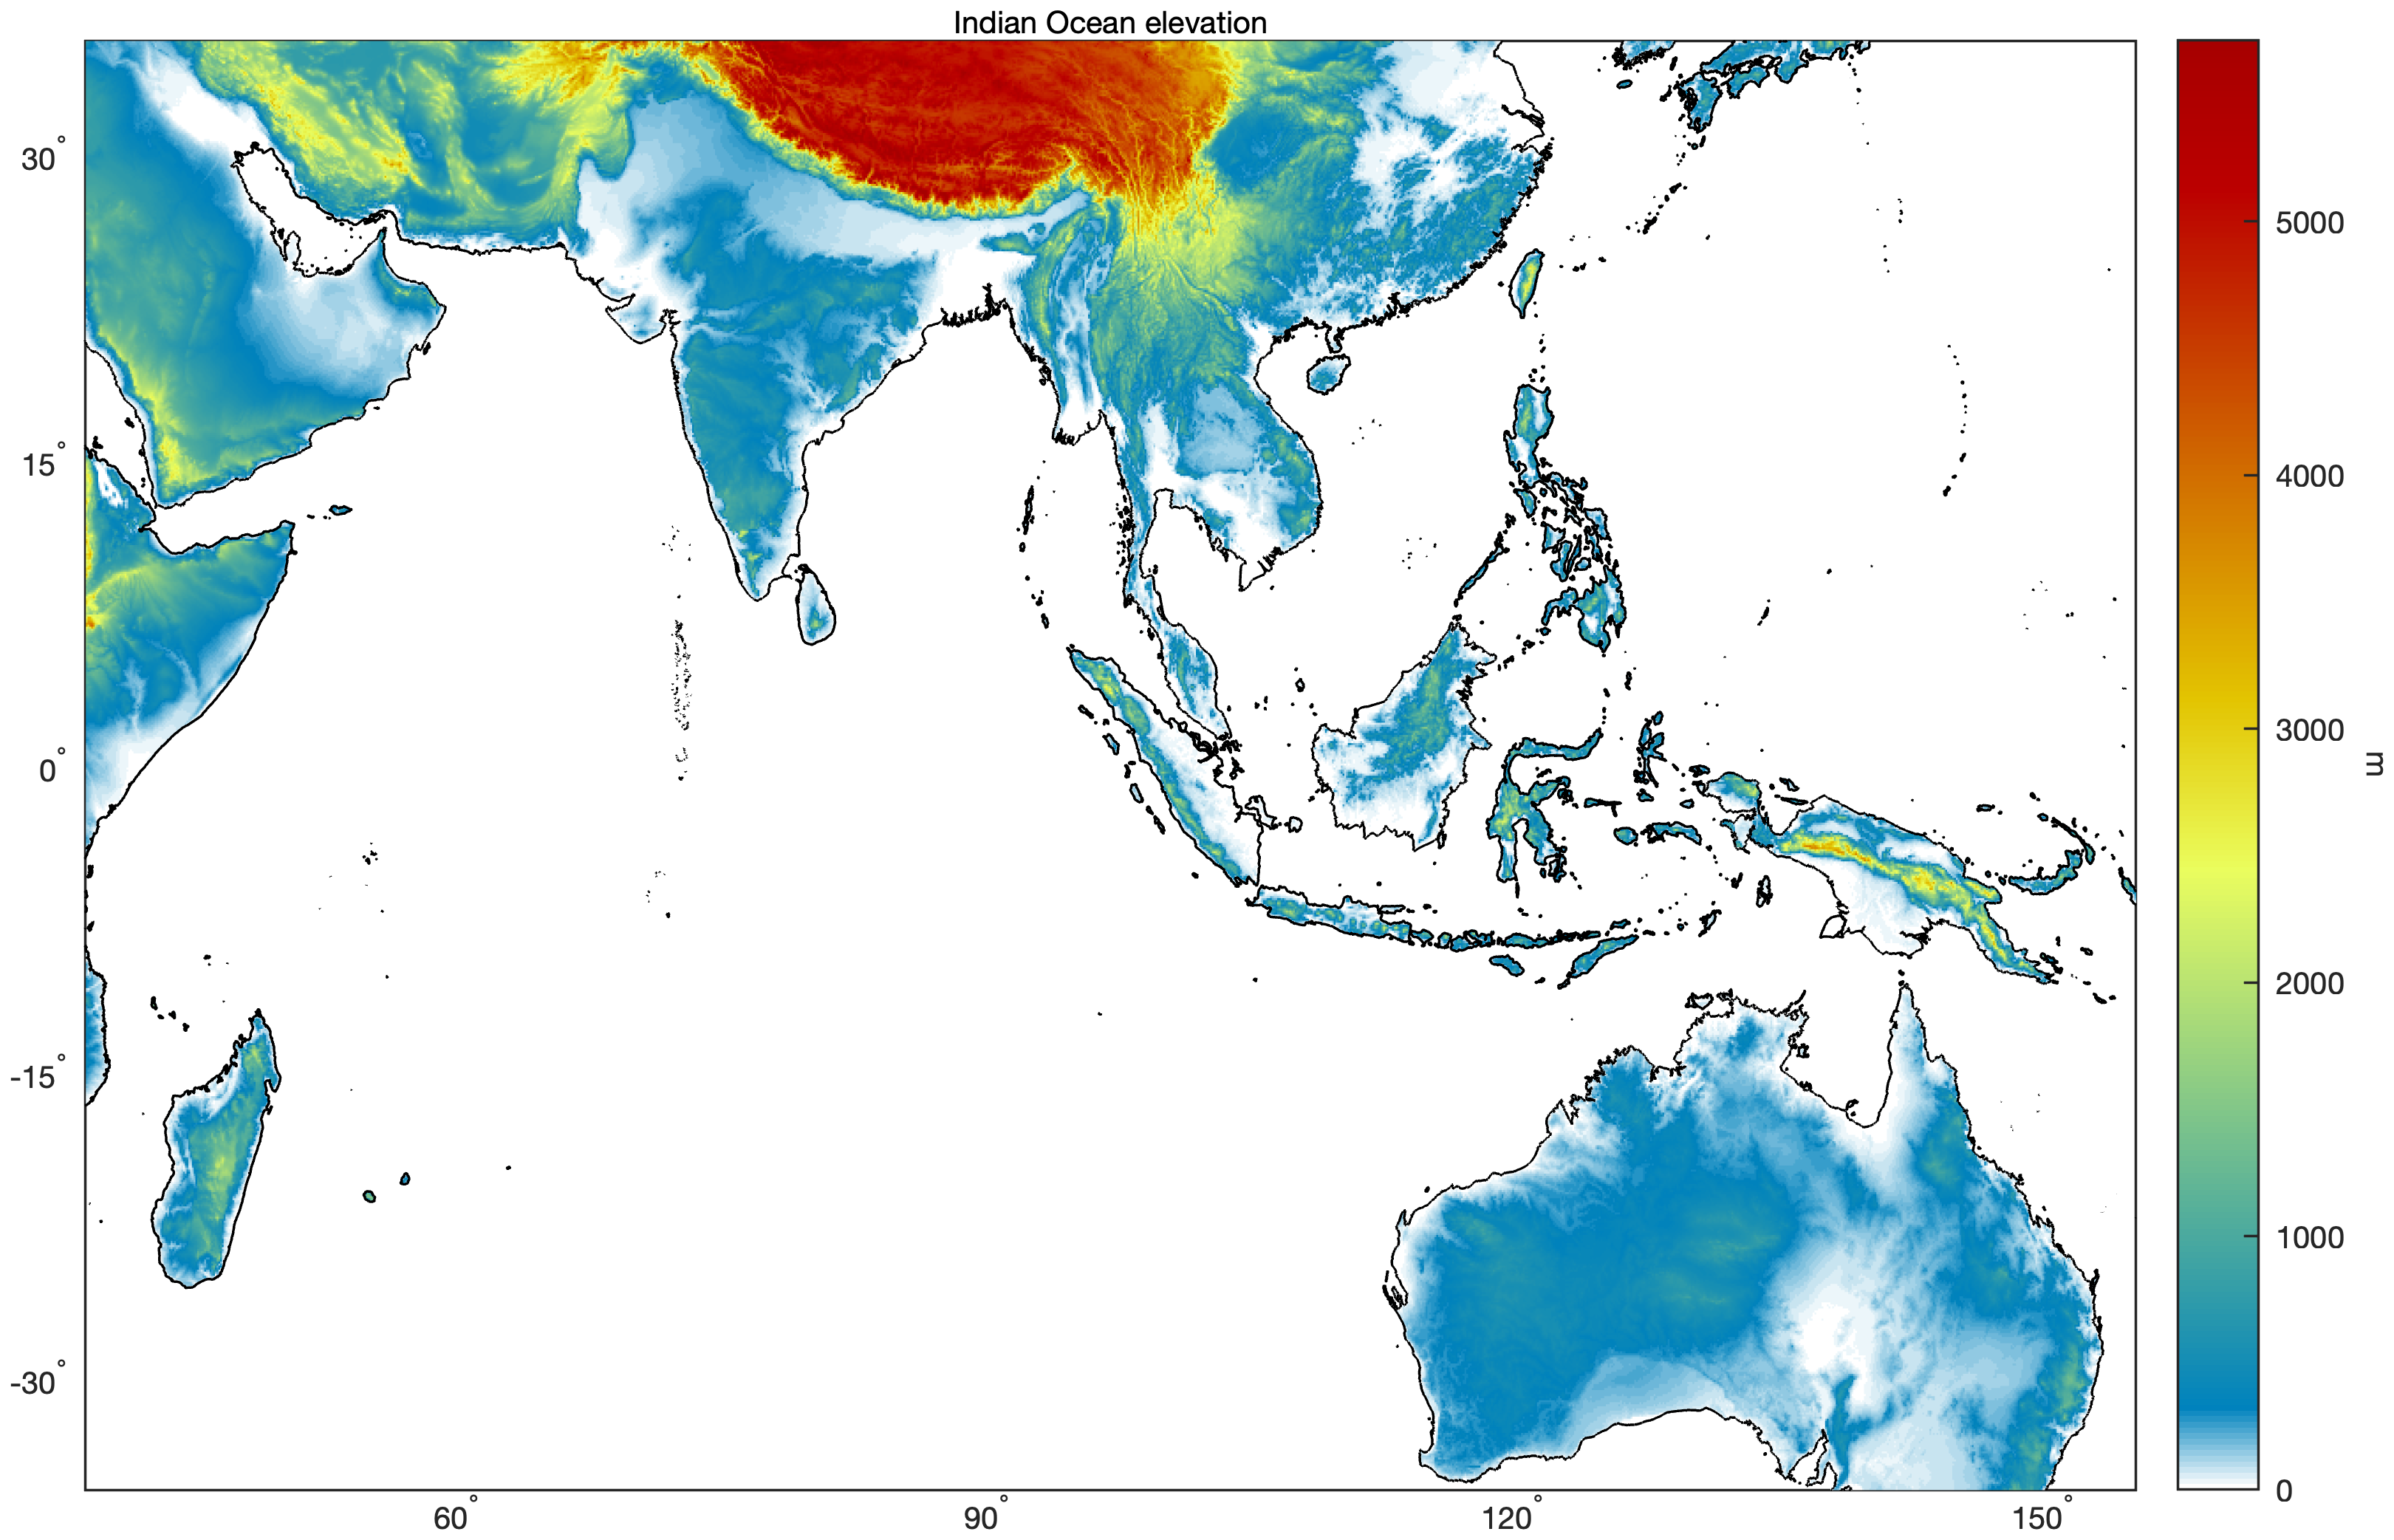
· Indian Ocean (lightning and precipitation animations, elevation)
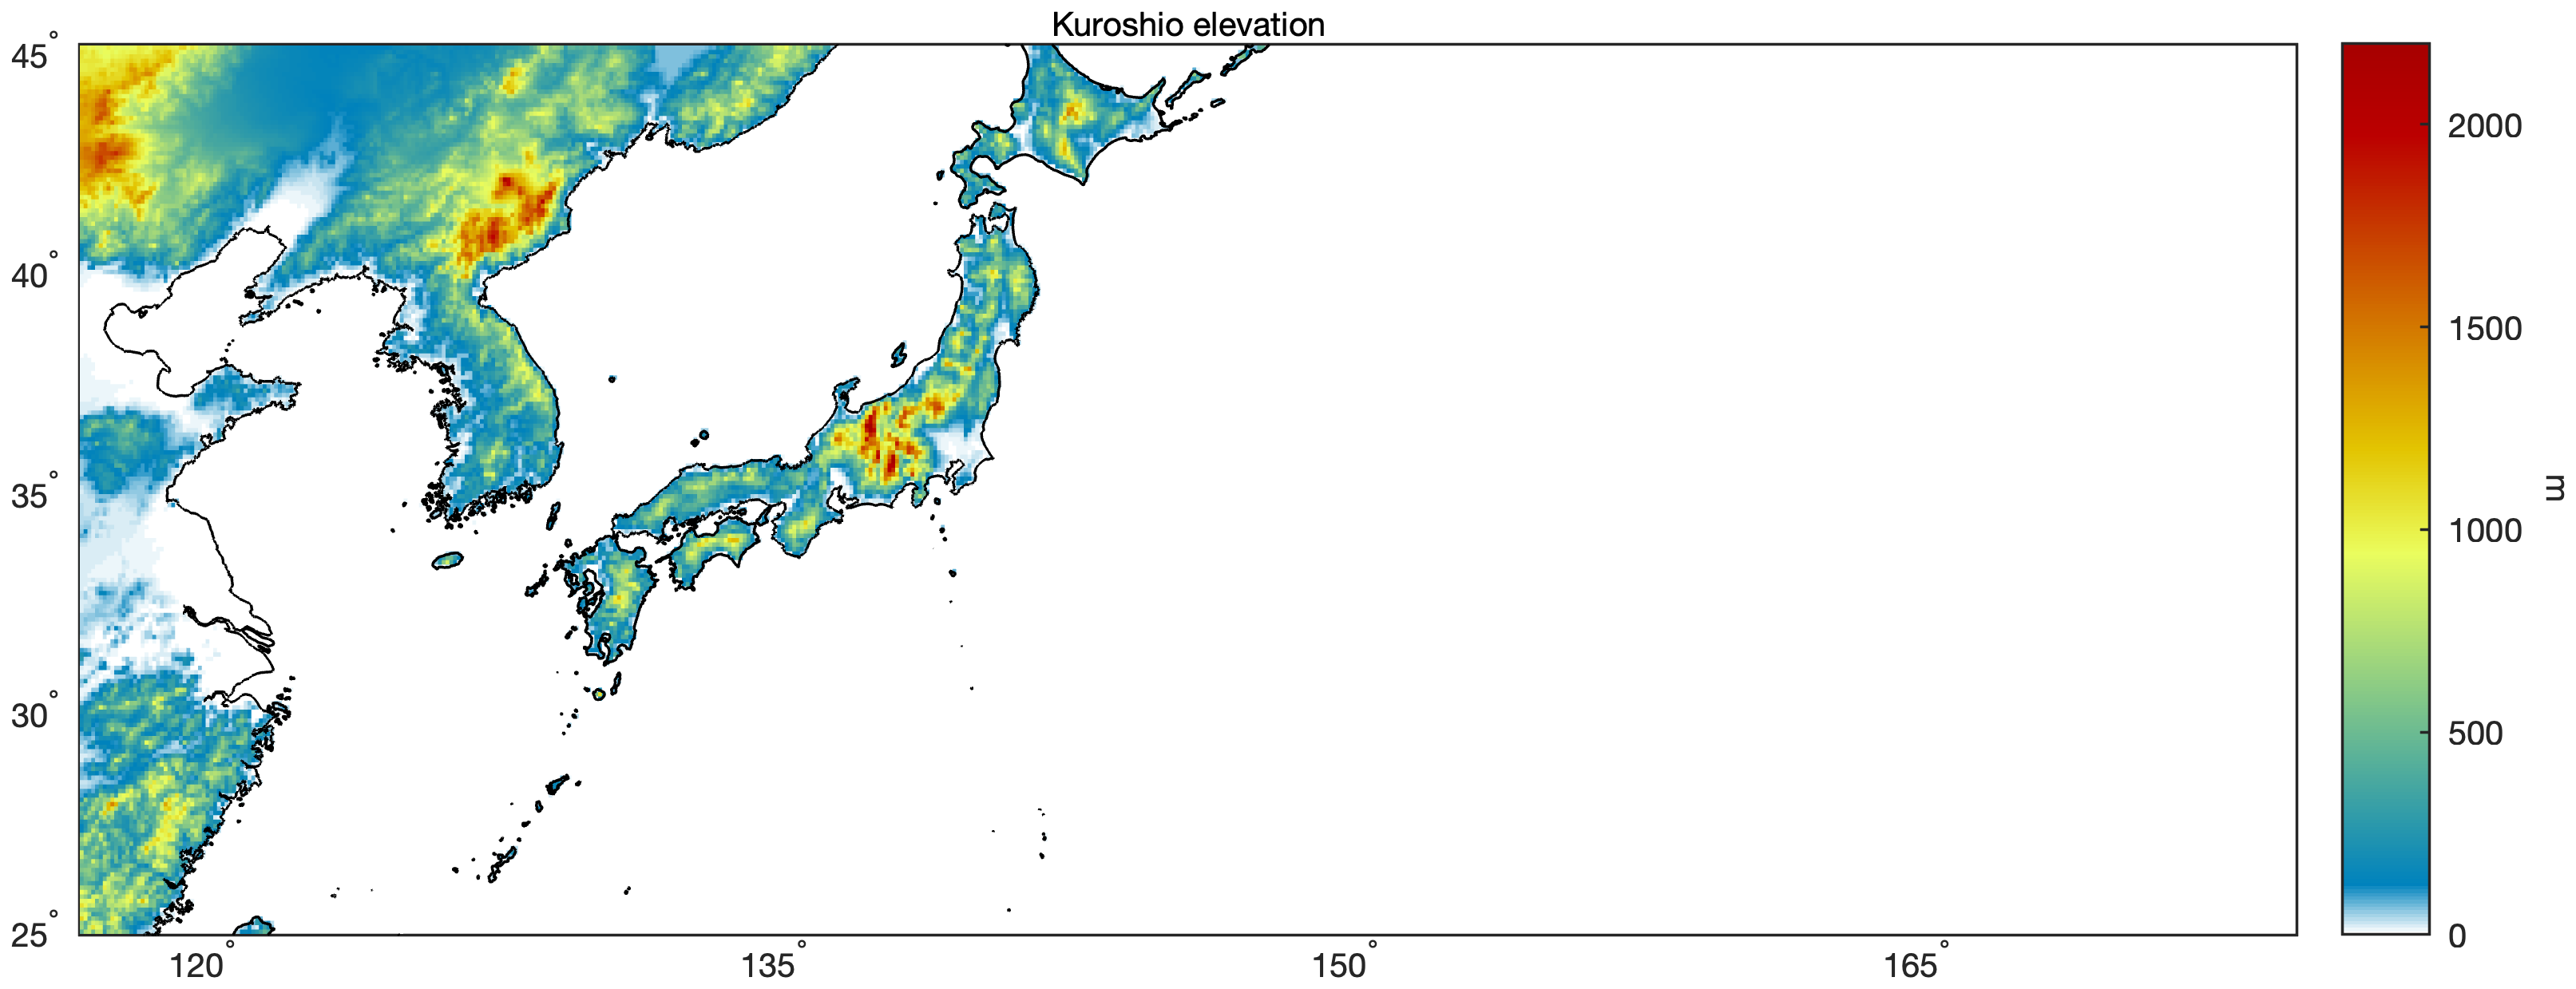
· Kuroshio (lightning and precipitation animations, elevation)
· Mediterranean (lightning and precipitation animations, elevation)
· Northern high latitudes (lightning and precipitation animations, elevation)
· Pacific ITCZ (lightning and precipitation animations, elevation)
· South Pacific (lightning and precipitation animations, elevation)
South America (lightning and precipitation animations, elevation)
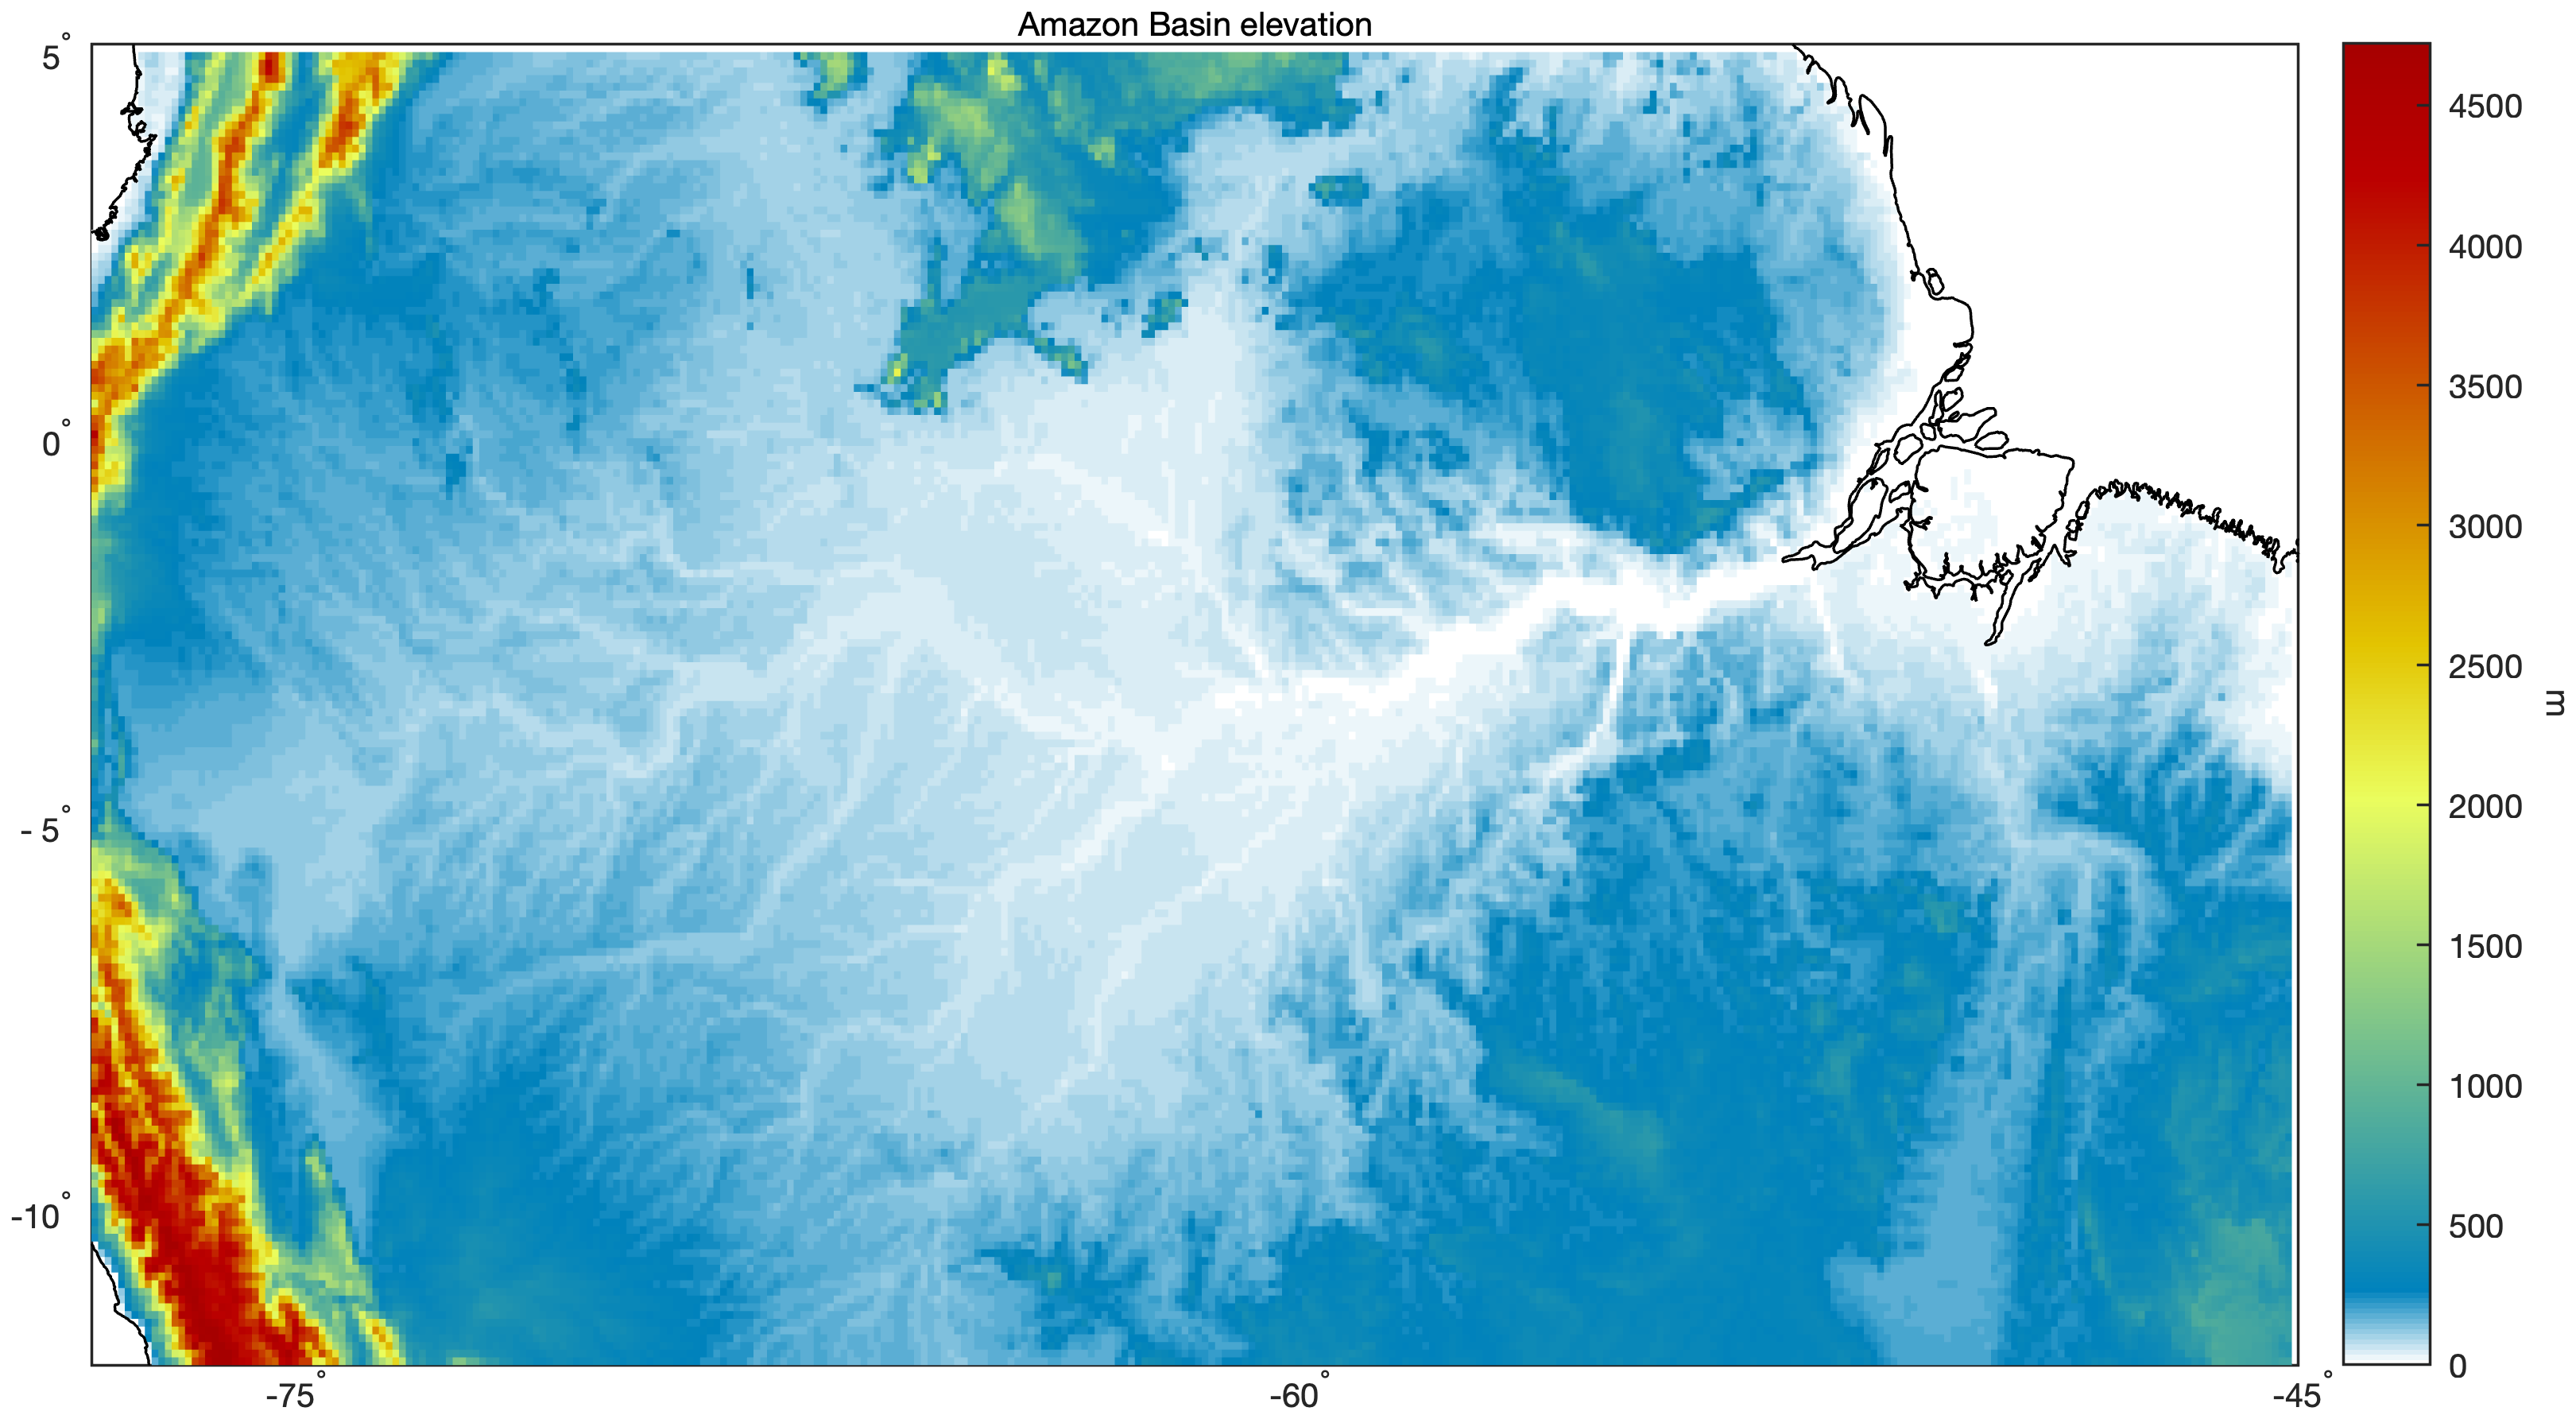
· Amazon Basin (lightning and precipitation animations, elevation)
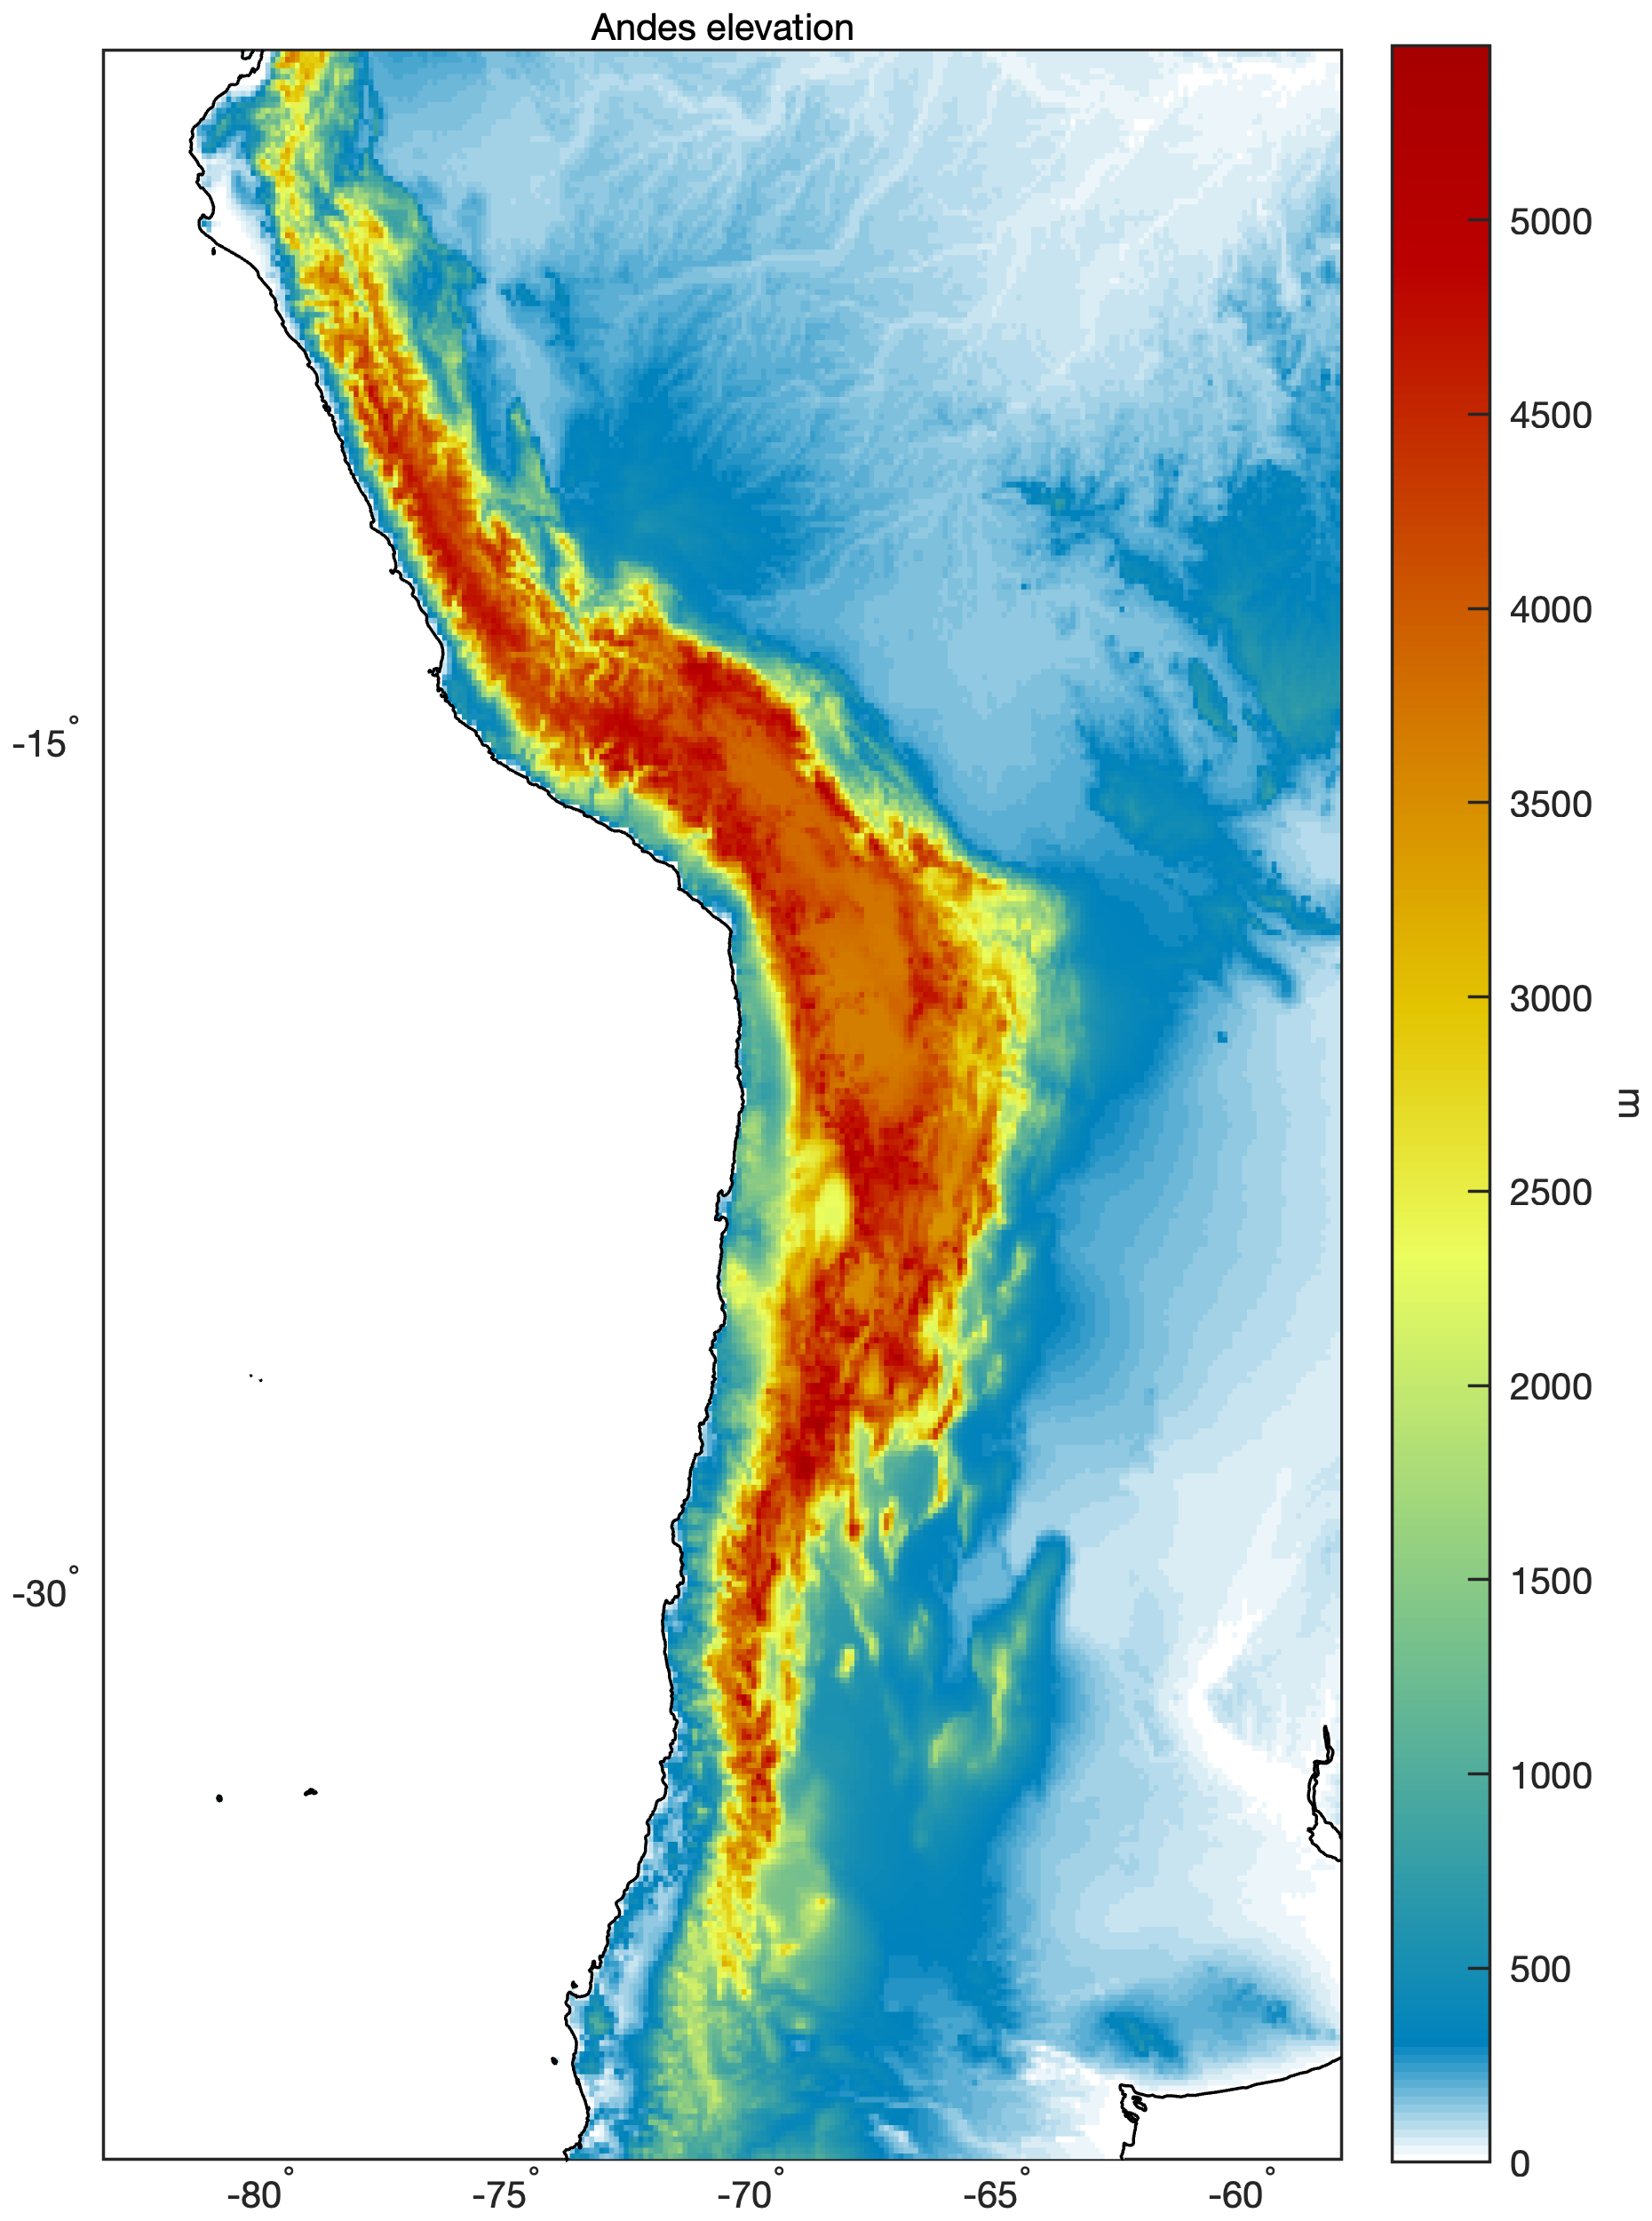
· Andes (lightning and precipitation animations, elevation)
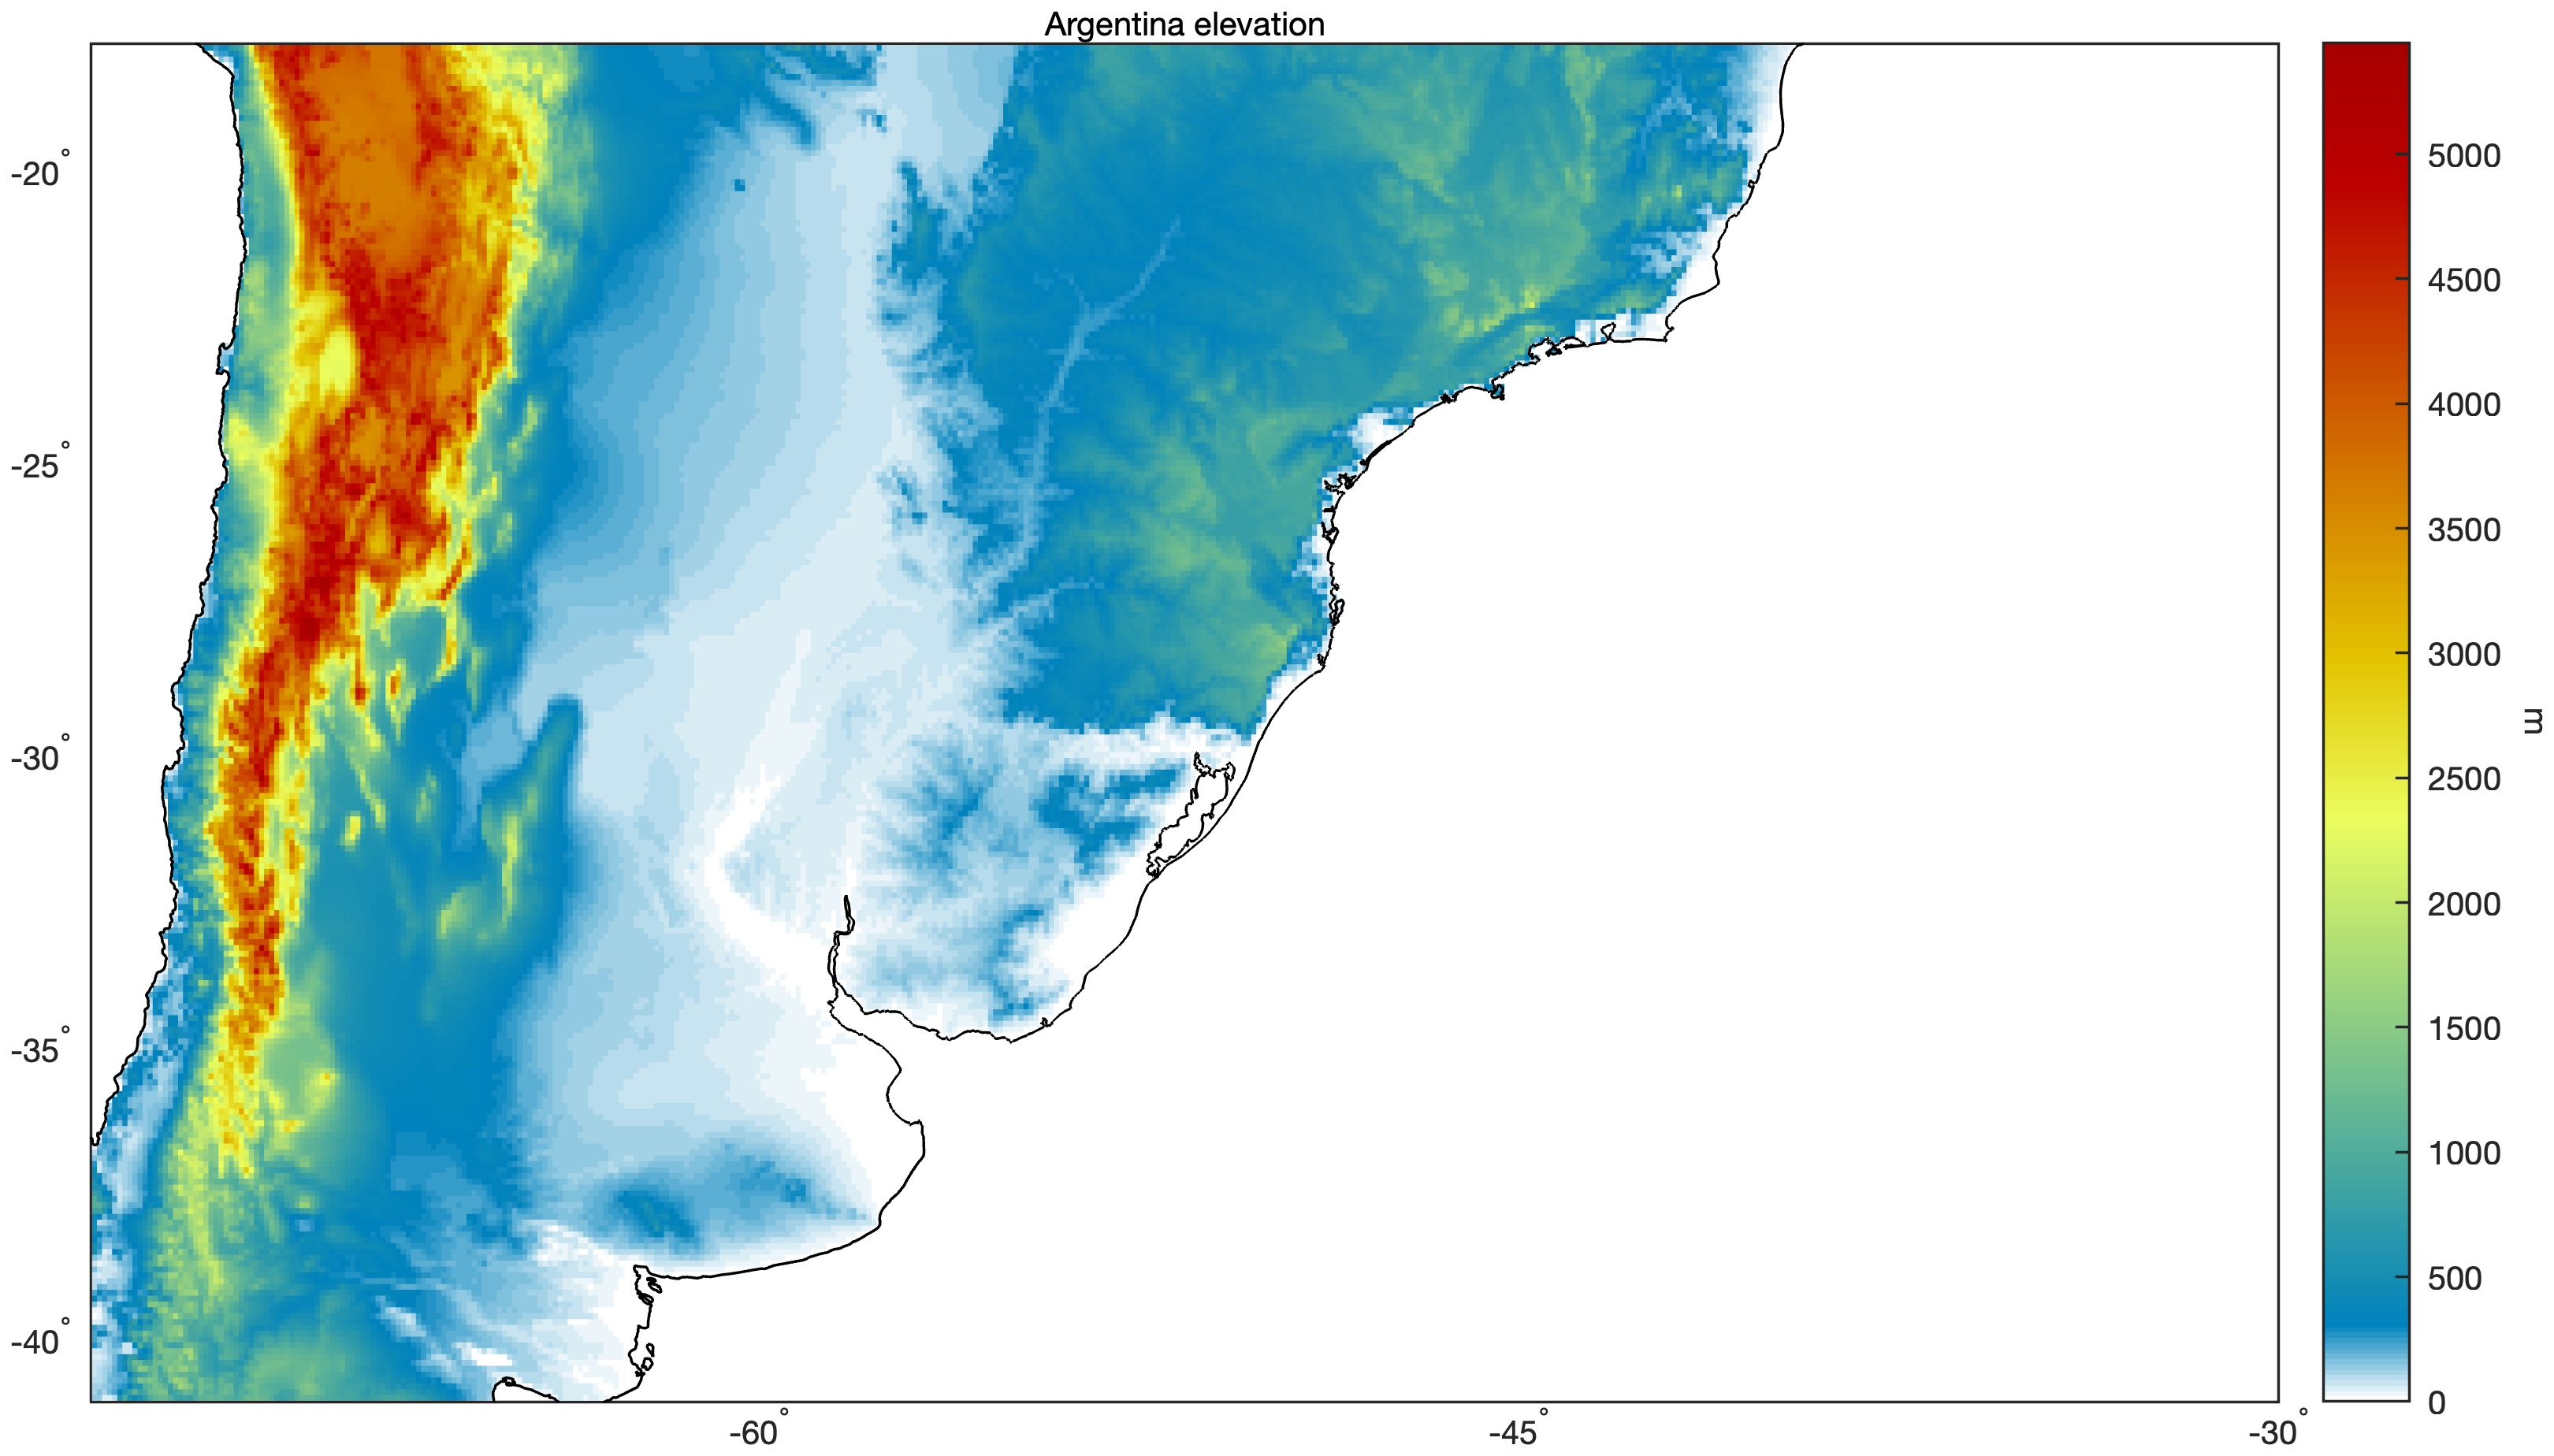
· Argentina (lightning and precipitation animations, elevation)
· Brazil (lightning and precipitation animations, elevation)
· Central Andes (lightning and precipitation animations, elevation)*
· Northern Andes (lightning and precipitation animations, elevation)*
· Northwestern South America (lightning and precipitation animations, elevation)
Seasonal lightning animations
We also make available monthly lightning and precipitation animations, averaged over all hours of the day.
Global (lightning and precipitation animations)
Africa (lightning and precipitation animations)
Asia (lightning and precipitation animations)
Australasia/Oceania (lightning and precipitation animations)
Europe (lightning and precipitation animations)
North America (lightning and precipitation animations)
South America (lightning and precipitation animations)
Another way of illustrating the annual cycle is plotting the 31-day running mean of lightning occurrence, averaged over all hours of the day. This animation has frames every 10 days, and a similar precipitation animation is also available.
Daily lightning animation
Lastly, we offer an animation of the annual cycle of lightning occurrence,
averaged over all hours of the day. Frames are each day, and a 31-day
running mean has been applied at each grid point.
Data access
The WWLLN global stroke density climatology is available at 1º and 0.1º resolution for research (i.e., non-commercial use). Further information about the dataset can be found in the readme. When using the data, please cite Virts et al. (2013) and include the following statement: “The authors wish to thank the WWLLN (http://www.wwlln.net), a collaboration among over 50 universities and institutions, for providing the lightning data used in this paper.”
Acknowledgements
The TRMM LIS/OTD climatology was obtained from NASA's Global Hydrometeorology Resource Center (GHRC). IMERG data were obtained from NASA’s Goddard Earth Sciences Data and Information Services Center (GES DISC). Coastline and elevation data were obtained from the National Geophysical Data Center.
Questions?
Please send questions to Katrina Virts or Bob Holzworth.