WWLLN
GLOBAL STROKE DENSITY TIME SERIES
Introduction
The ground-based World-Wide Lightning Location Network (WWLLN) has continuously monitored global lightning since mid-2004. We are pleased to make available monthly stroke density time series derived from WWLLN lightning detections for 2005-present.
What is stroke density?
Stroke density is the number of strokes detected at a particular location during a time period—that is, how much lightning is occurring. For this dataset, strokes are counted on a 0.1° or 1° latitude/longitude grid during each month.
Import notes for using the data
These stroke densities are as detected by WWLLN and are not corrected for relative detection efficiency, which varies with time and location. Comparisons between absolute intensities in different continental regions, using this work, could be misleading.
During WWLLN’s early years, the number of sensors increased steadily, and the yearly number of detected strokes increased by over a factor of 5 from 2005 to 2013, due to first order to the network’s increased sensitivity and detection efficiency. The number of WWLLN stations has been largely consistent since 2013. If using data prior to 2013, you may need to apply a correction to account for this non-physical trend.
Examples
Monthly stroke density for 2013-present, illustrating both seasonal and interannual variability.
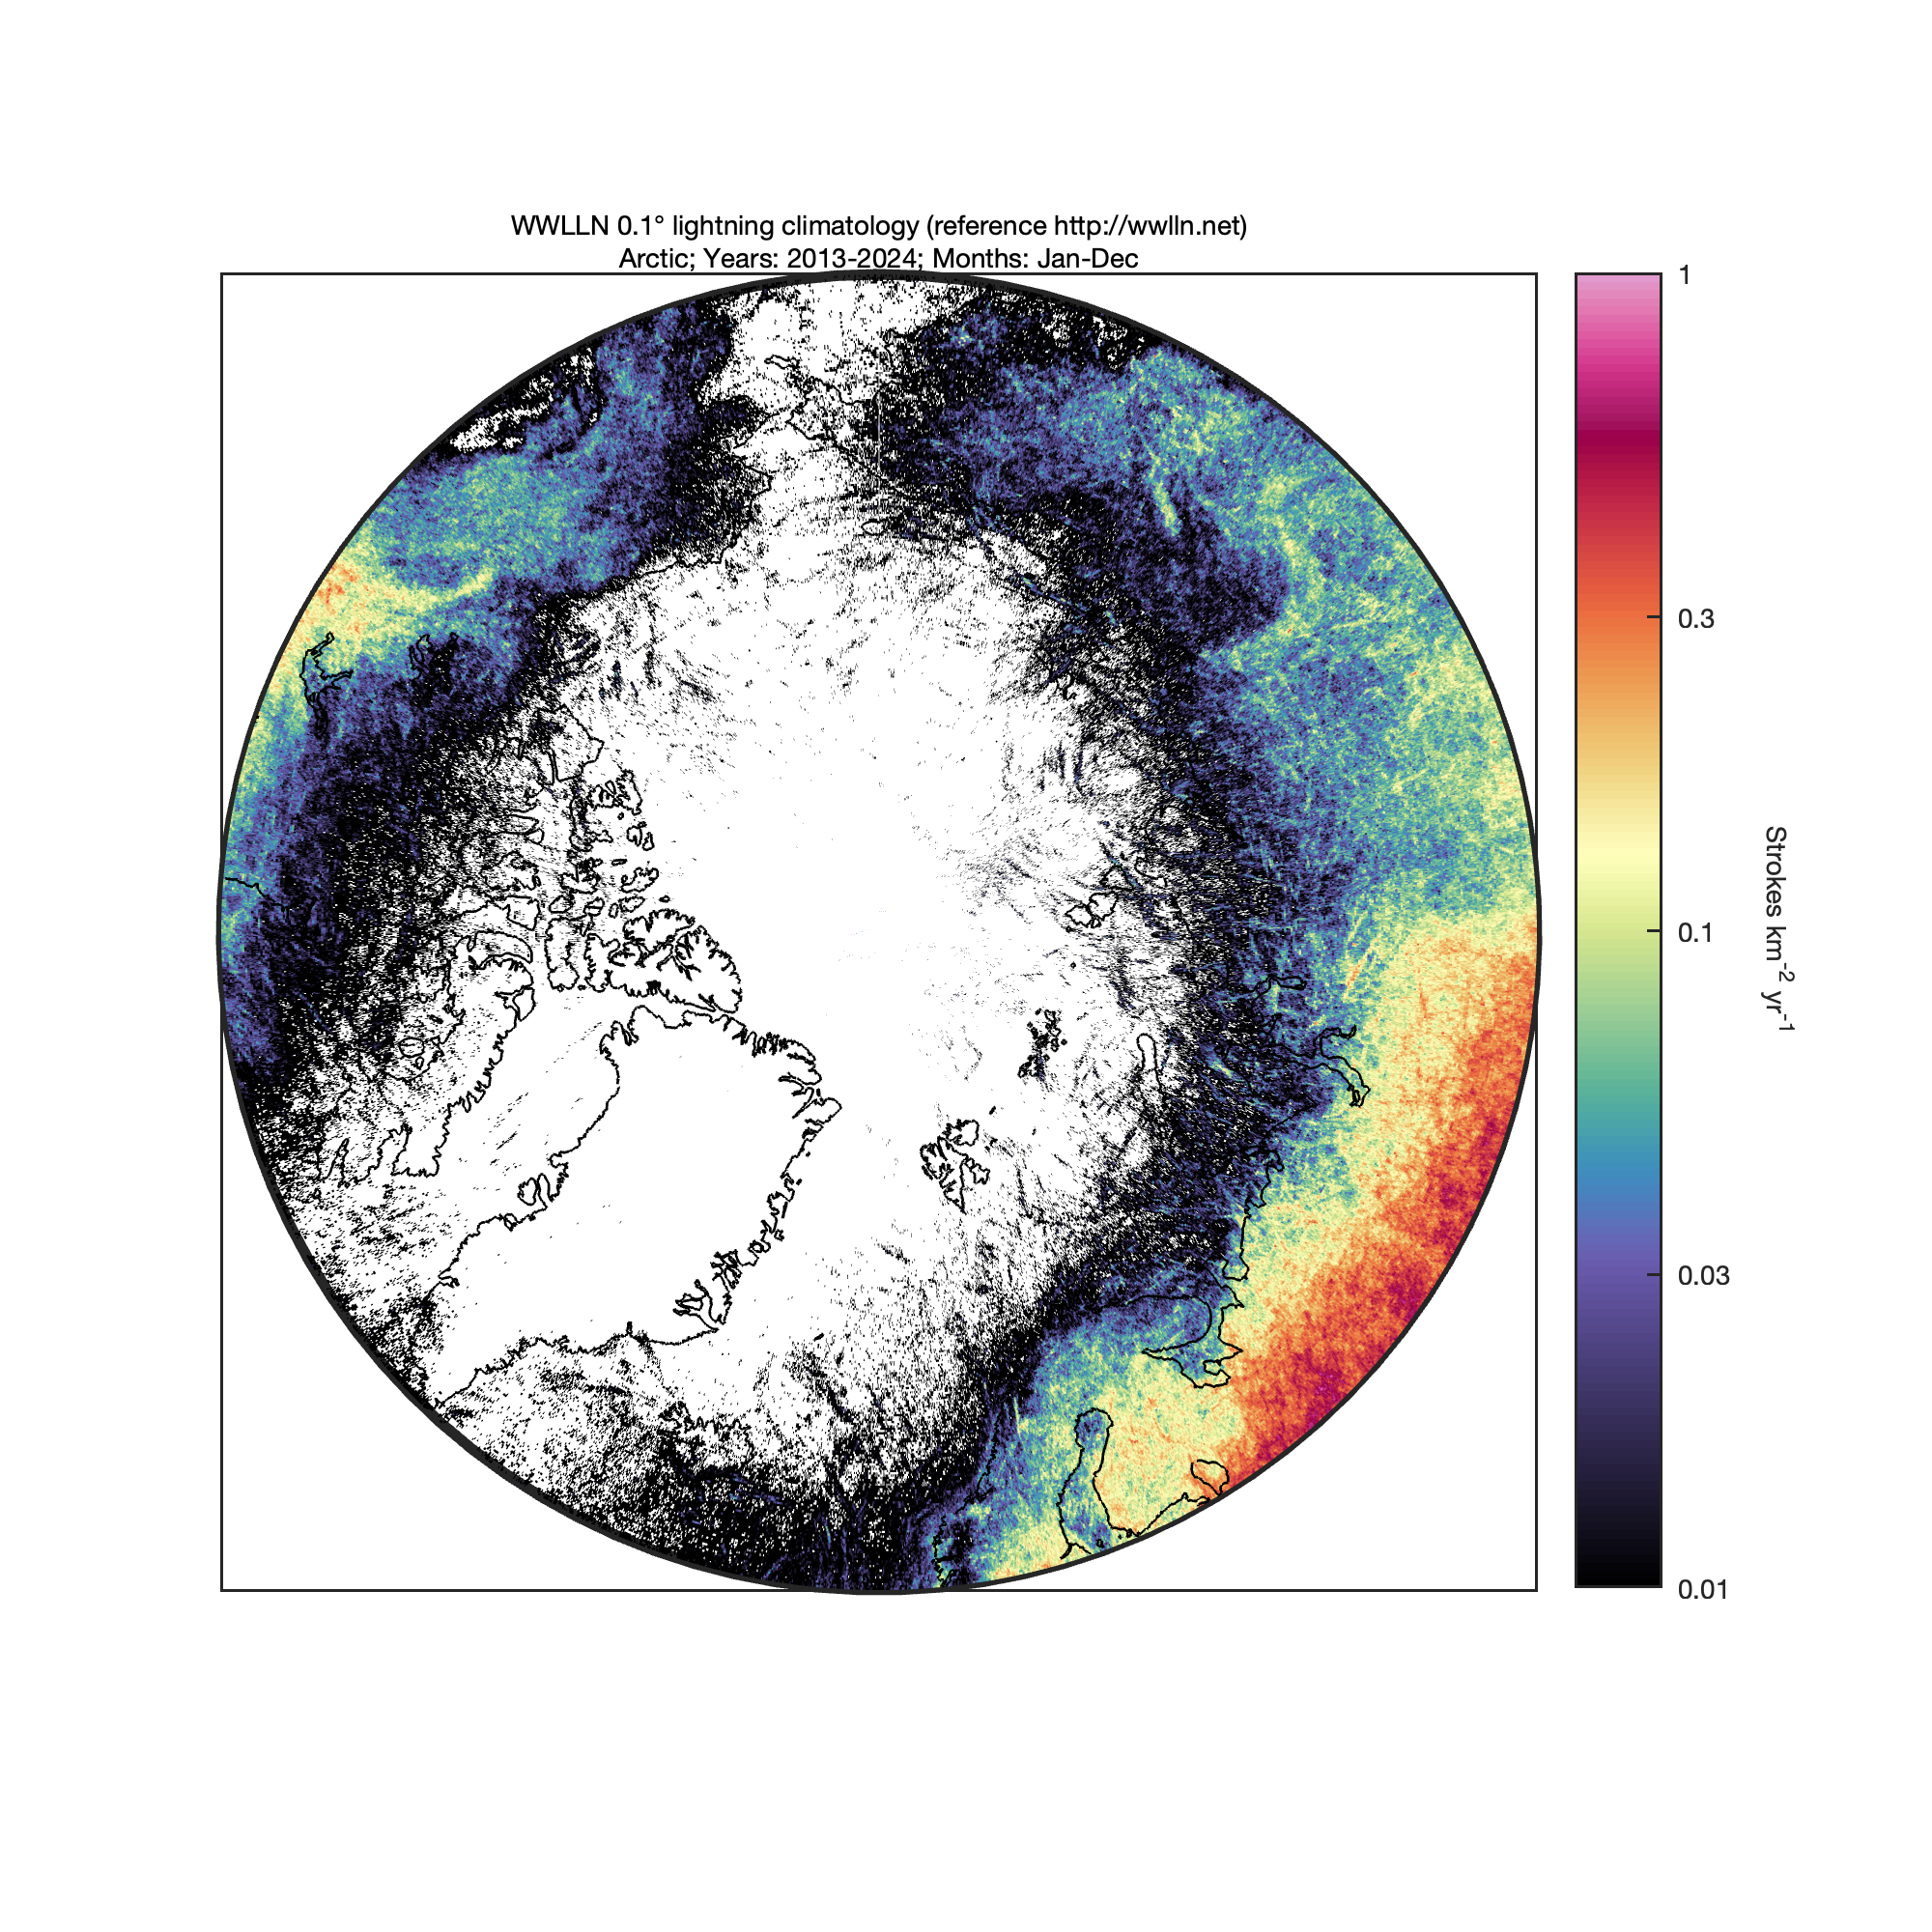
Stroke density over the Arctic, outside the field of view of geostationary lightning sensors: yearly animation and climatological-mean plot for May-September.
Data access
The WWLLN monthly stroke density dataset is available for research (i.e., non-commercial) use. Further information about the dataset can be found in the readme. When using the data, please include the following statement: “The authors wish to thank the WWLLN (http://www.wwlln.net), a collaboration among over 50 universities and institutions, for providing the lightning data used in this paper.”
Questions?
Please send questions to Katrina Virts or Bob Holzworth.