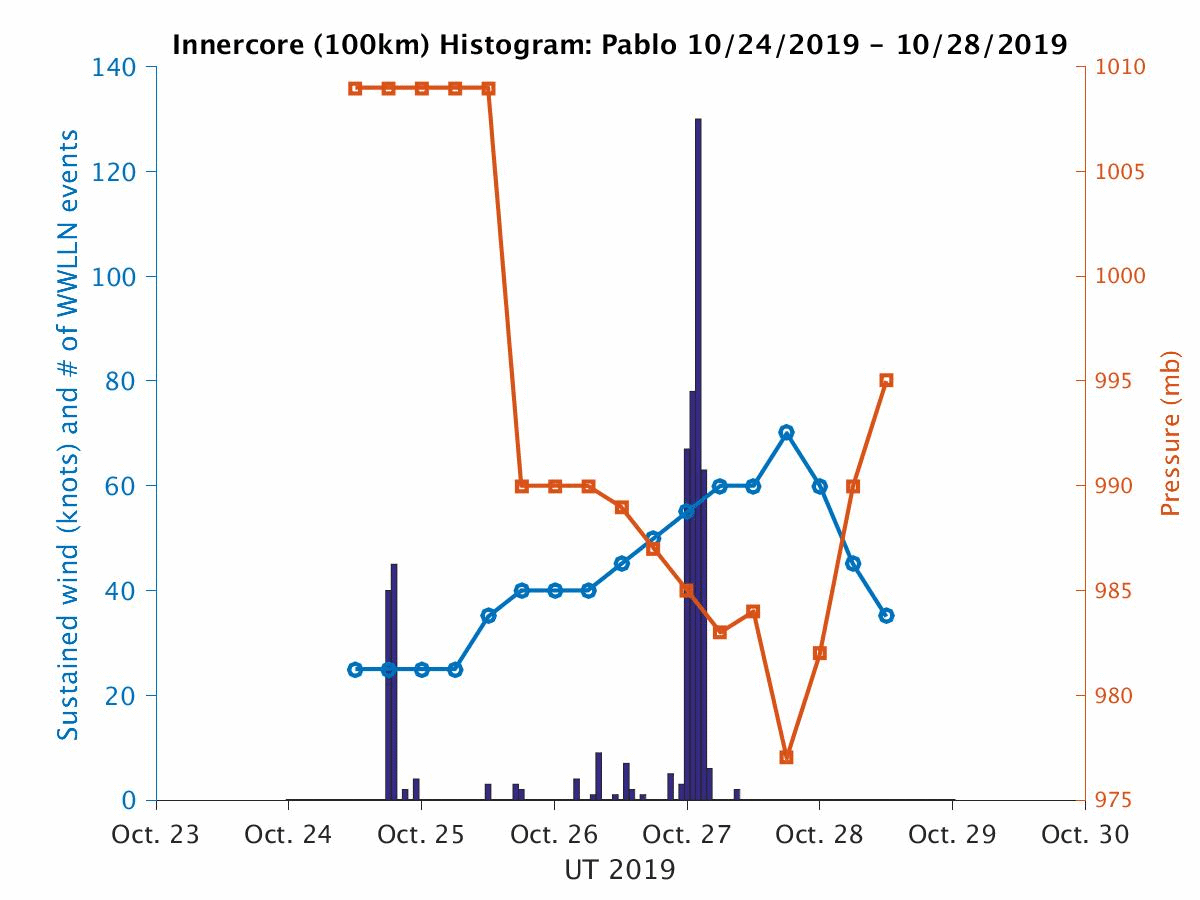
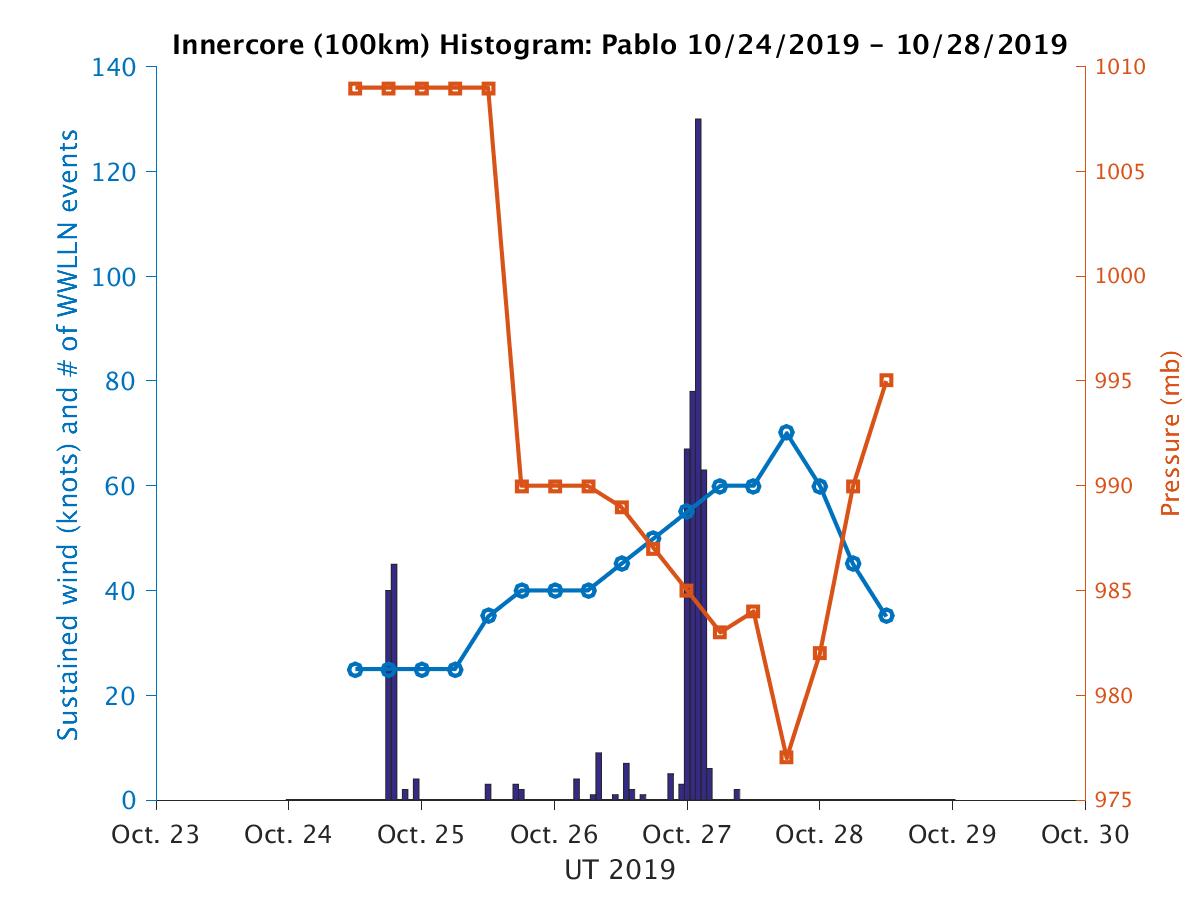
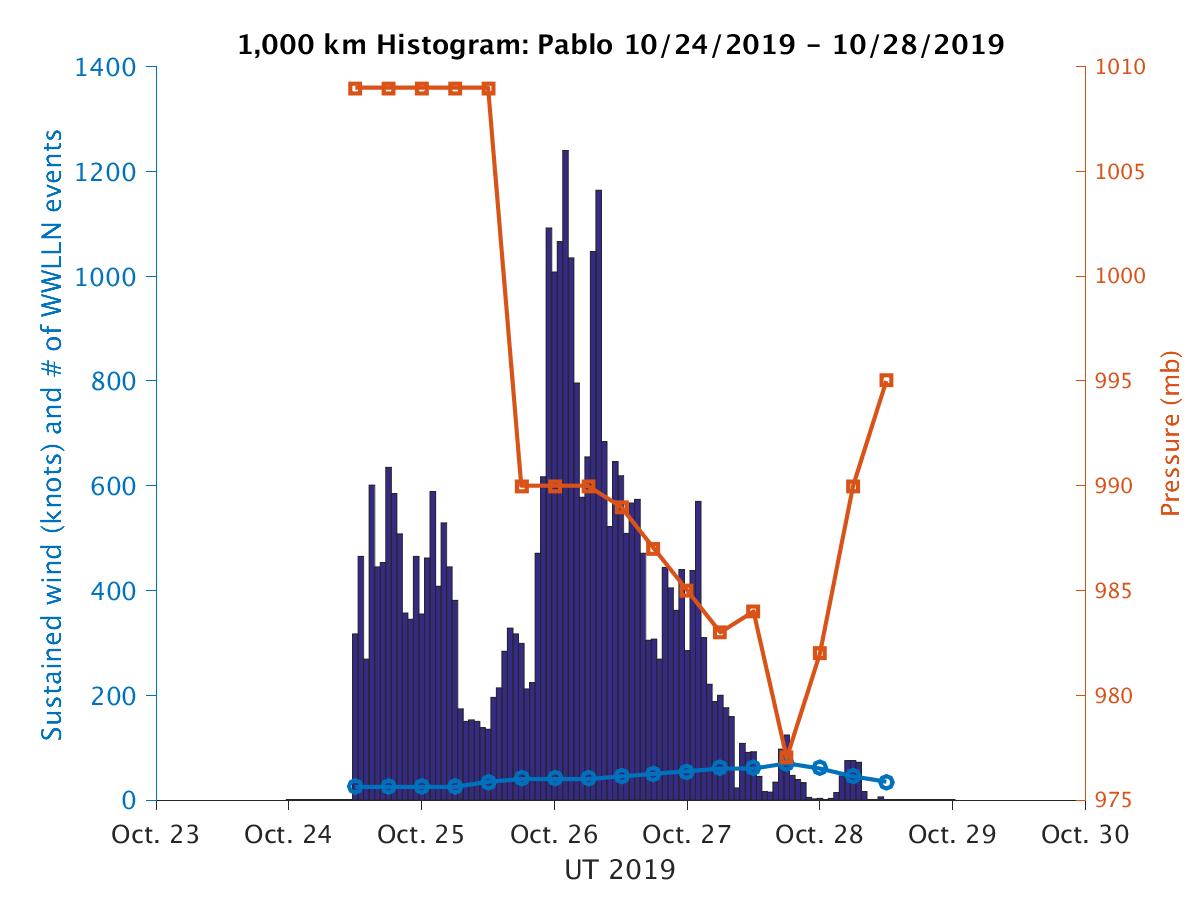
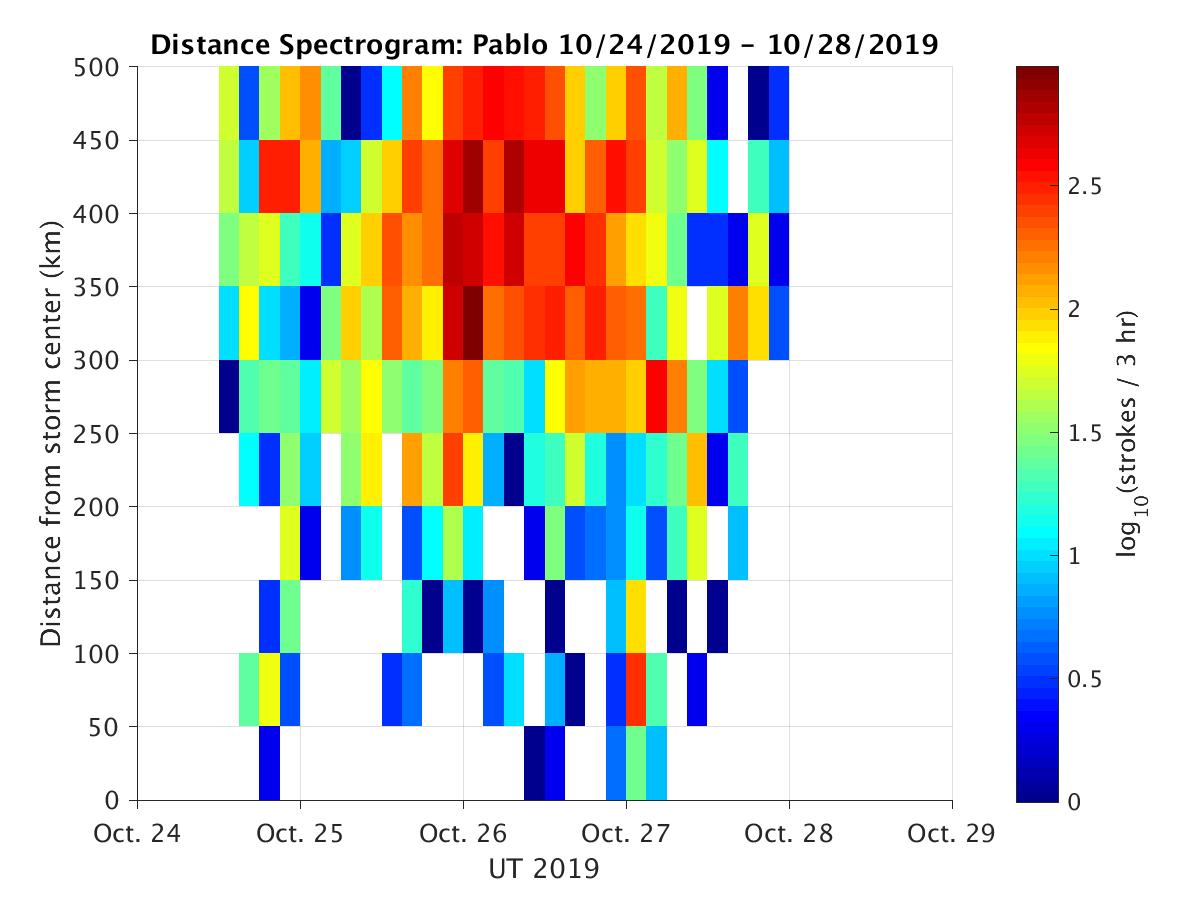
Lightning Histogram Plot
Three plots are created. The first is of wind speed, pressure, and a histogram of the number of lightning strokes per hour for lightning within 1000 km of the storm center. The second is the same, but only for lightning within 100 km of the storm center. The third plot is a spectrogram showing the number of lightning strokes per three hours binned by the radial distance from the storm center.
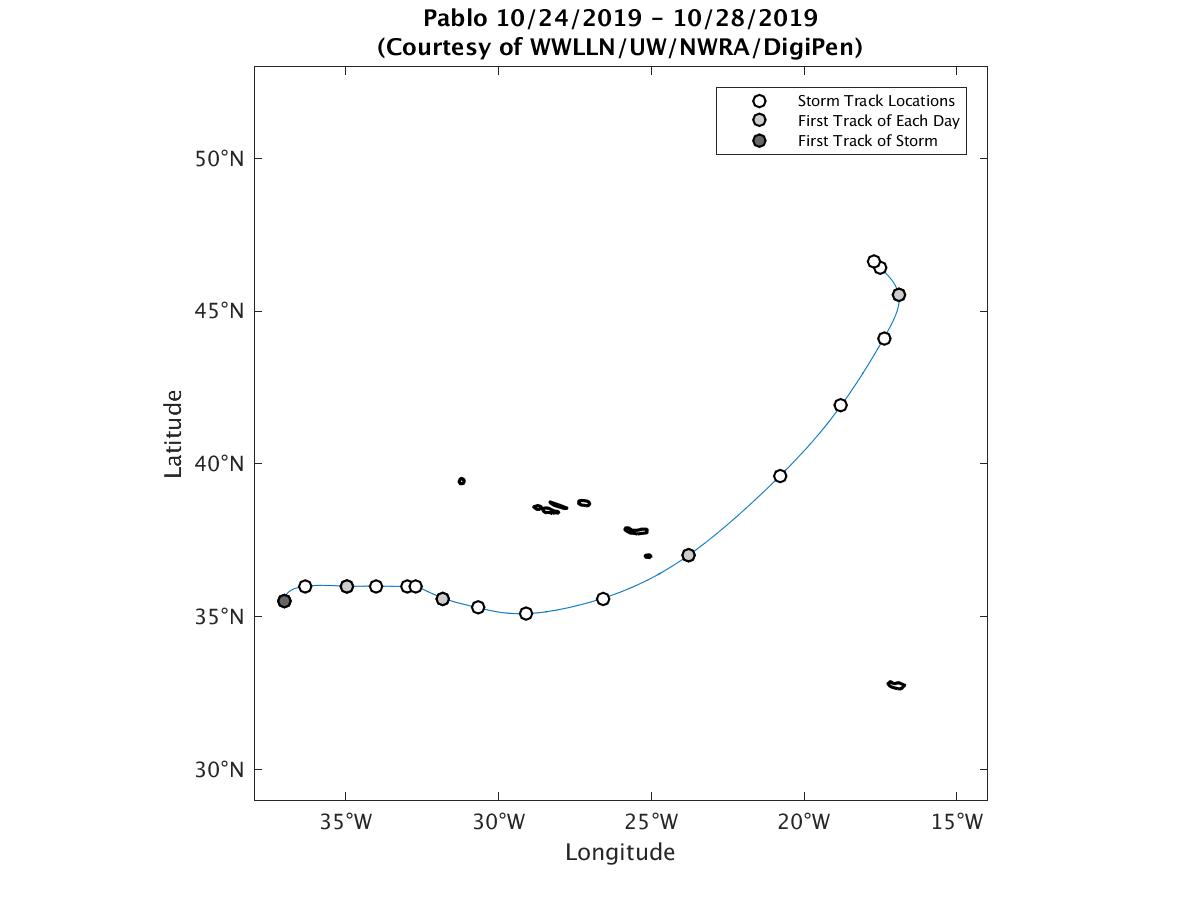
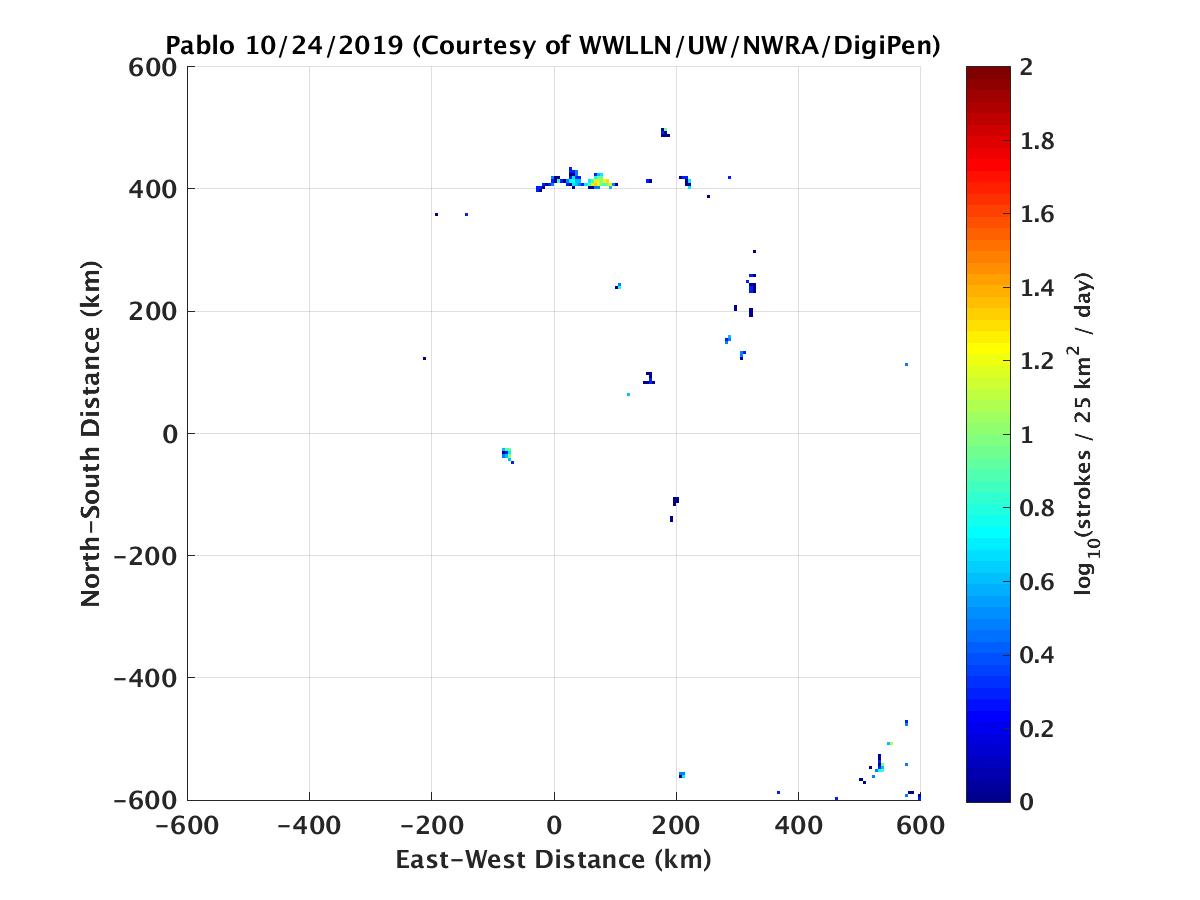
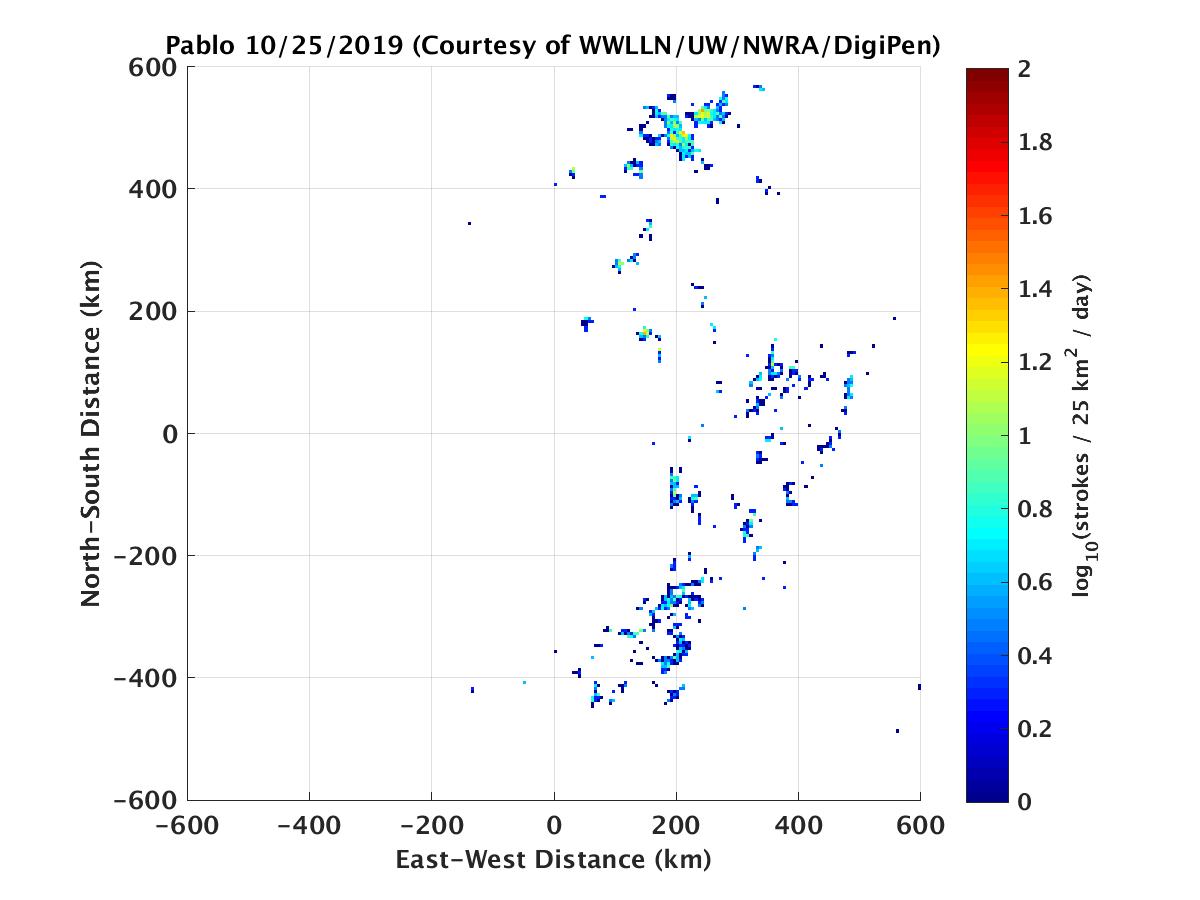
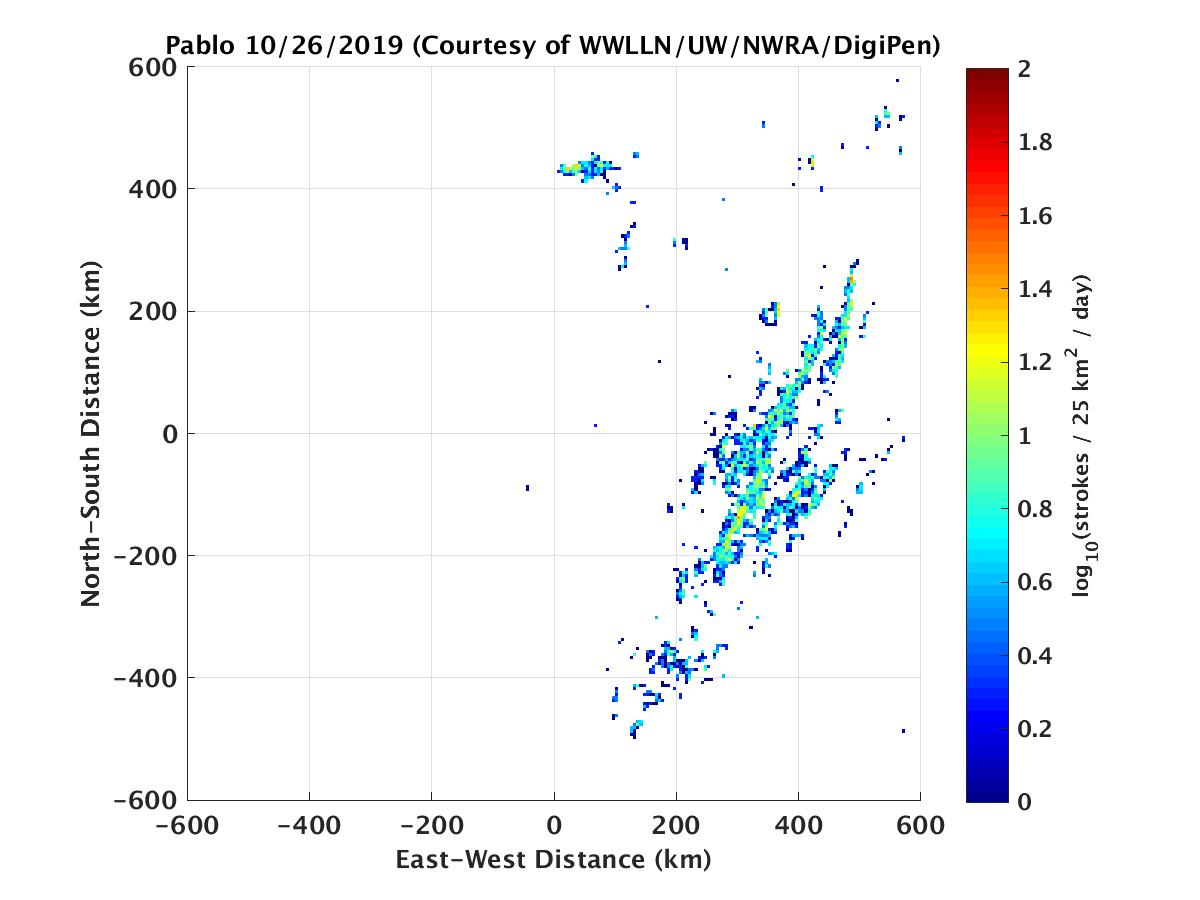
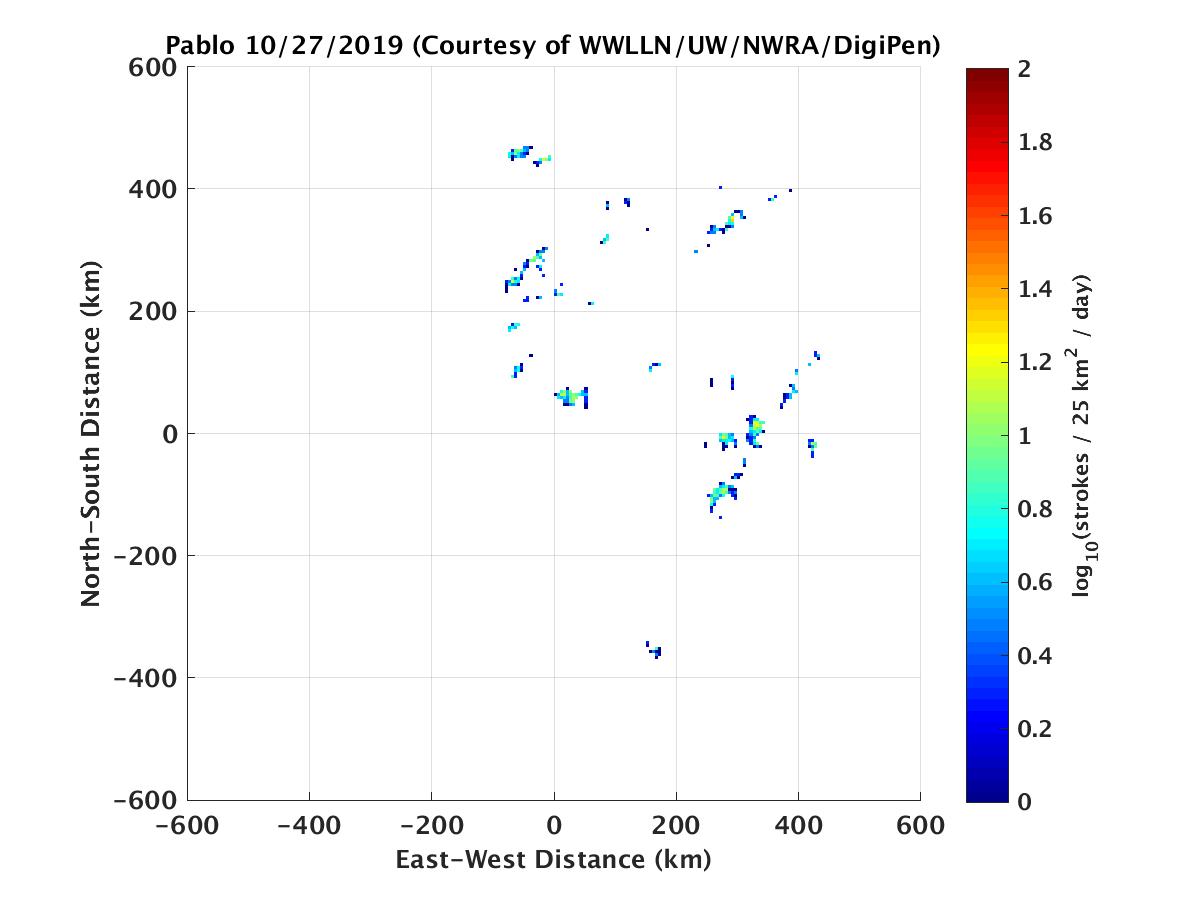
Lightning Density Plot
Plots of daily lightning density relative to center of the storm. Daily plots are combined into an animated GIF.

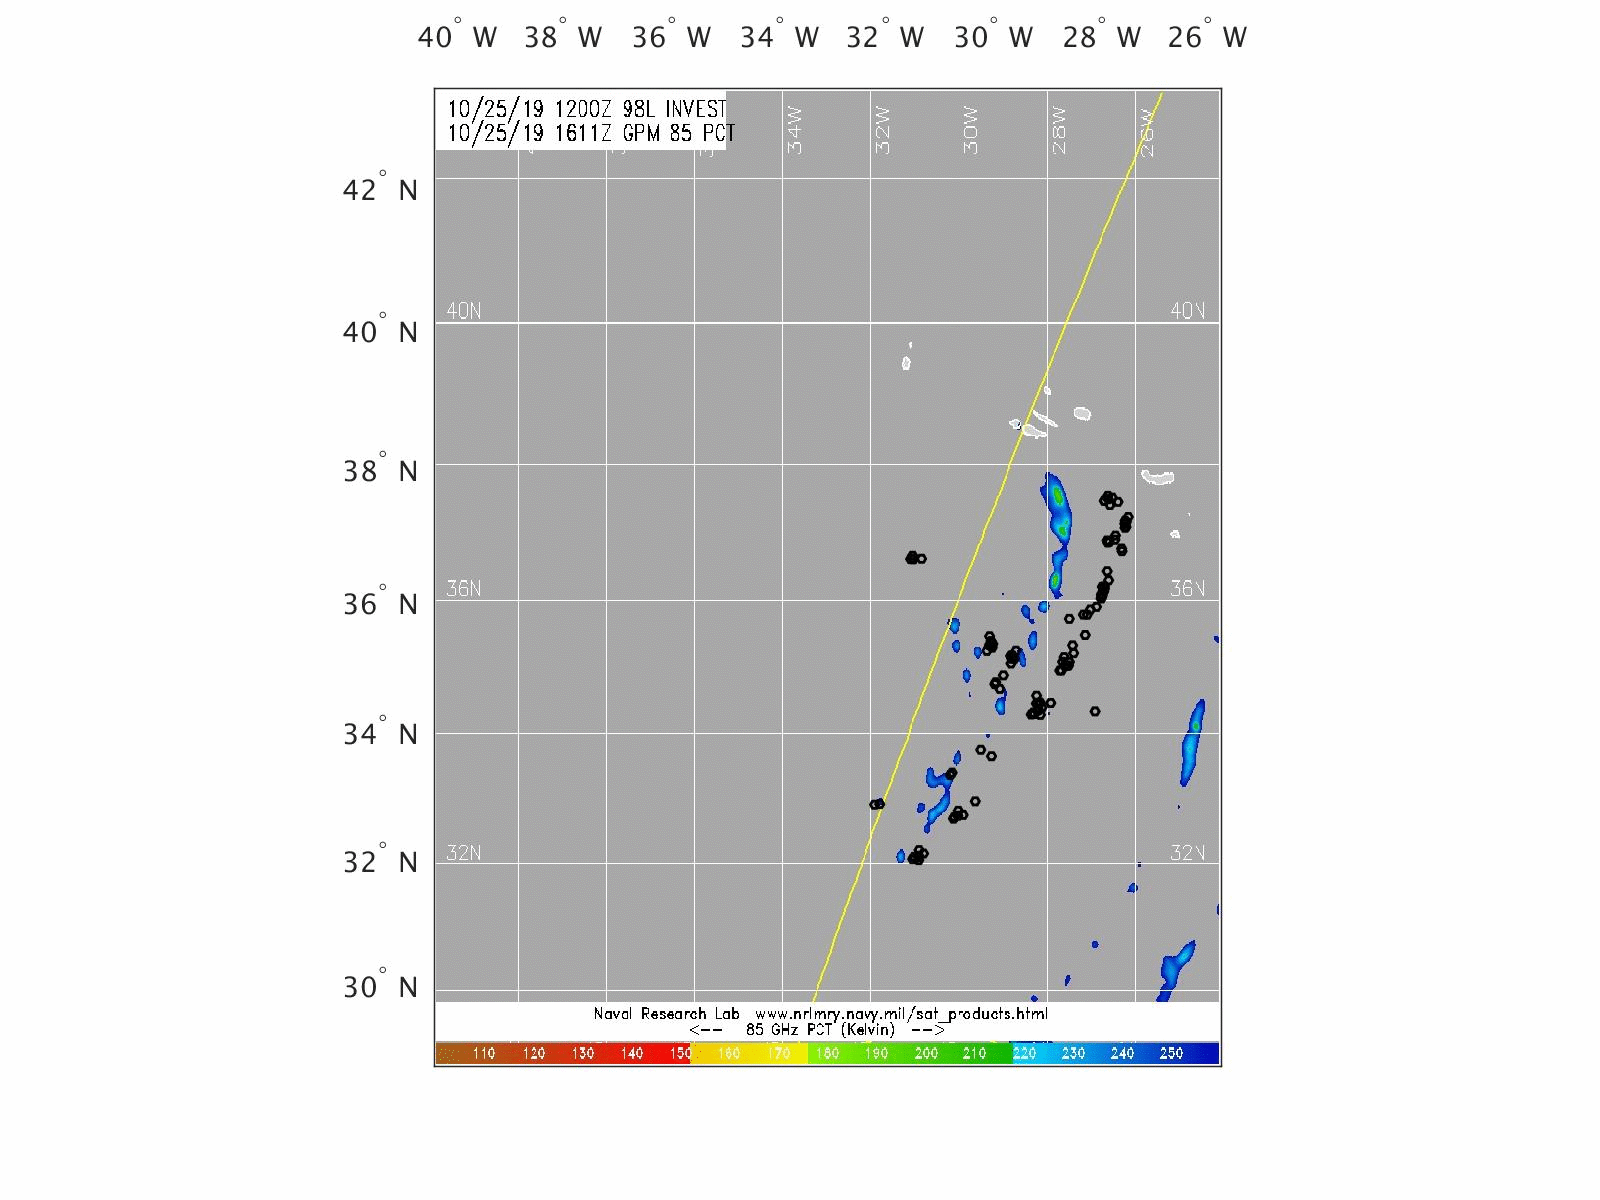
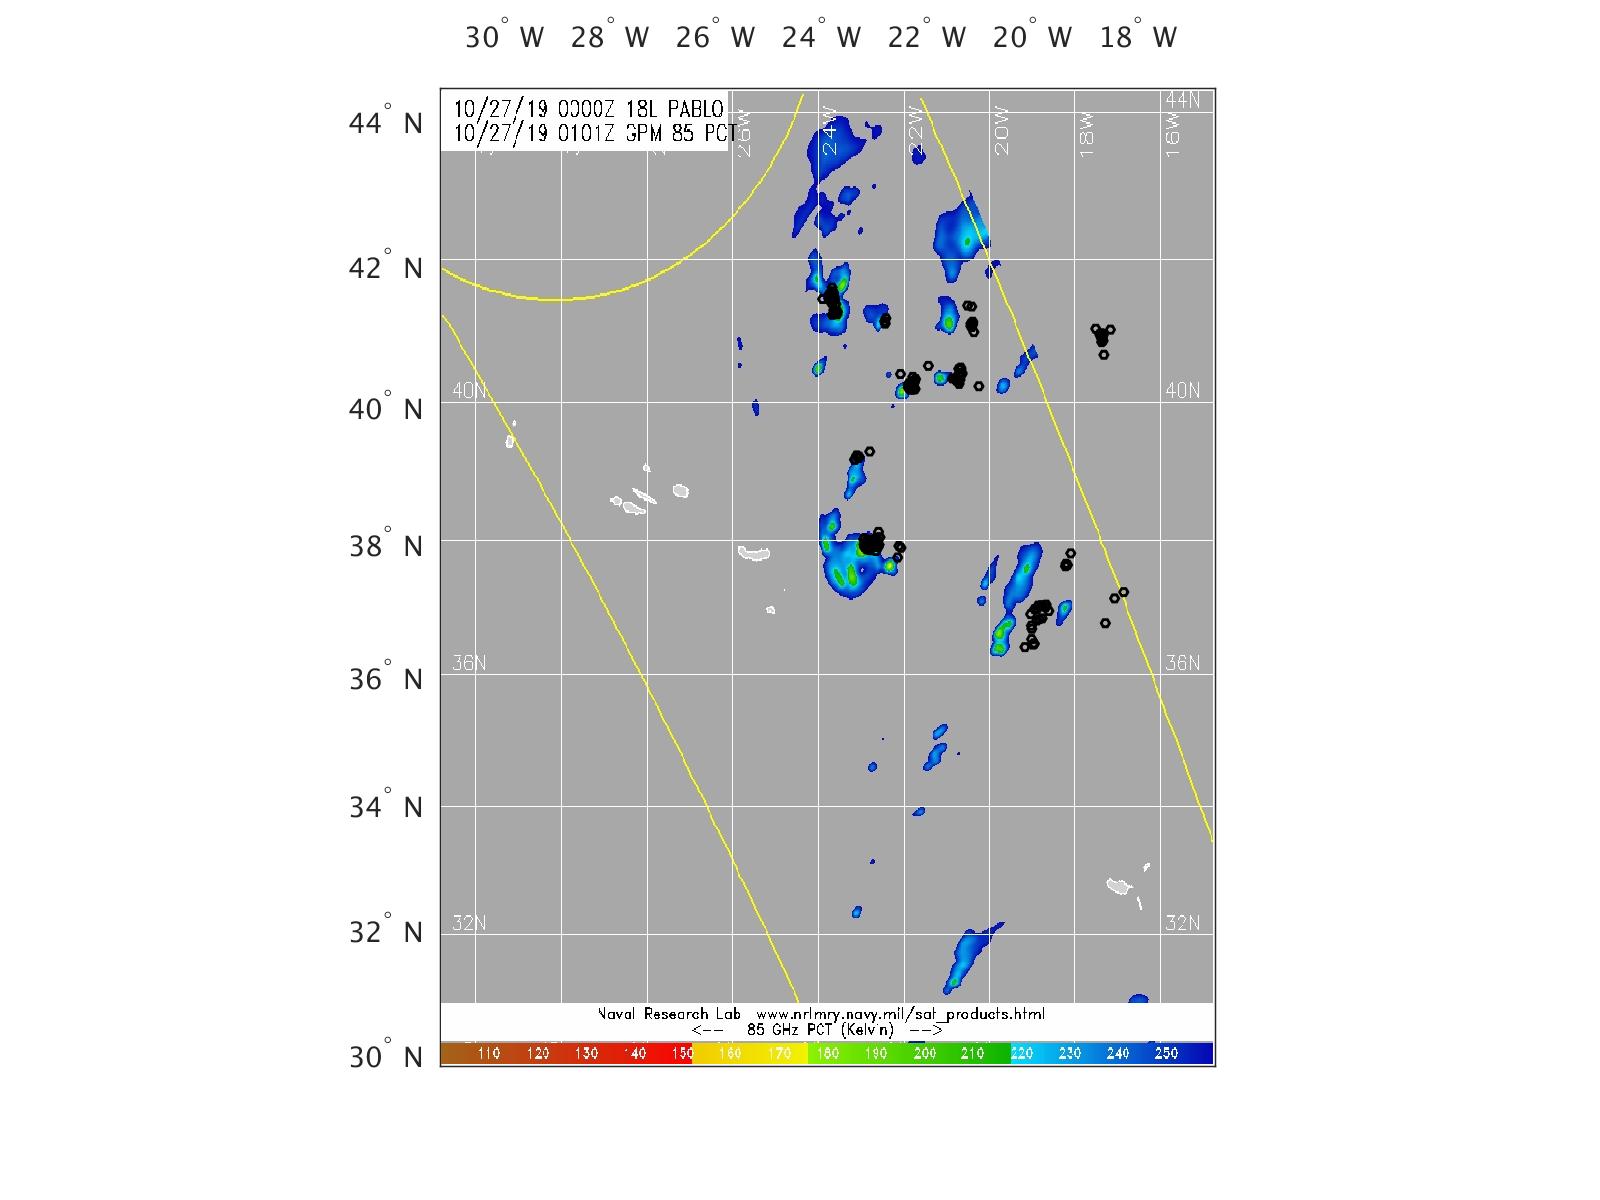
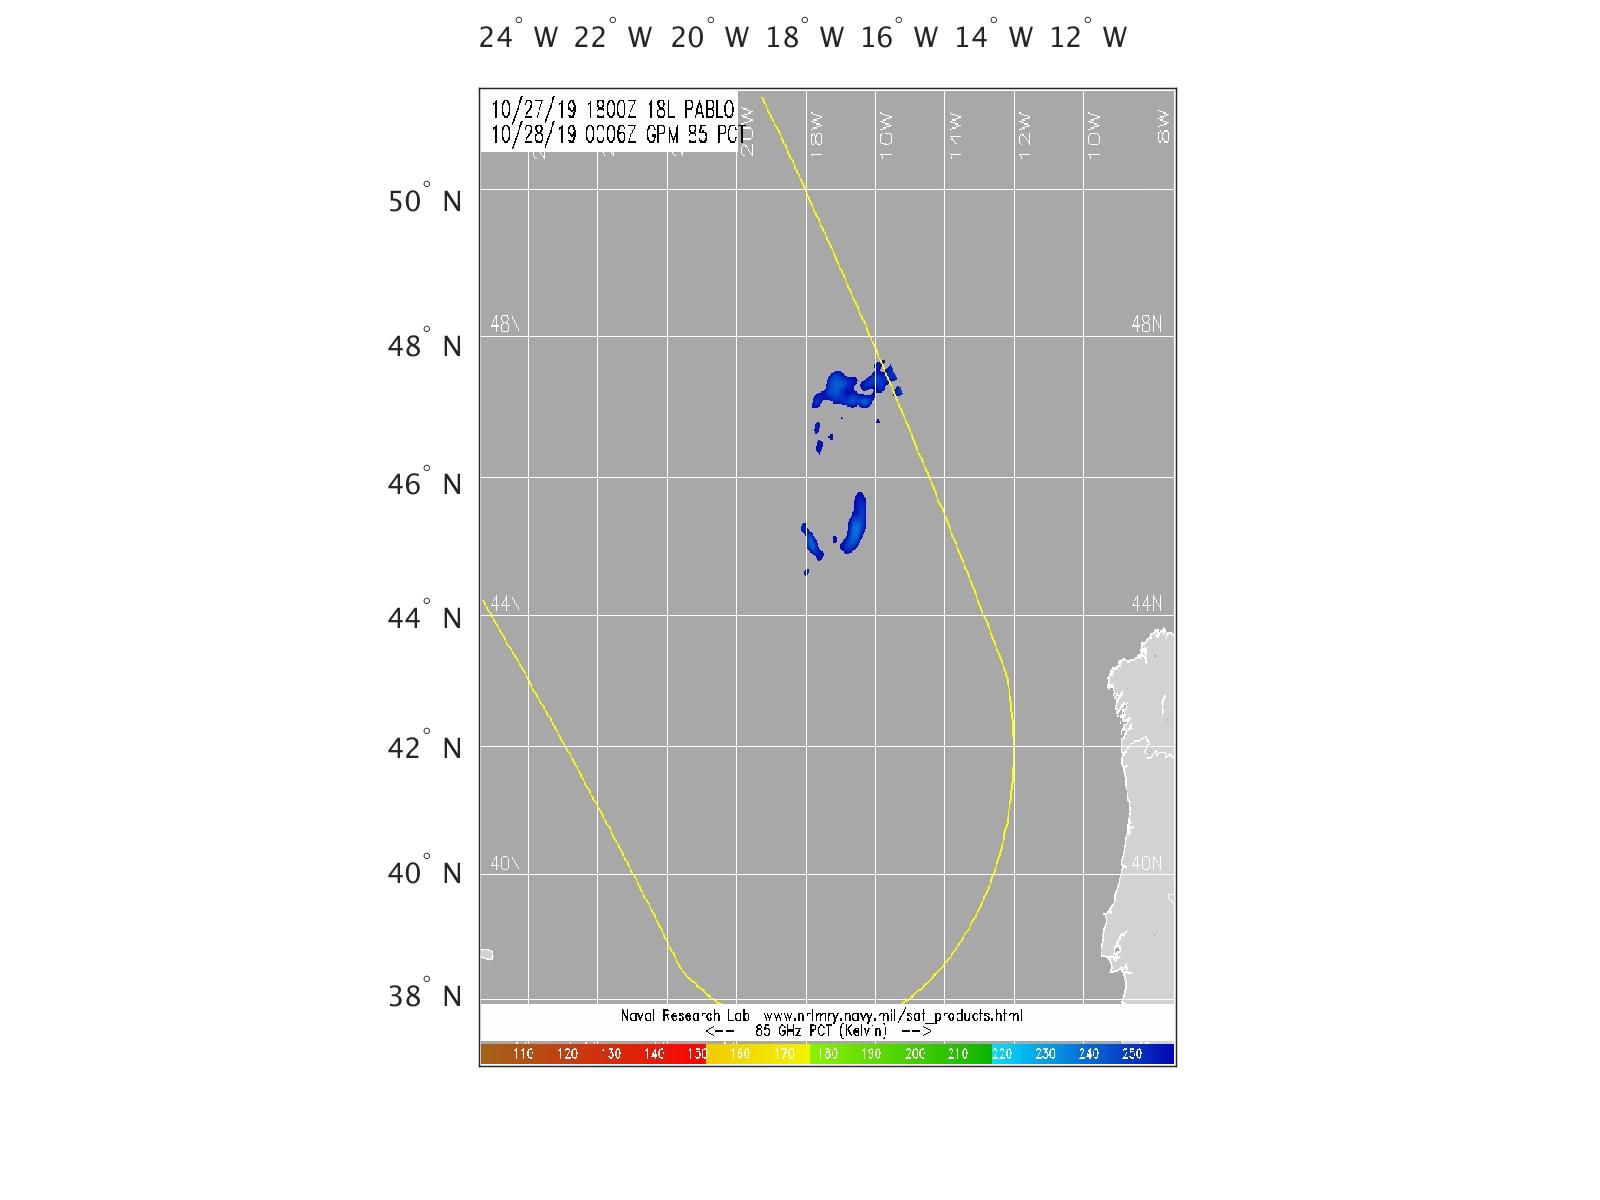
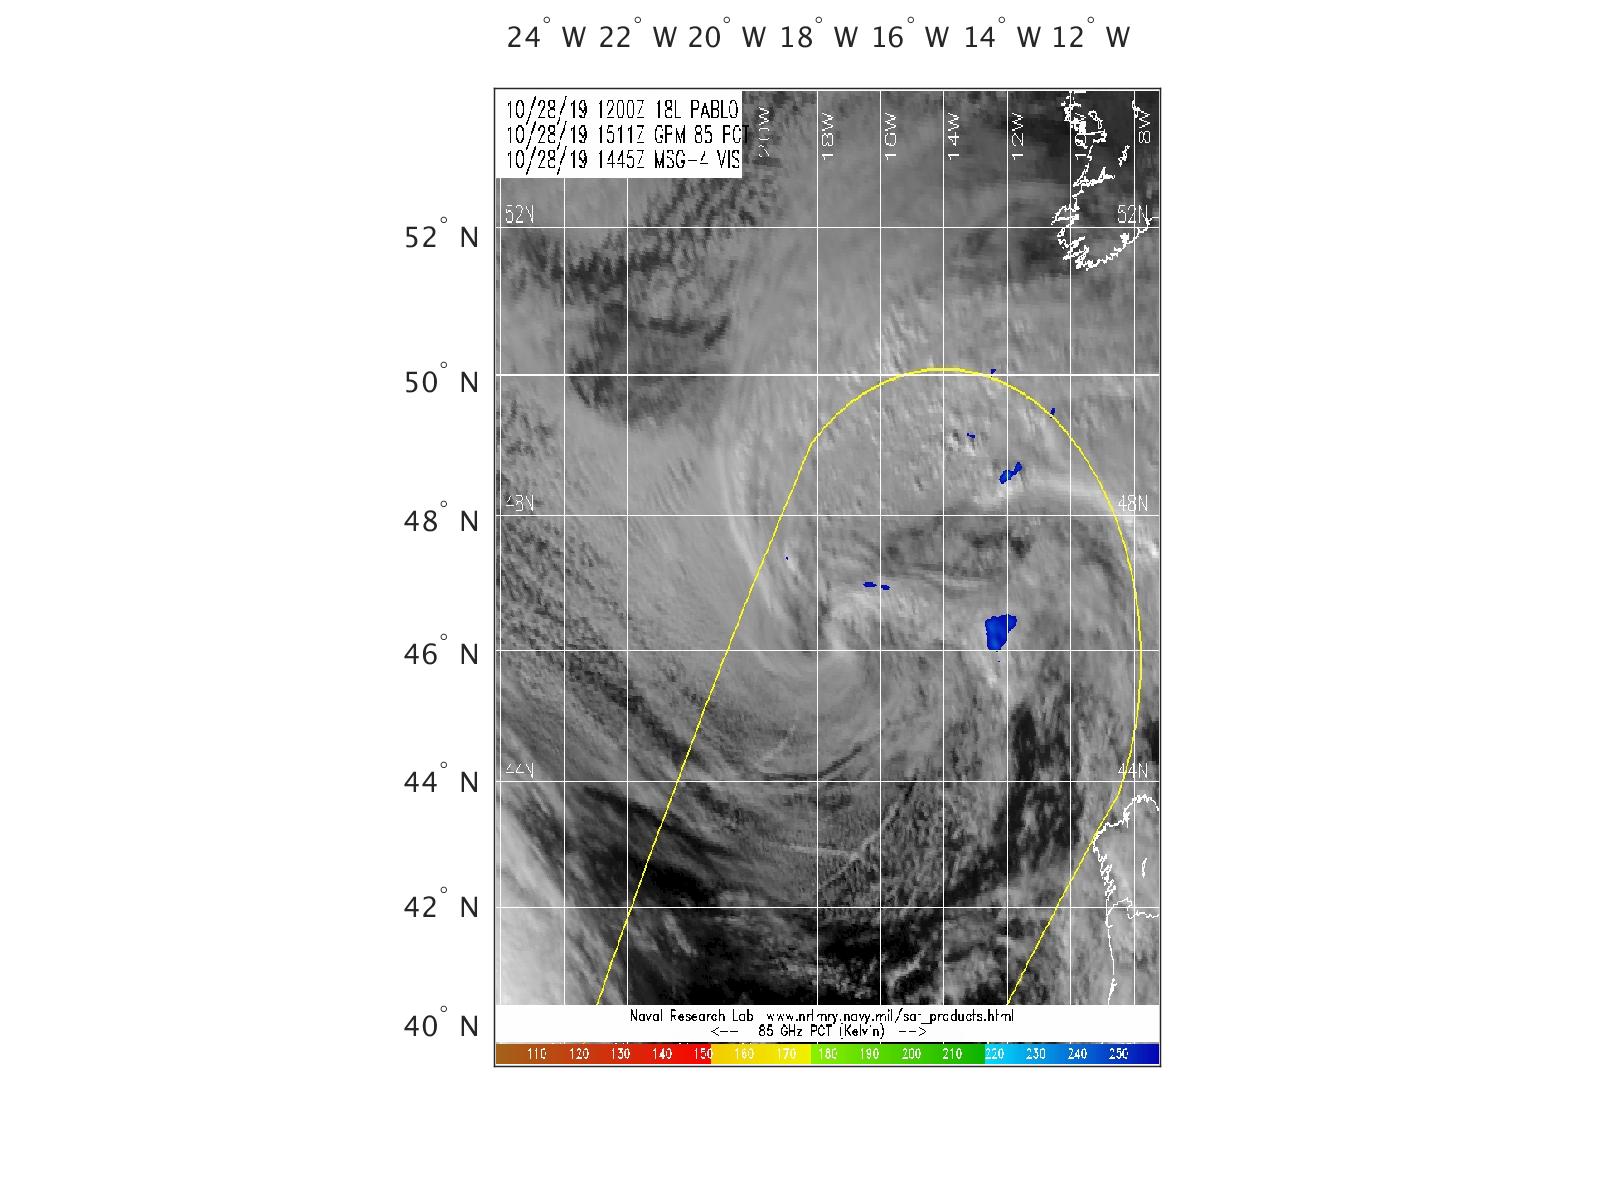
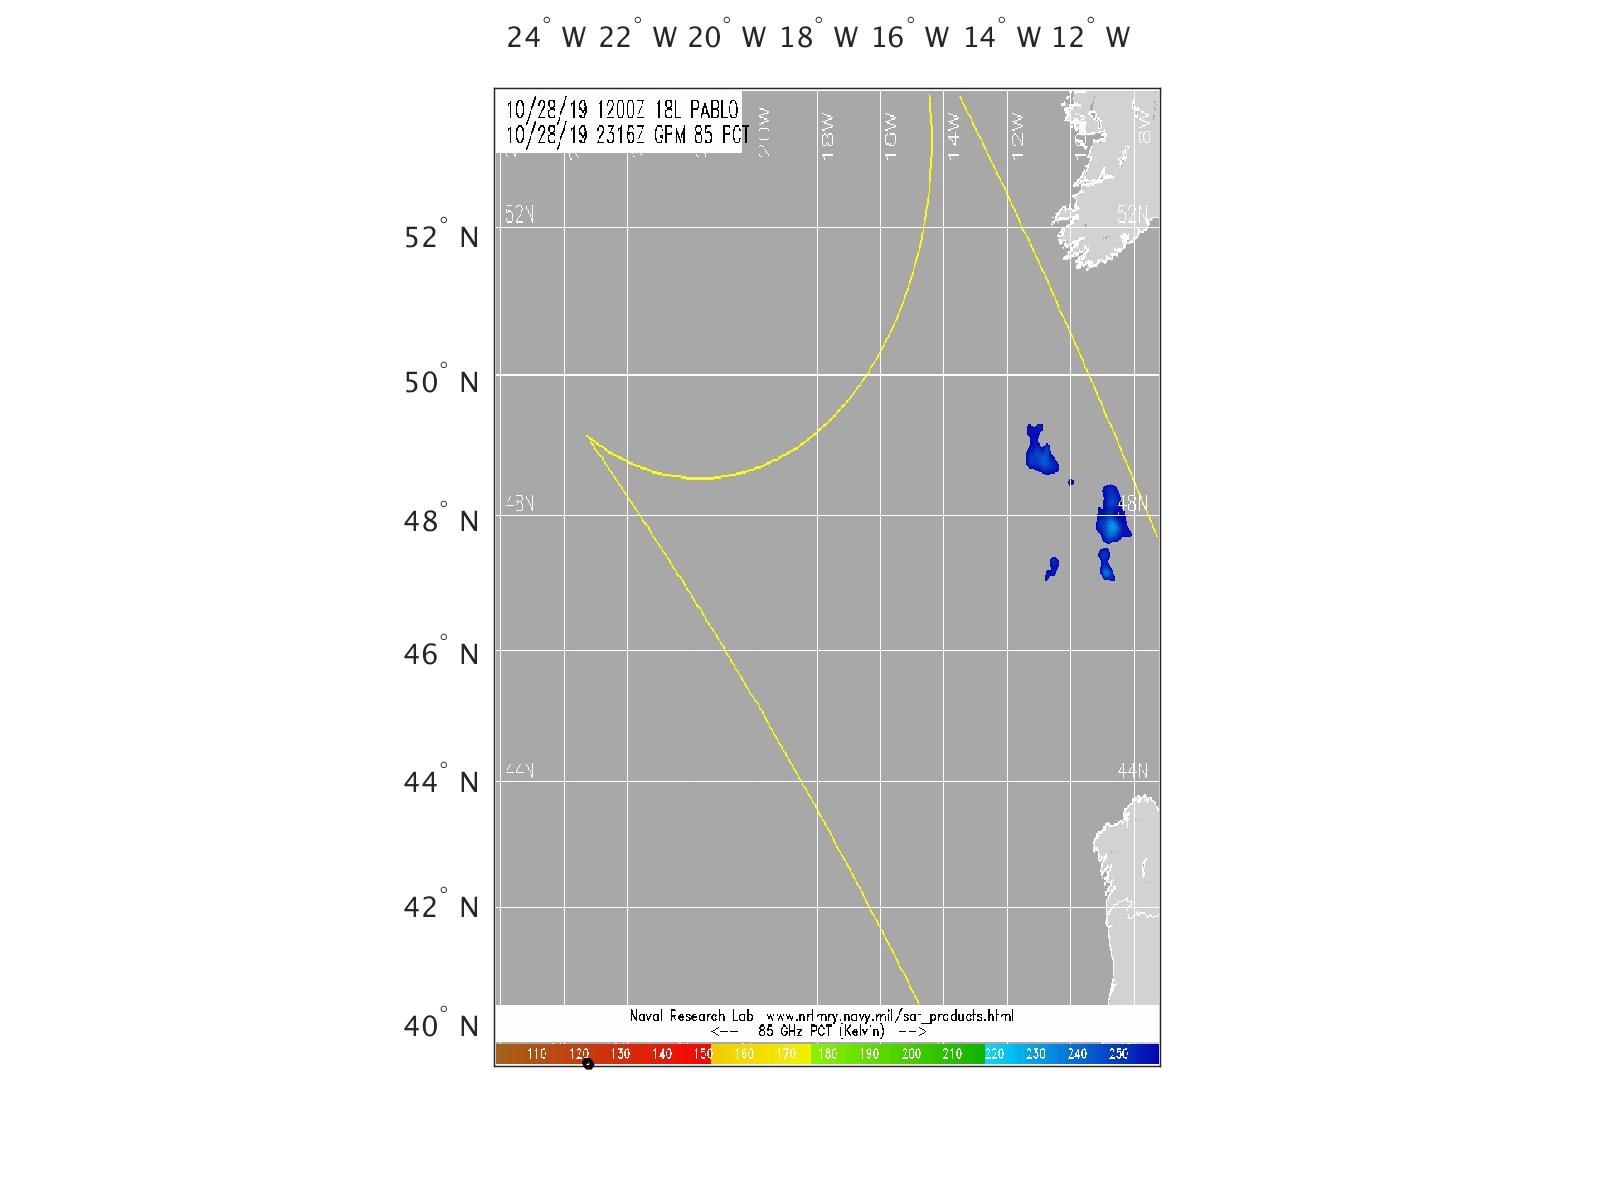
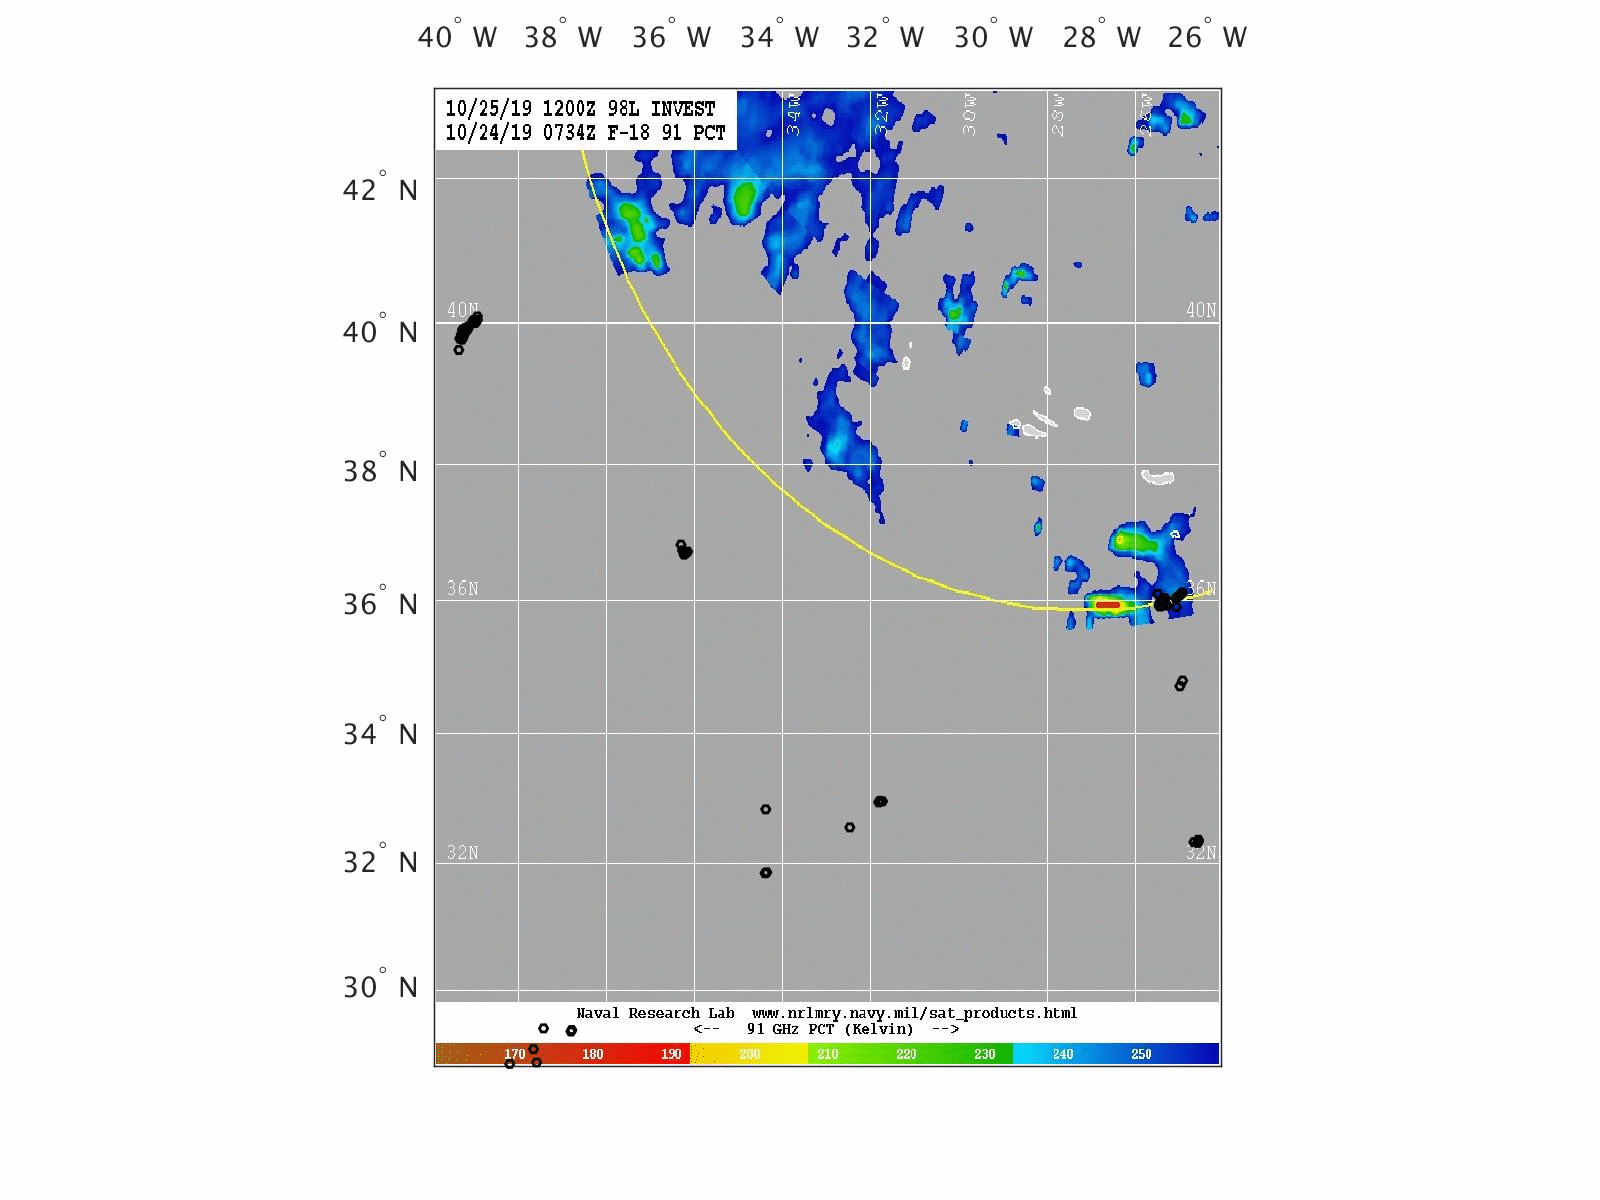
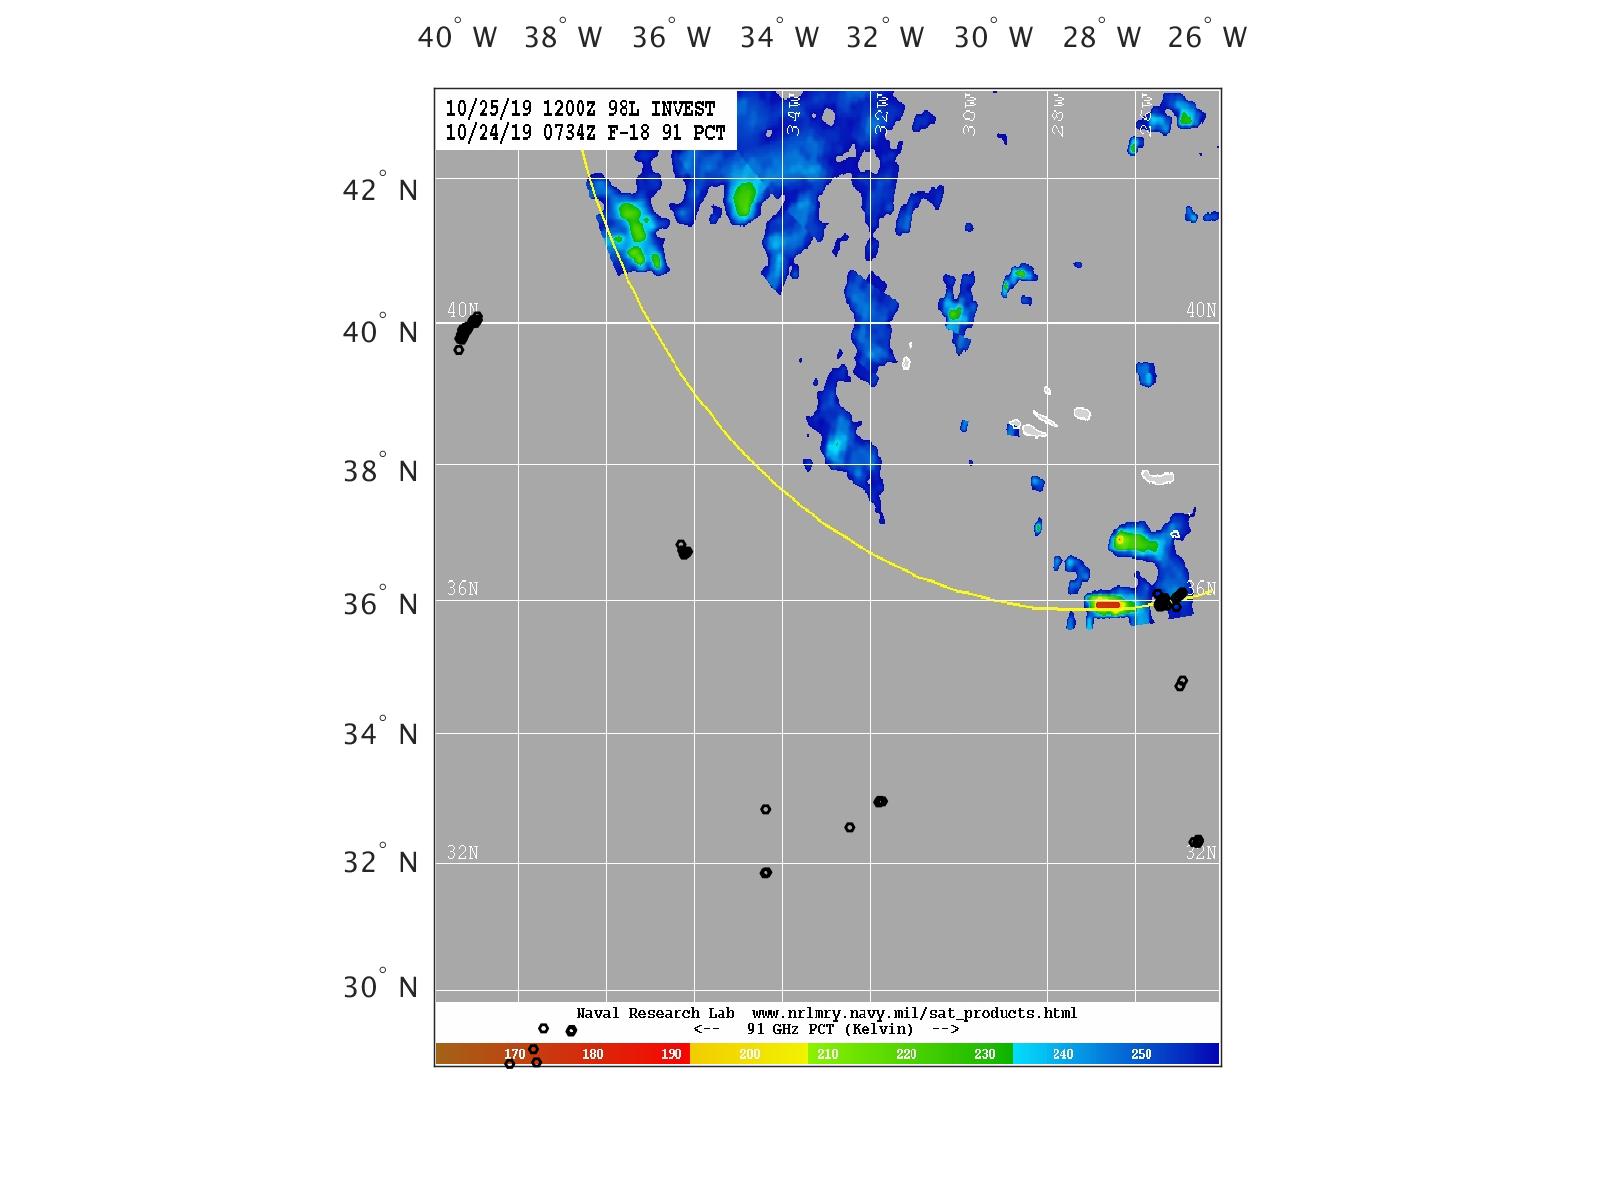
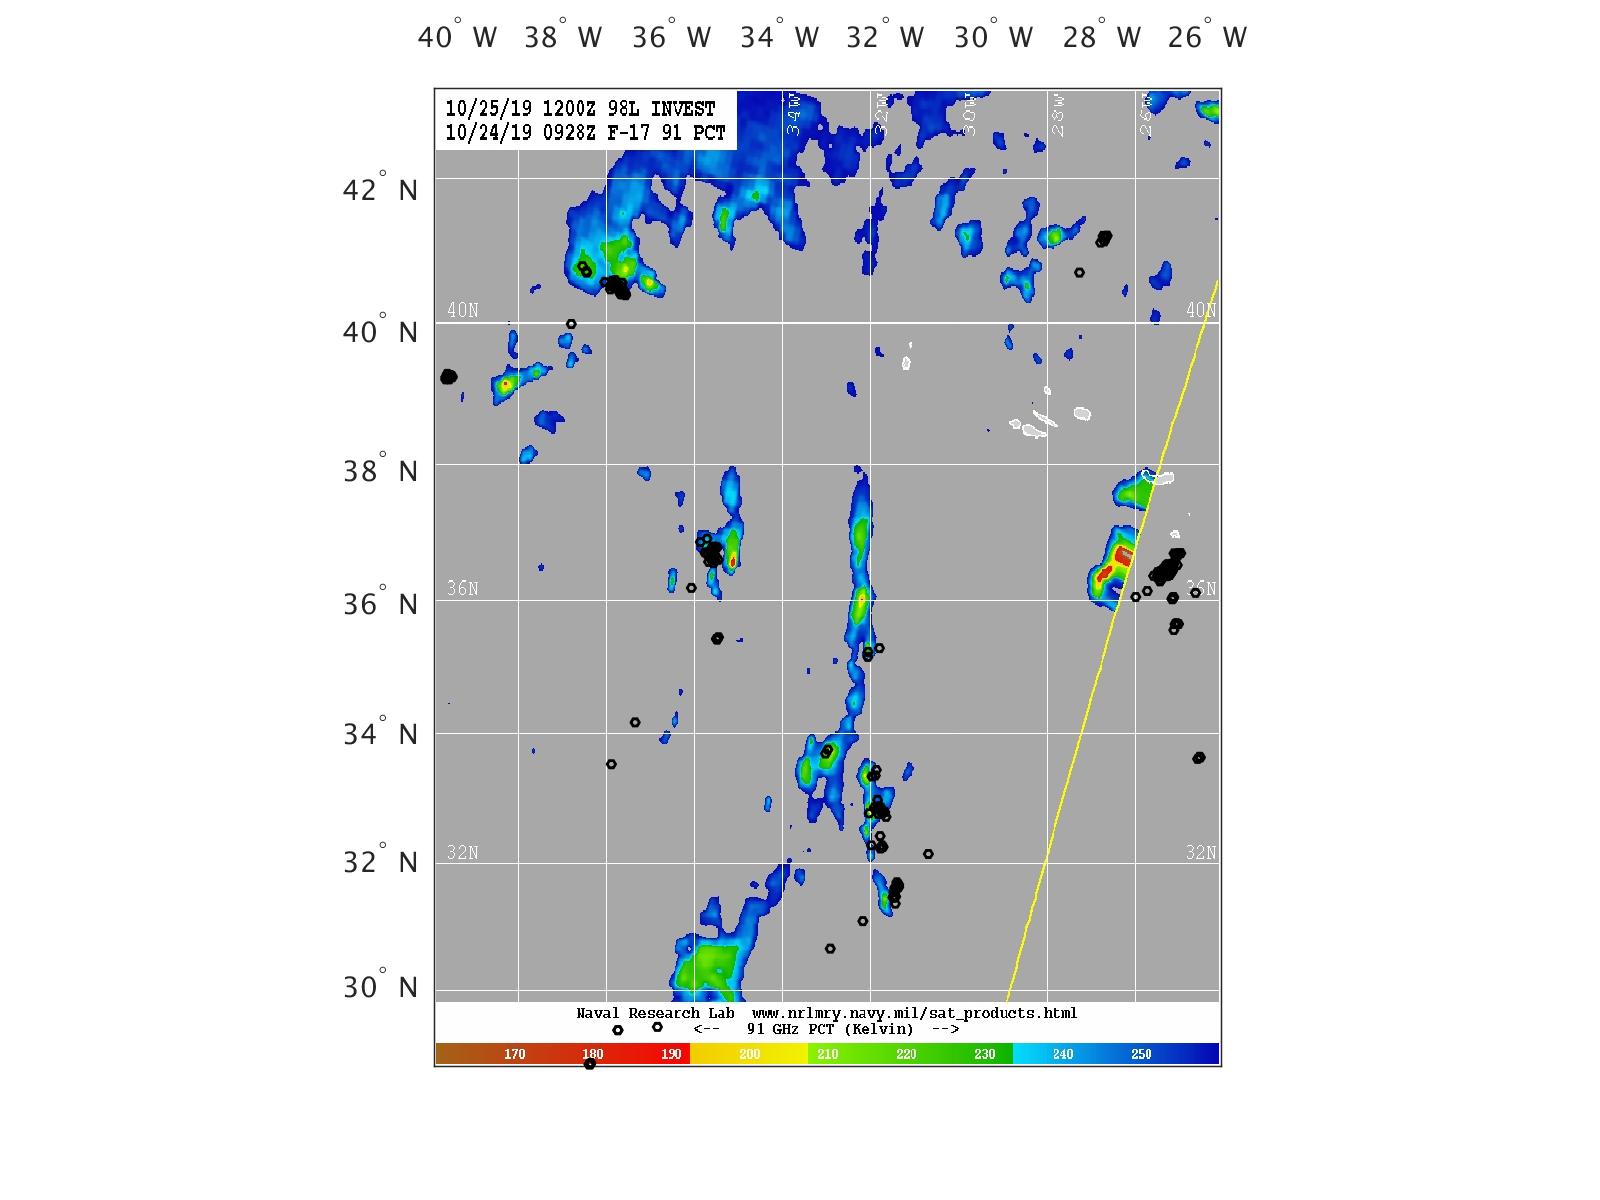
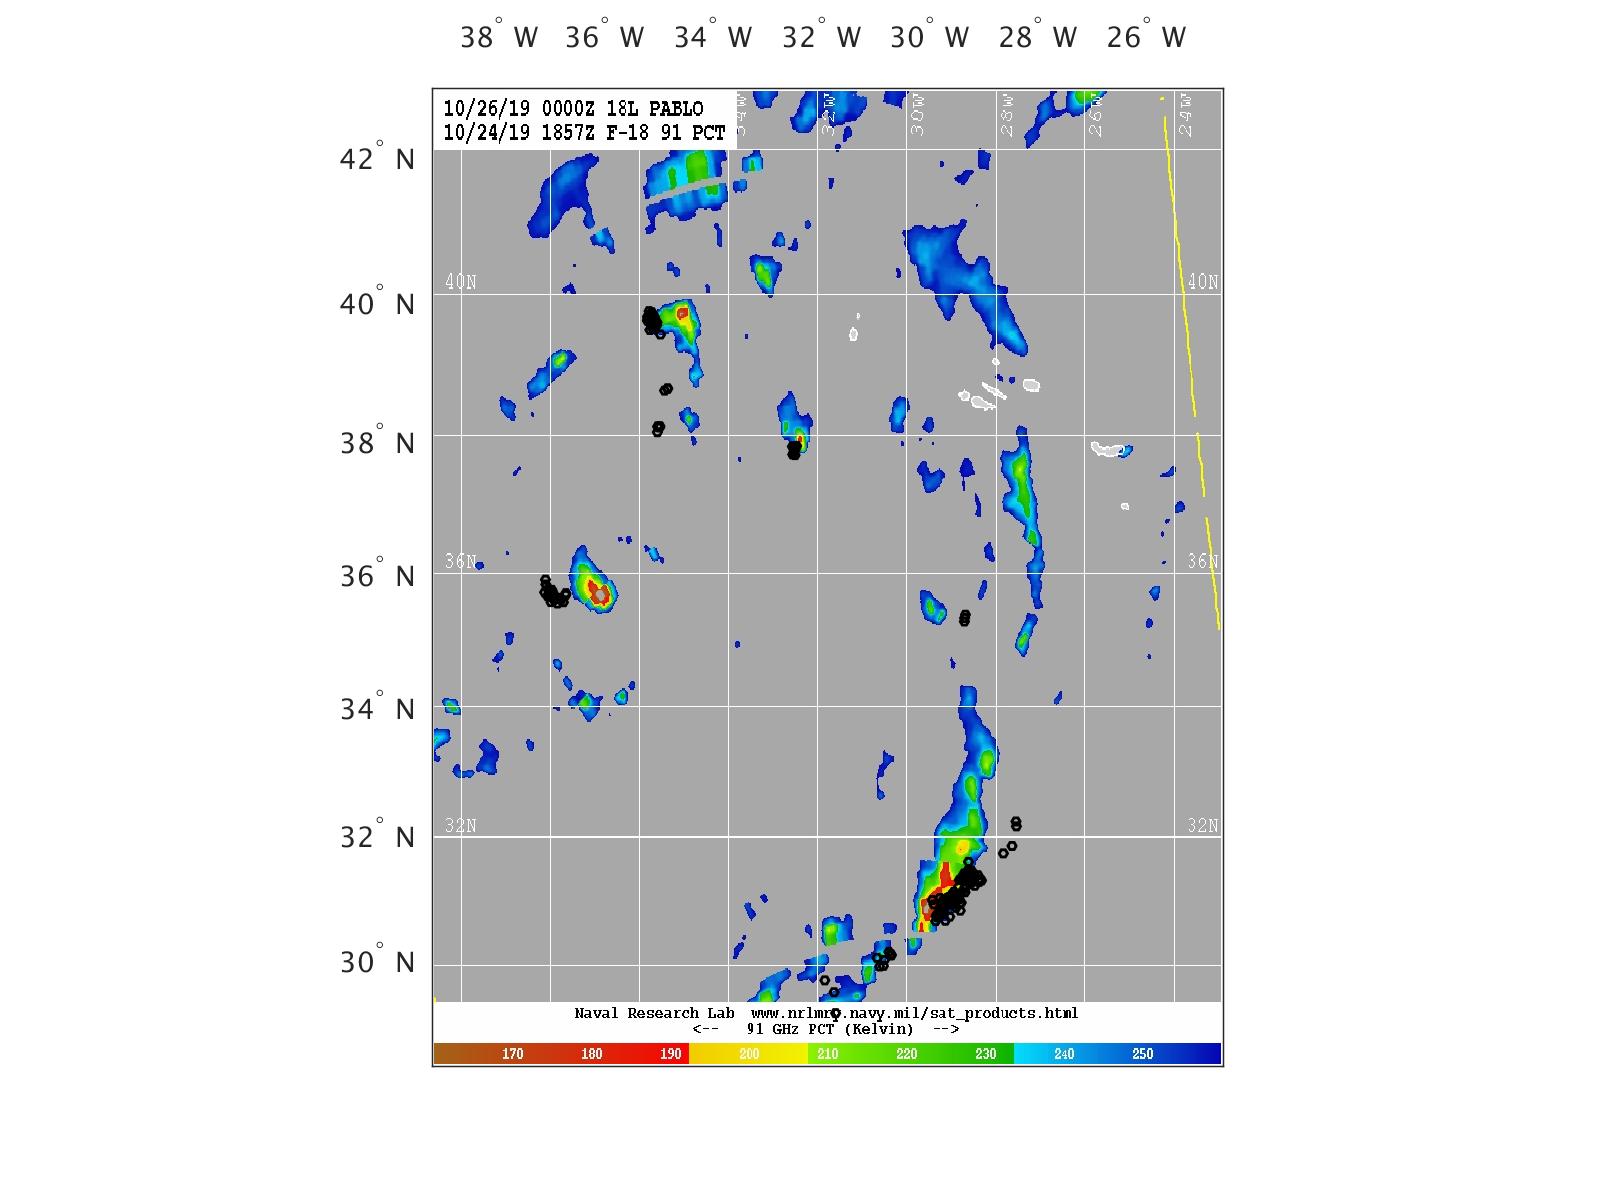
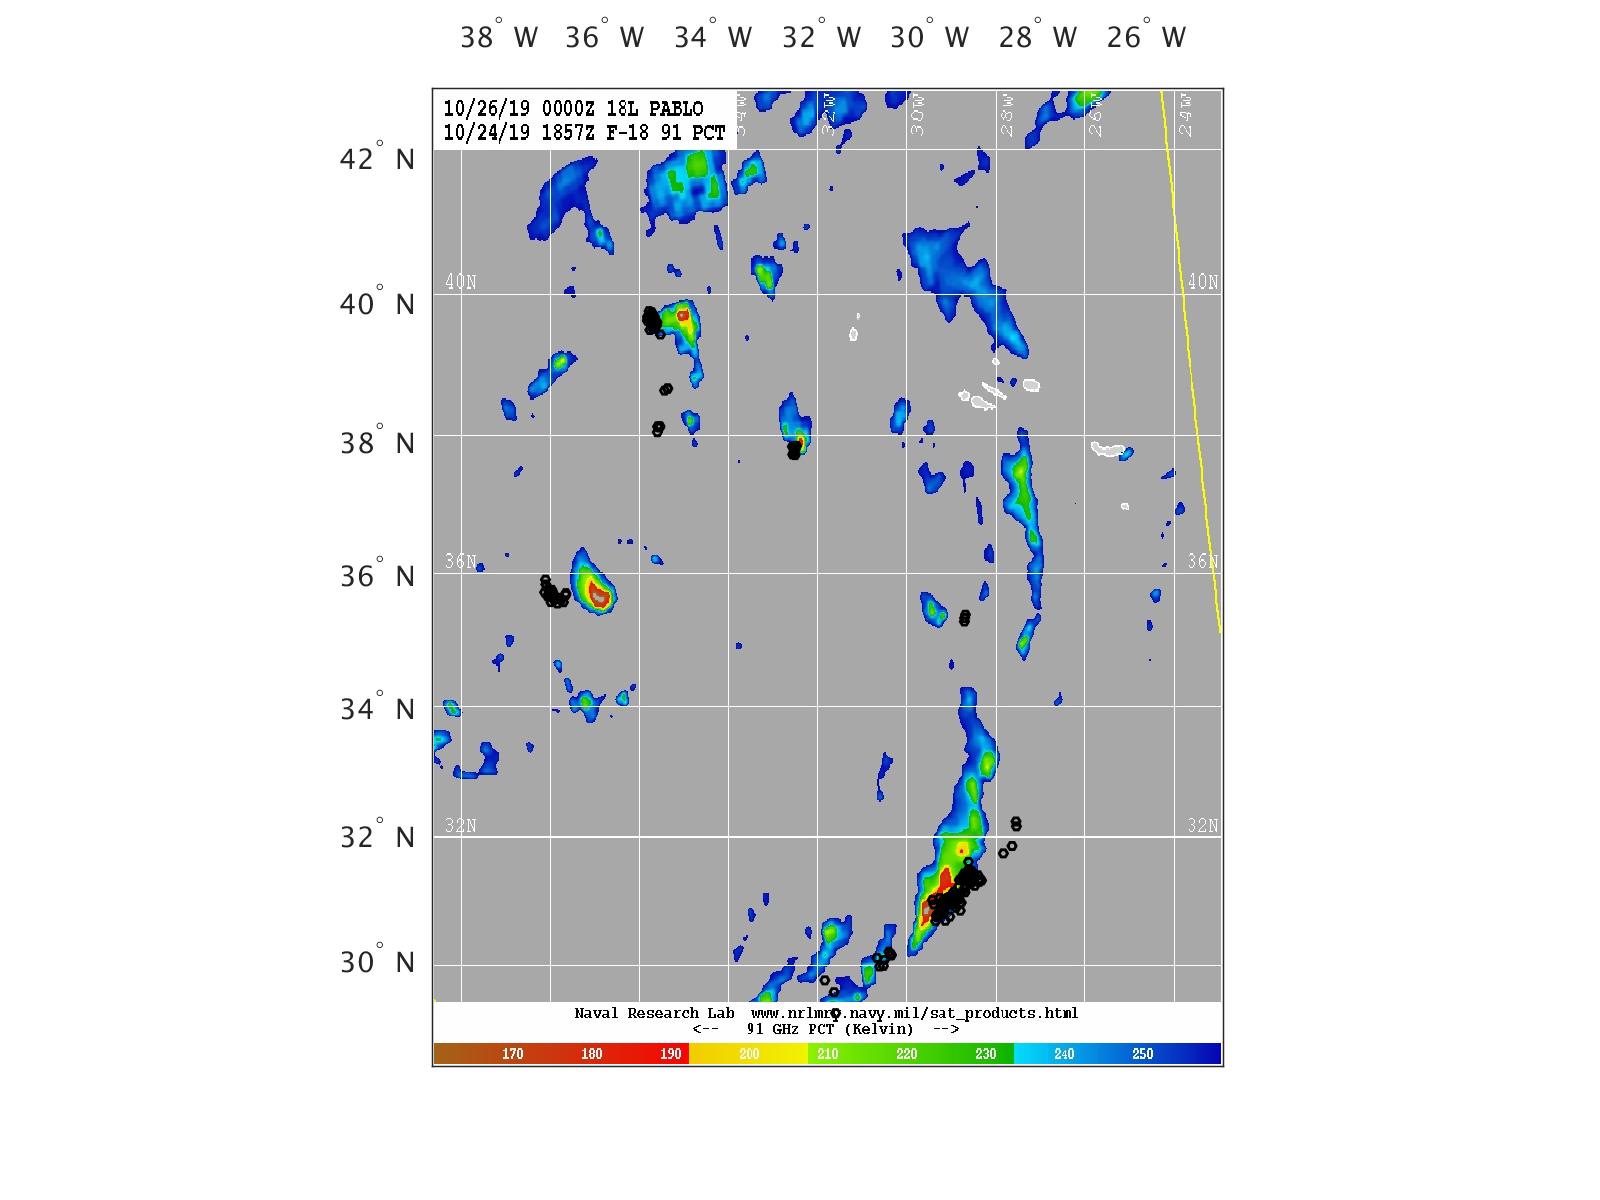
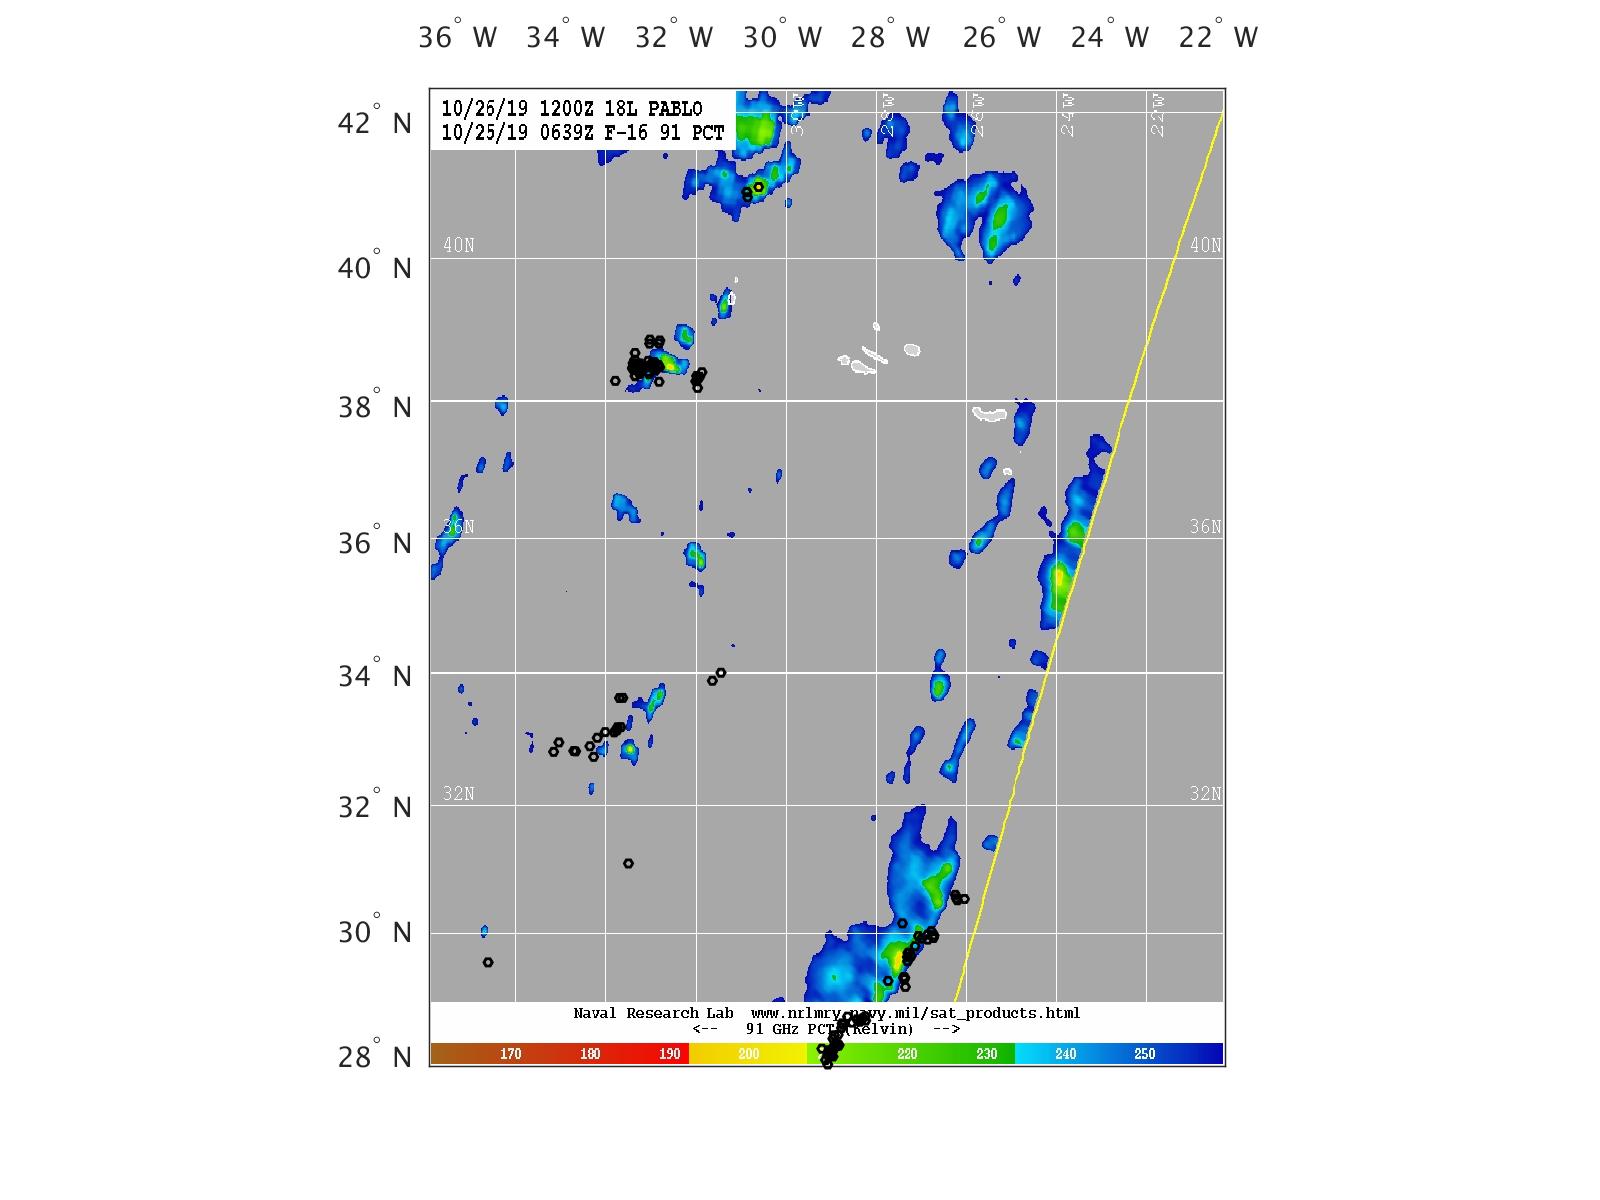
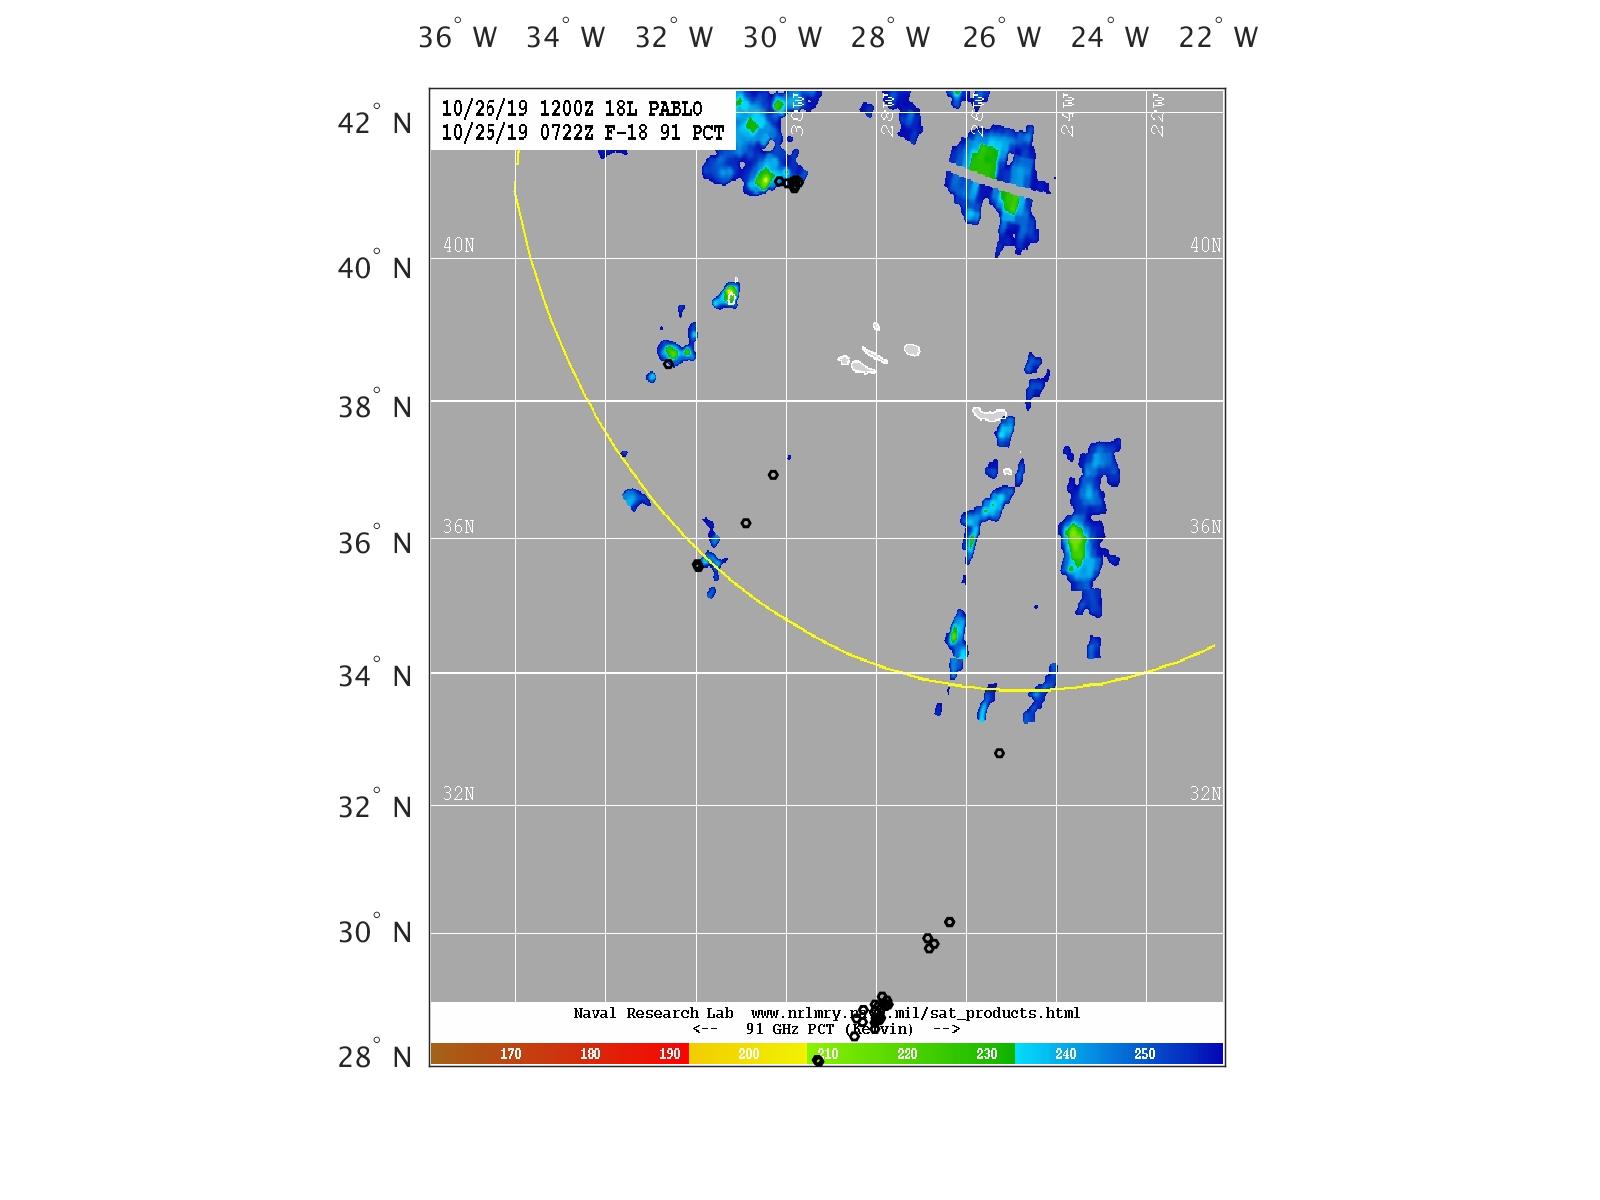
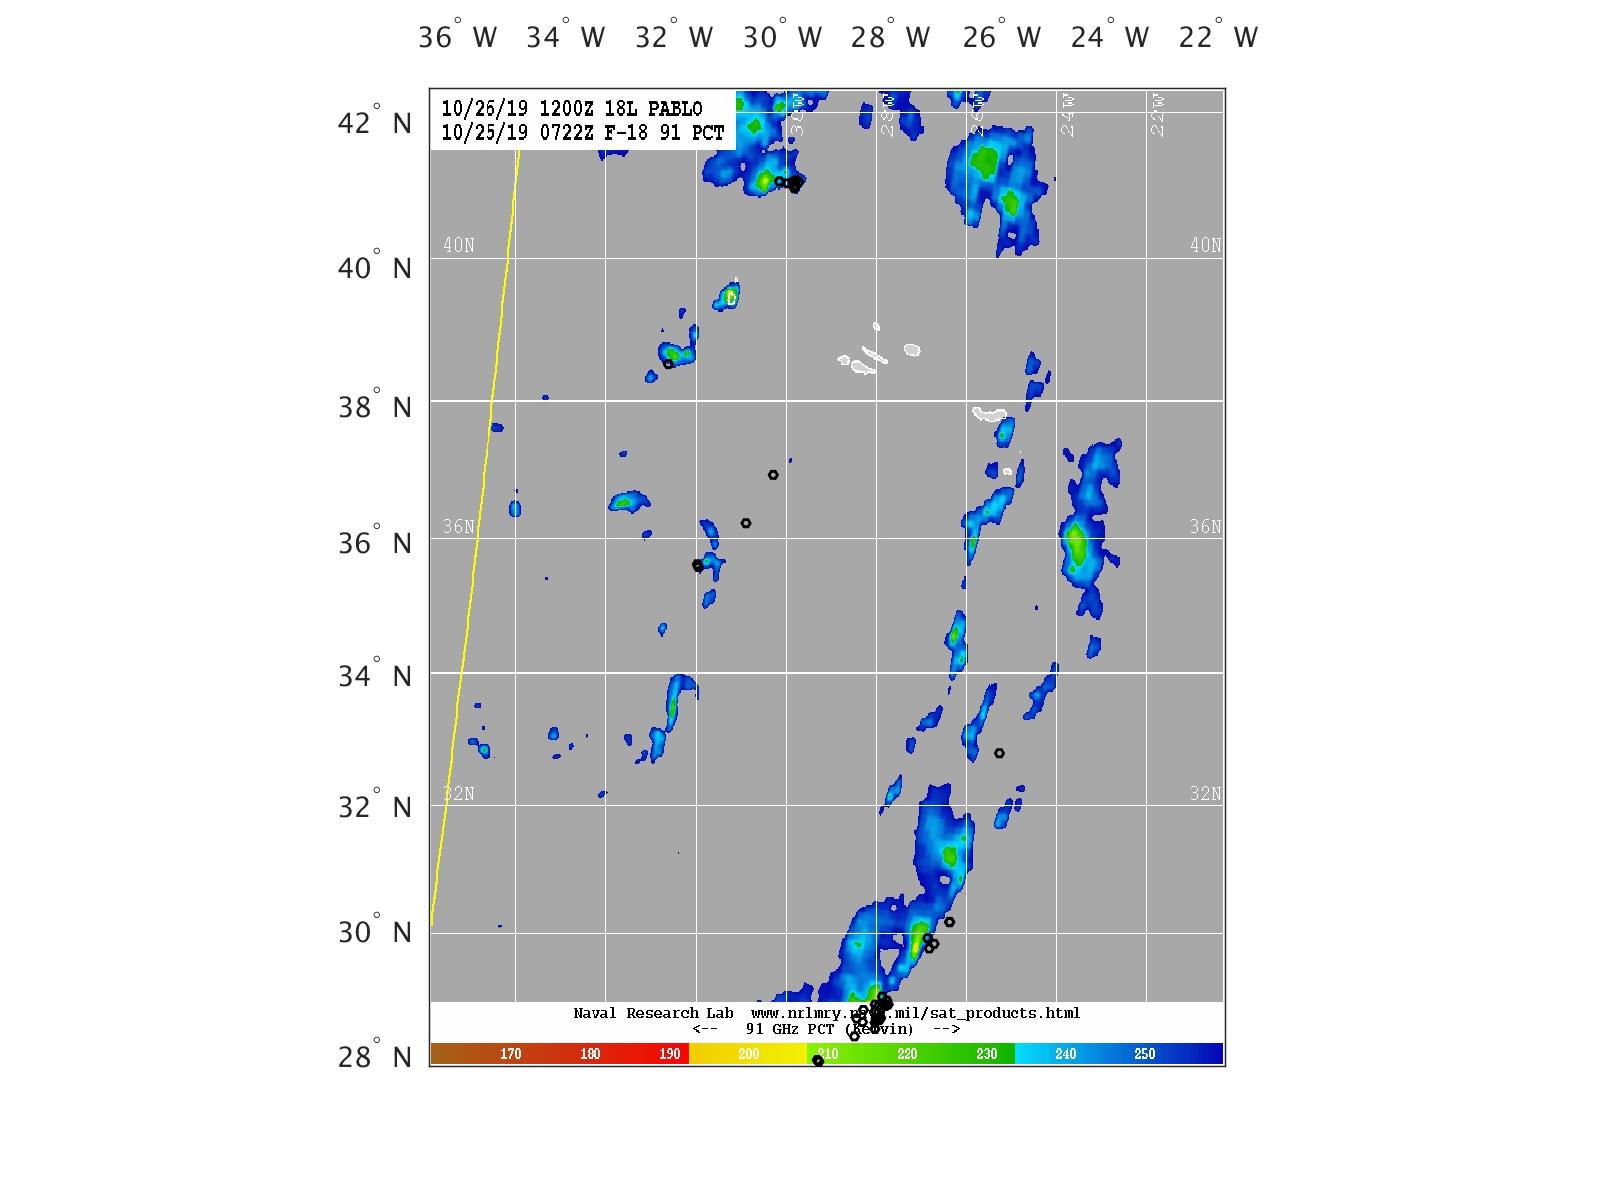
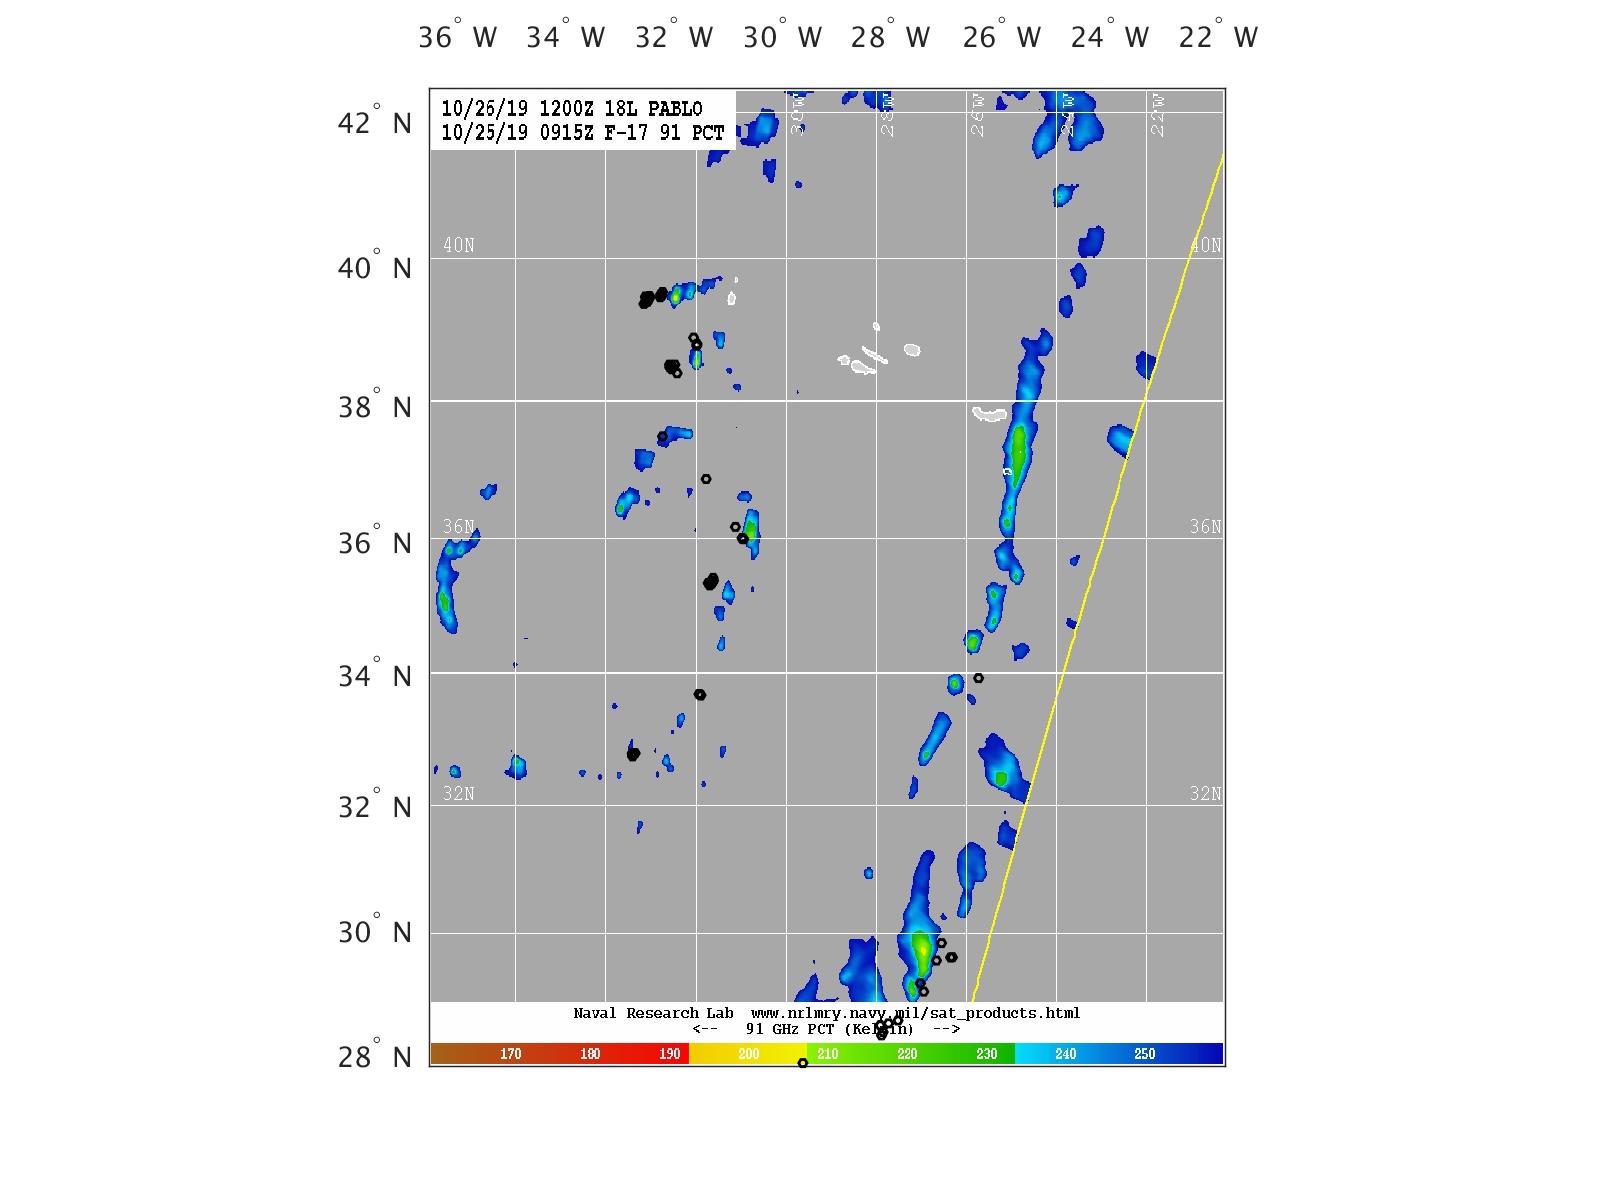
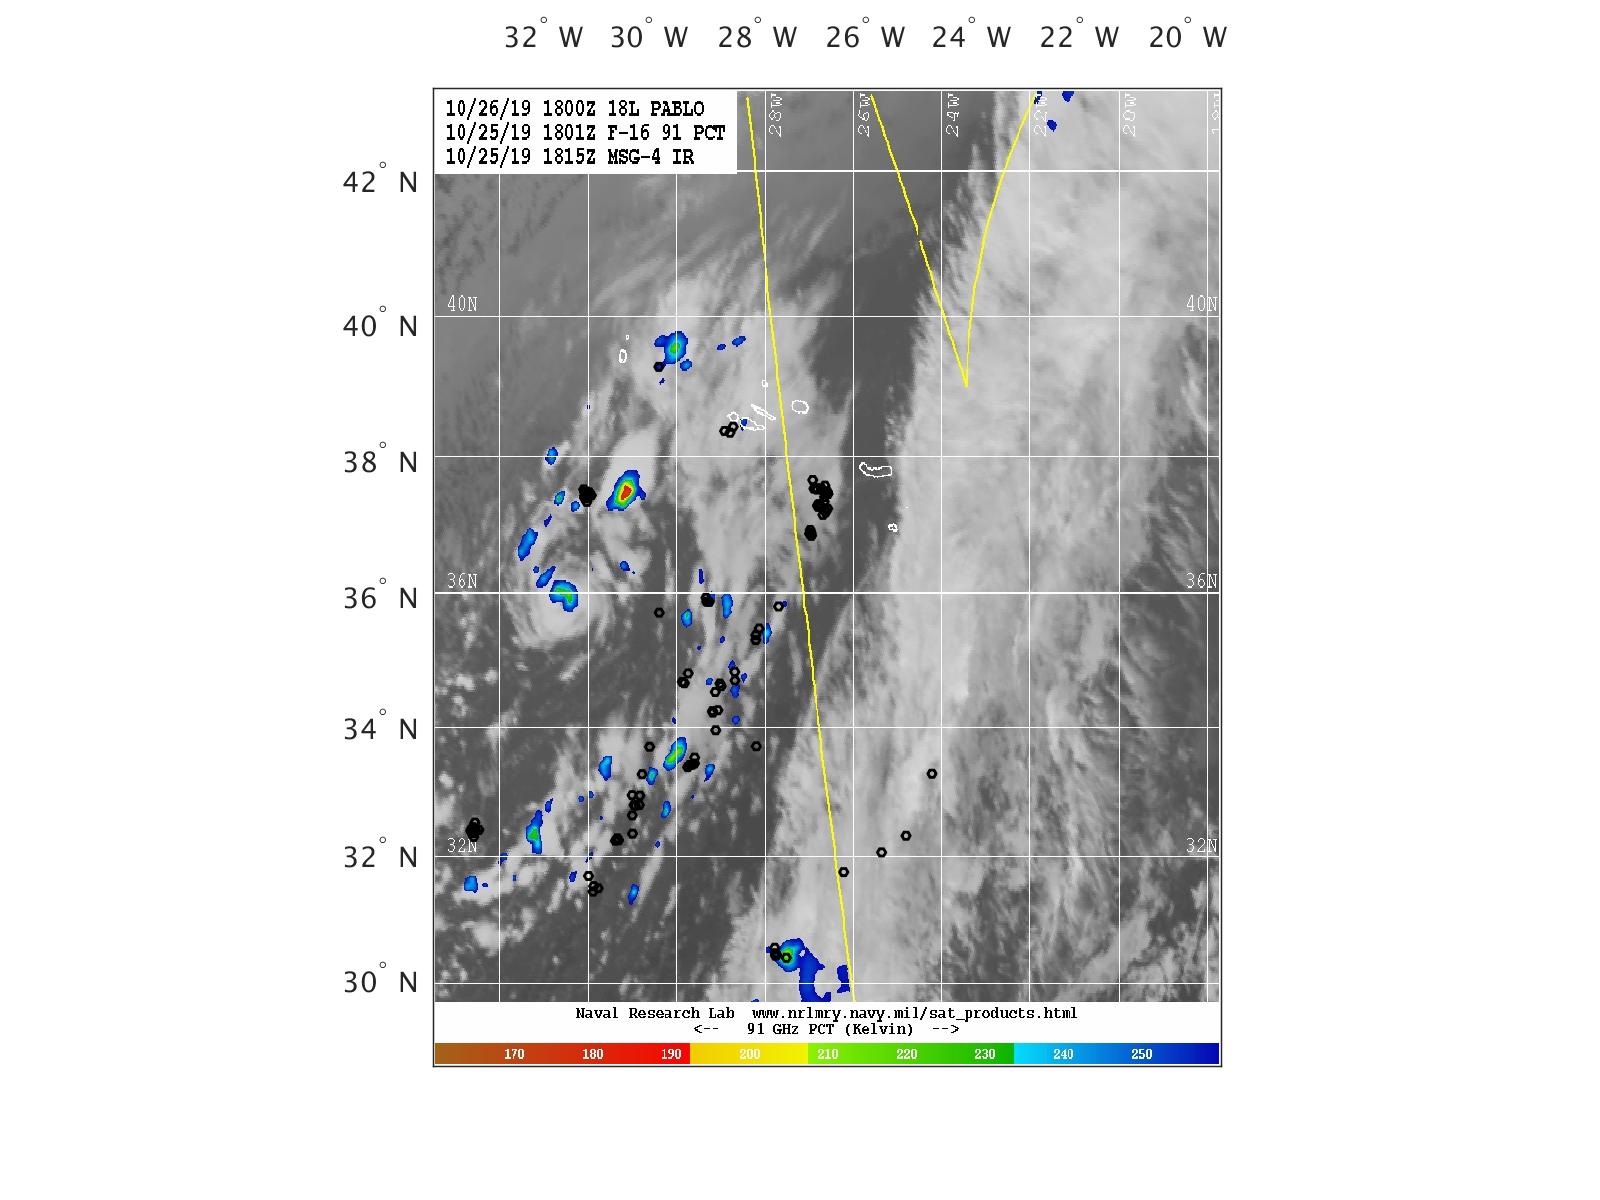
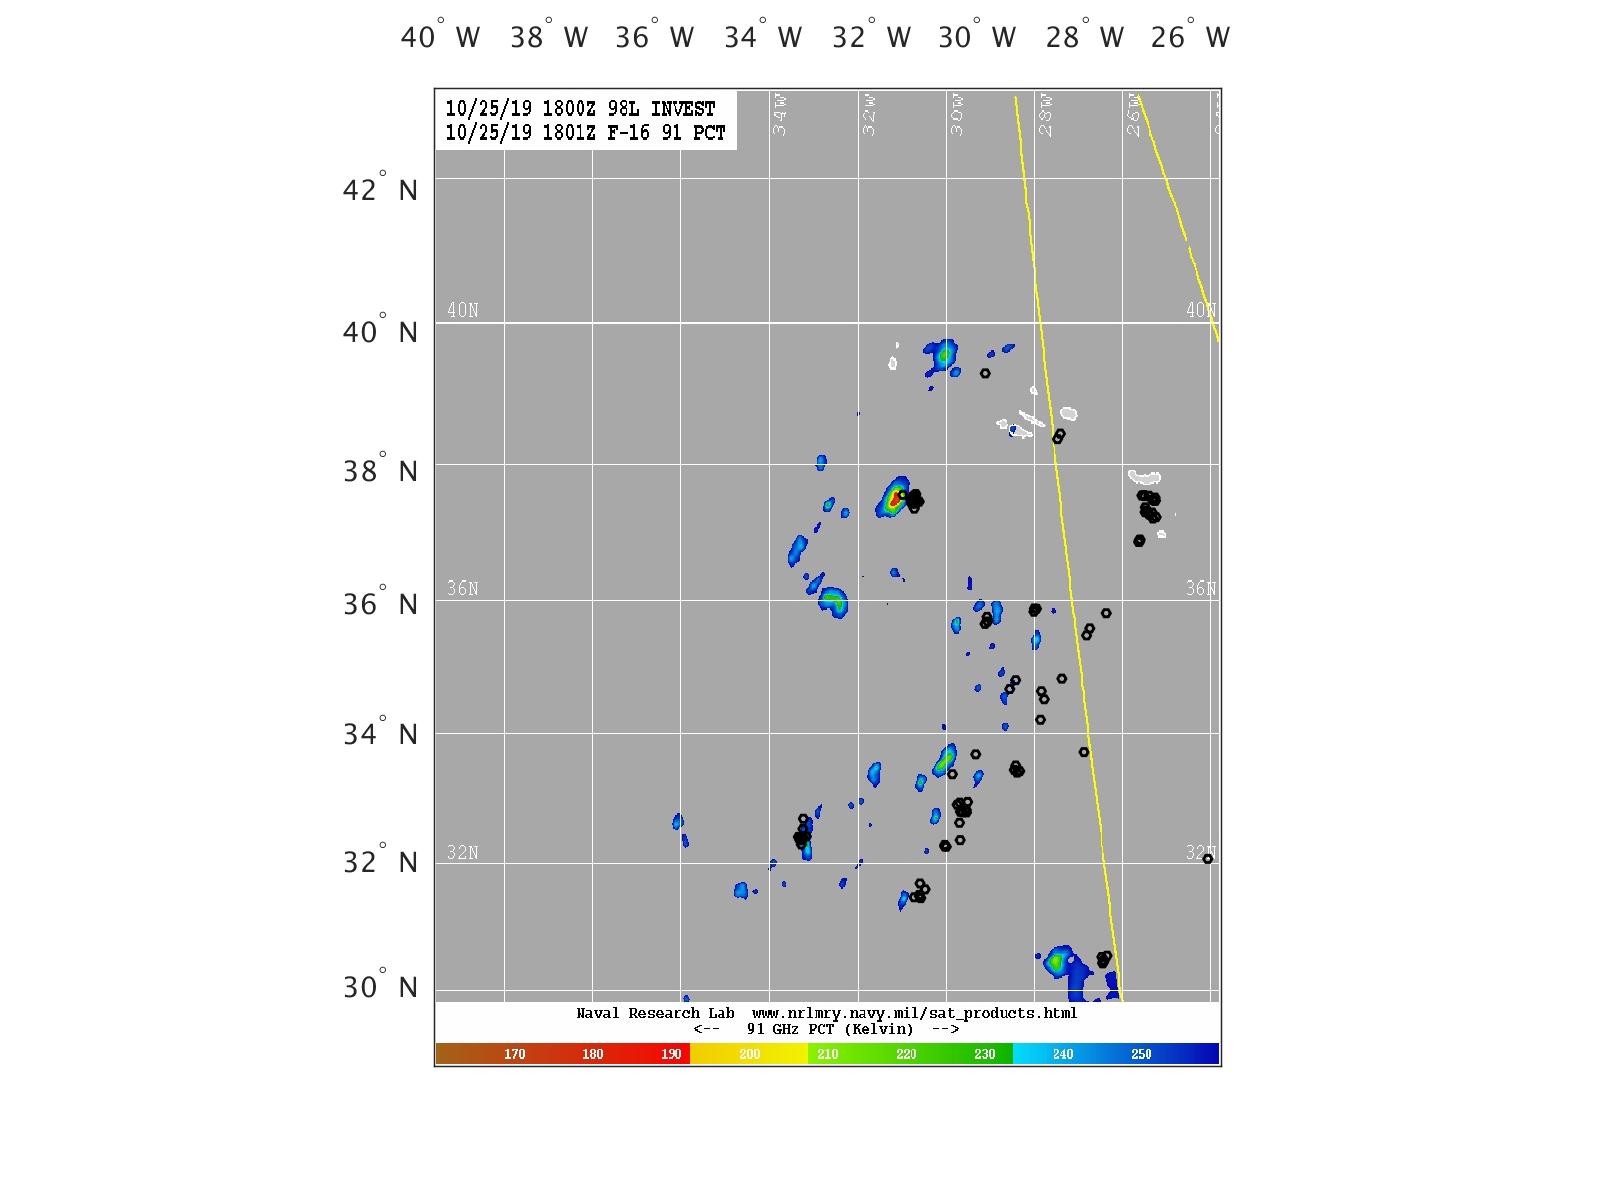
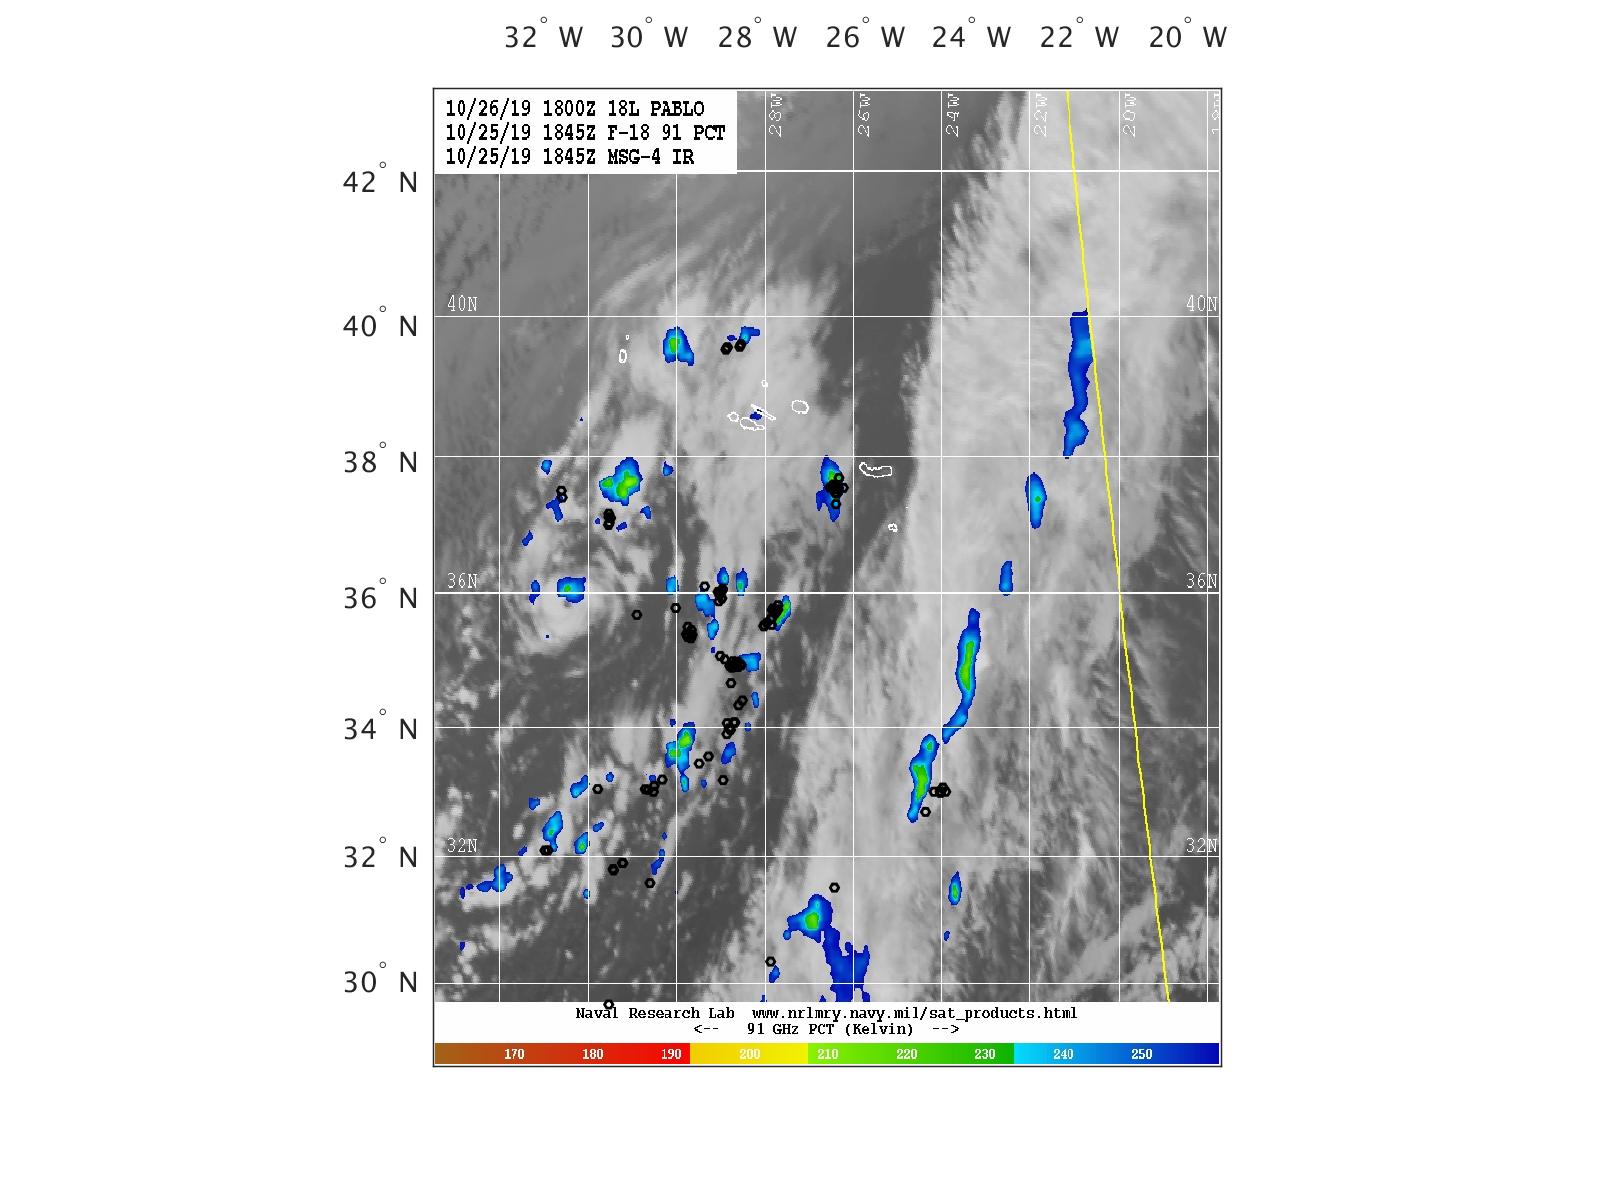
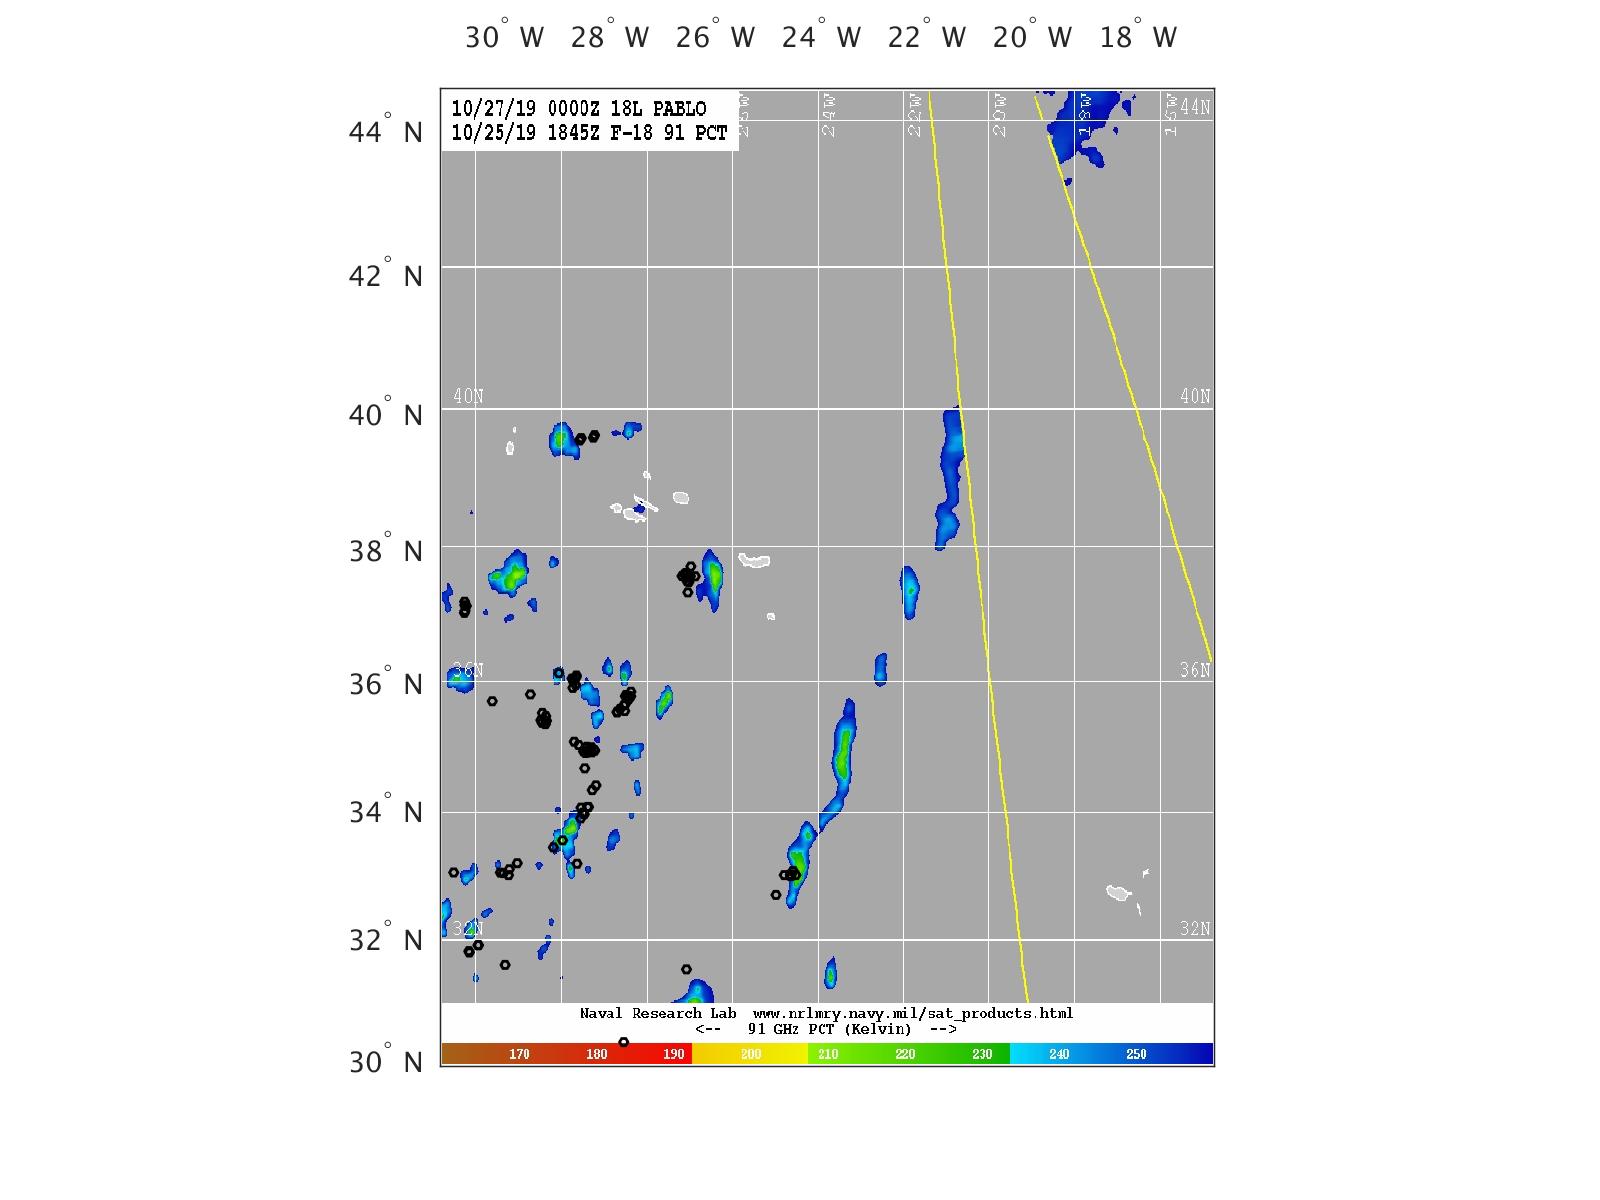
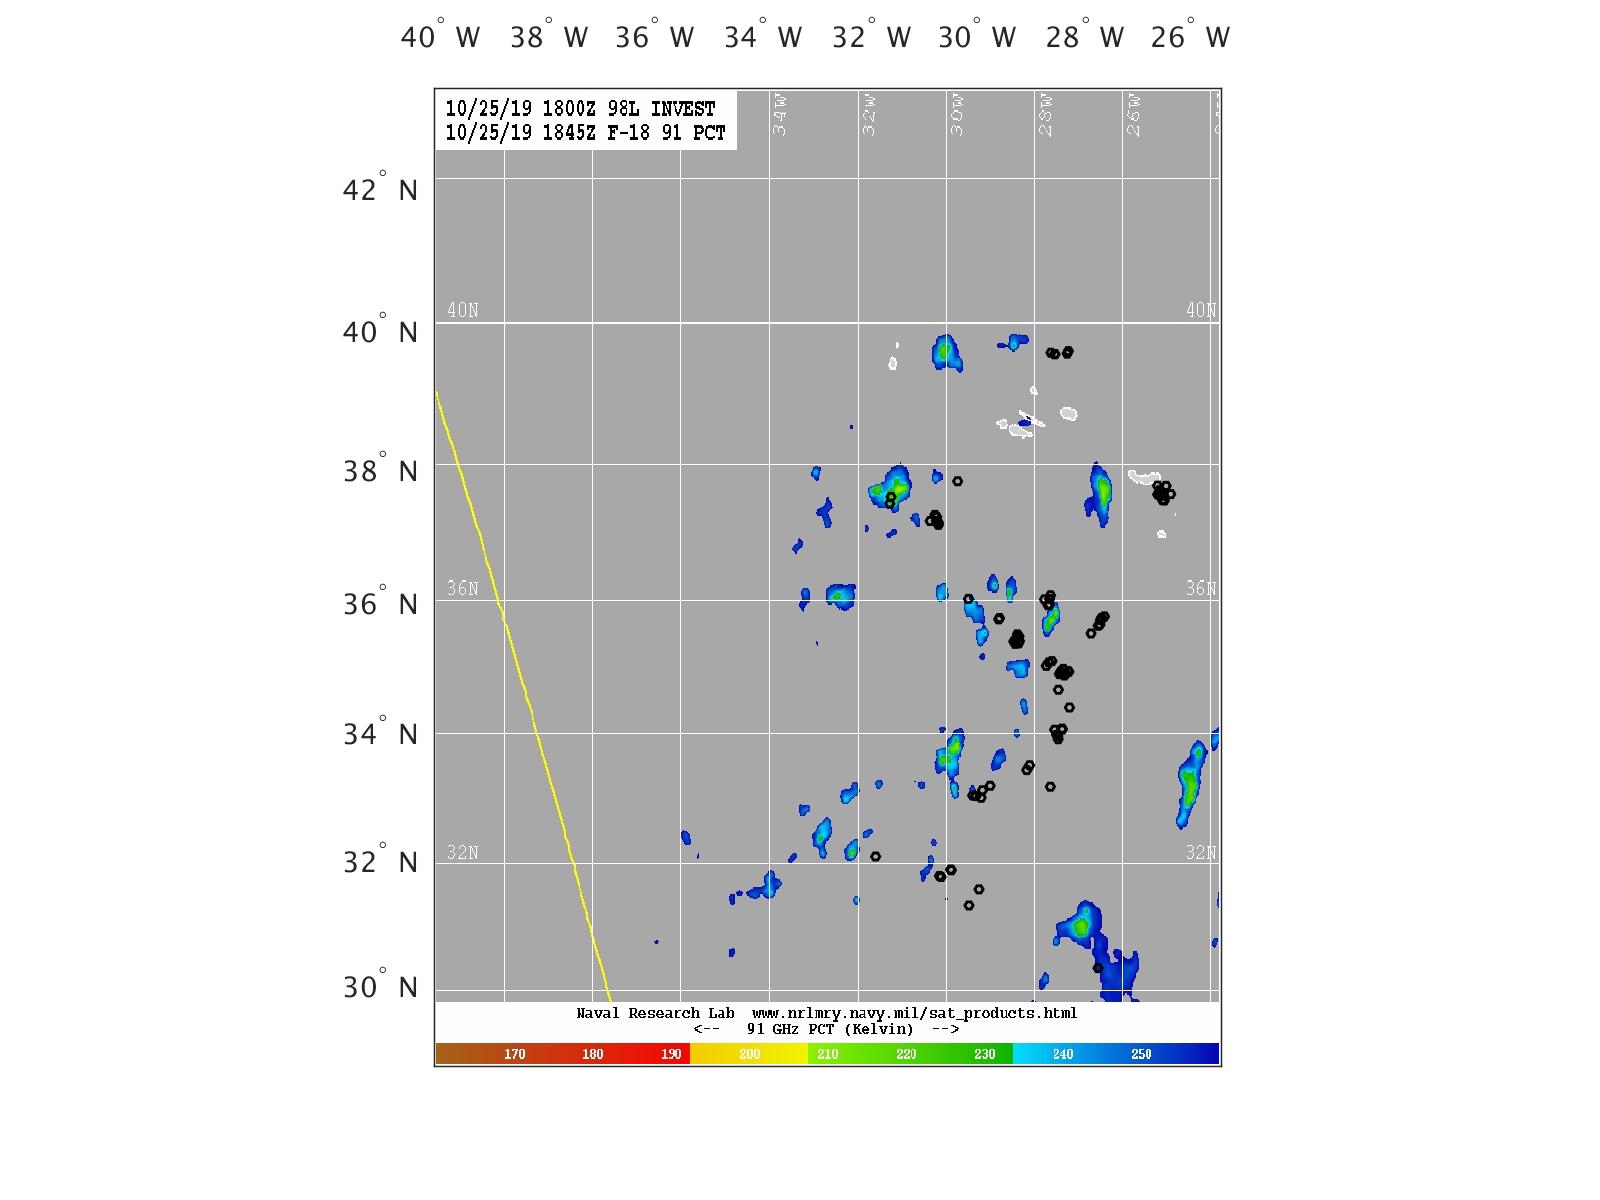
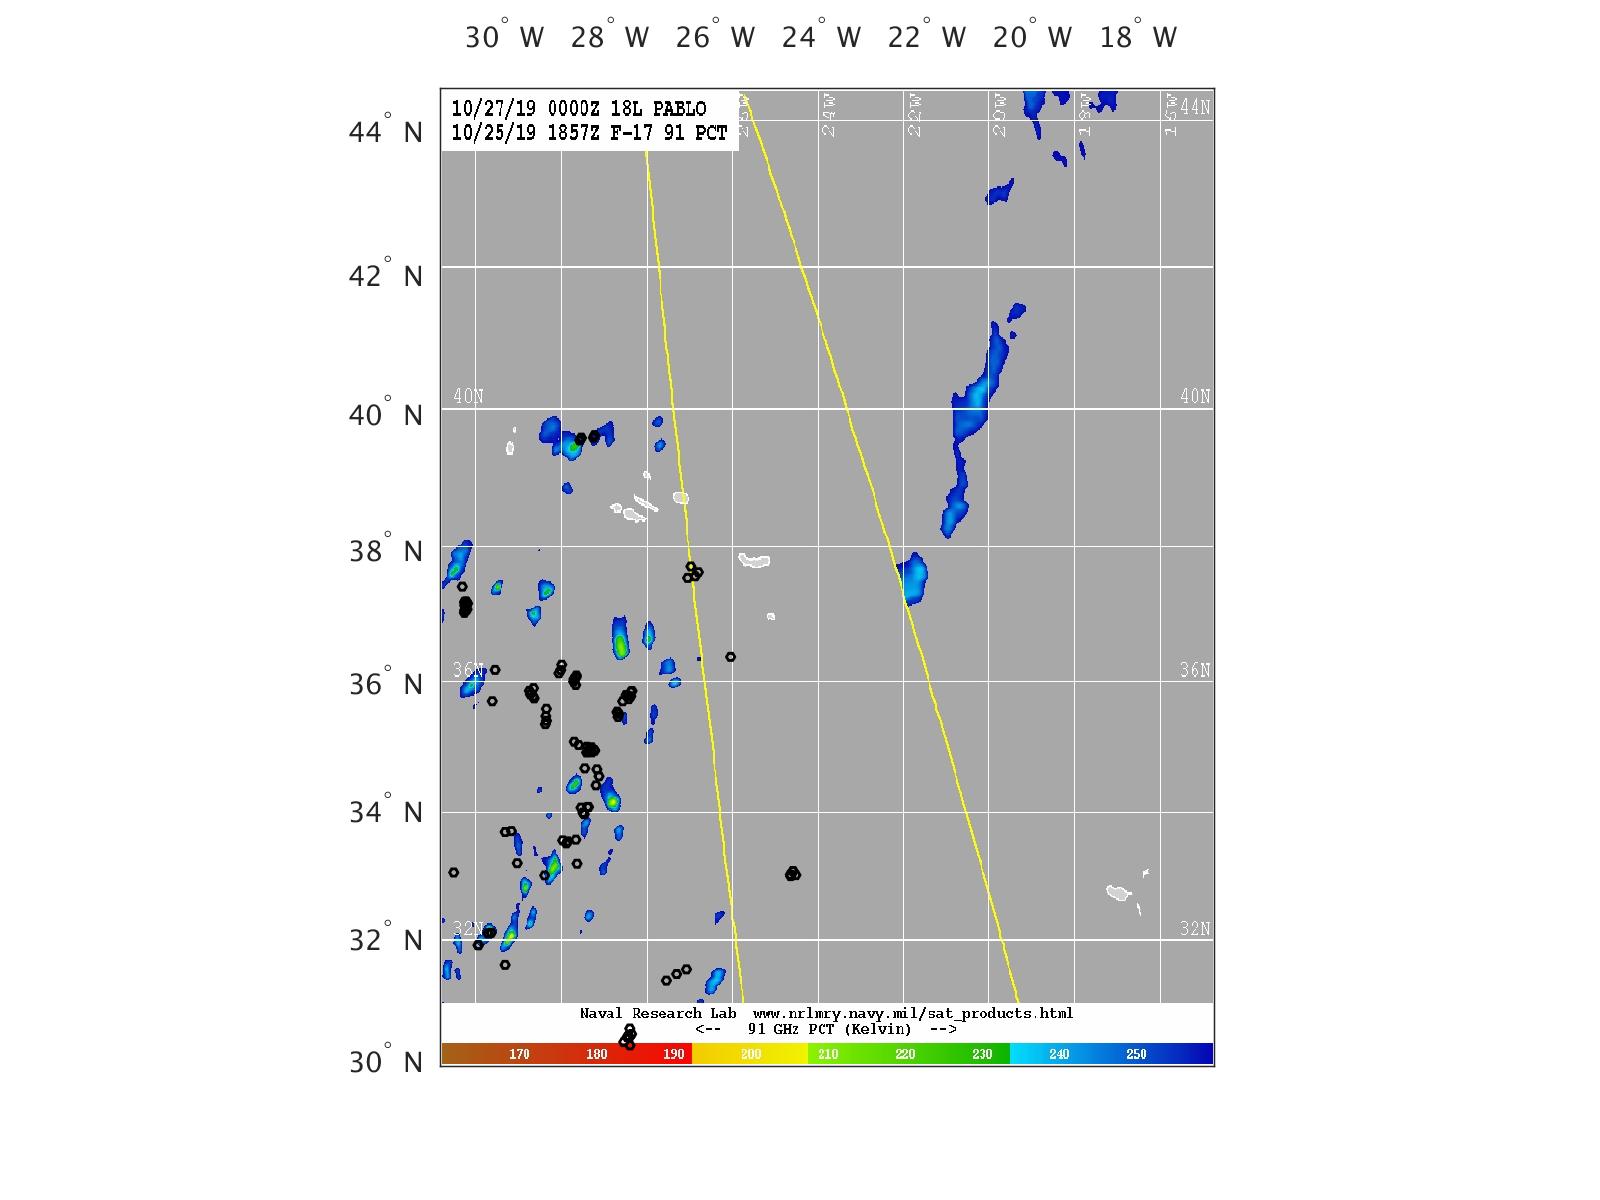
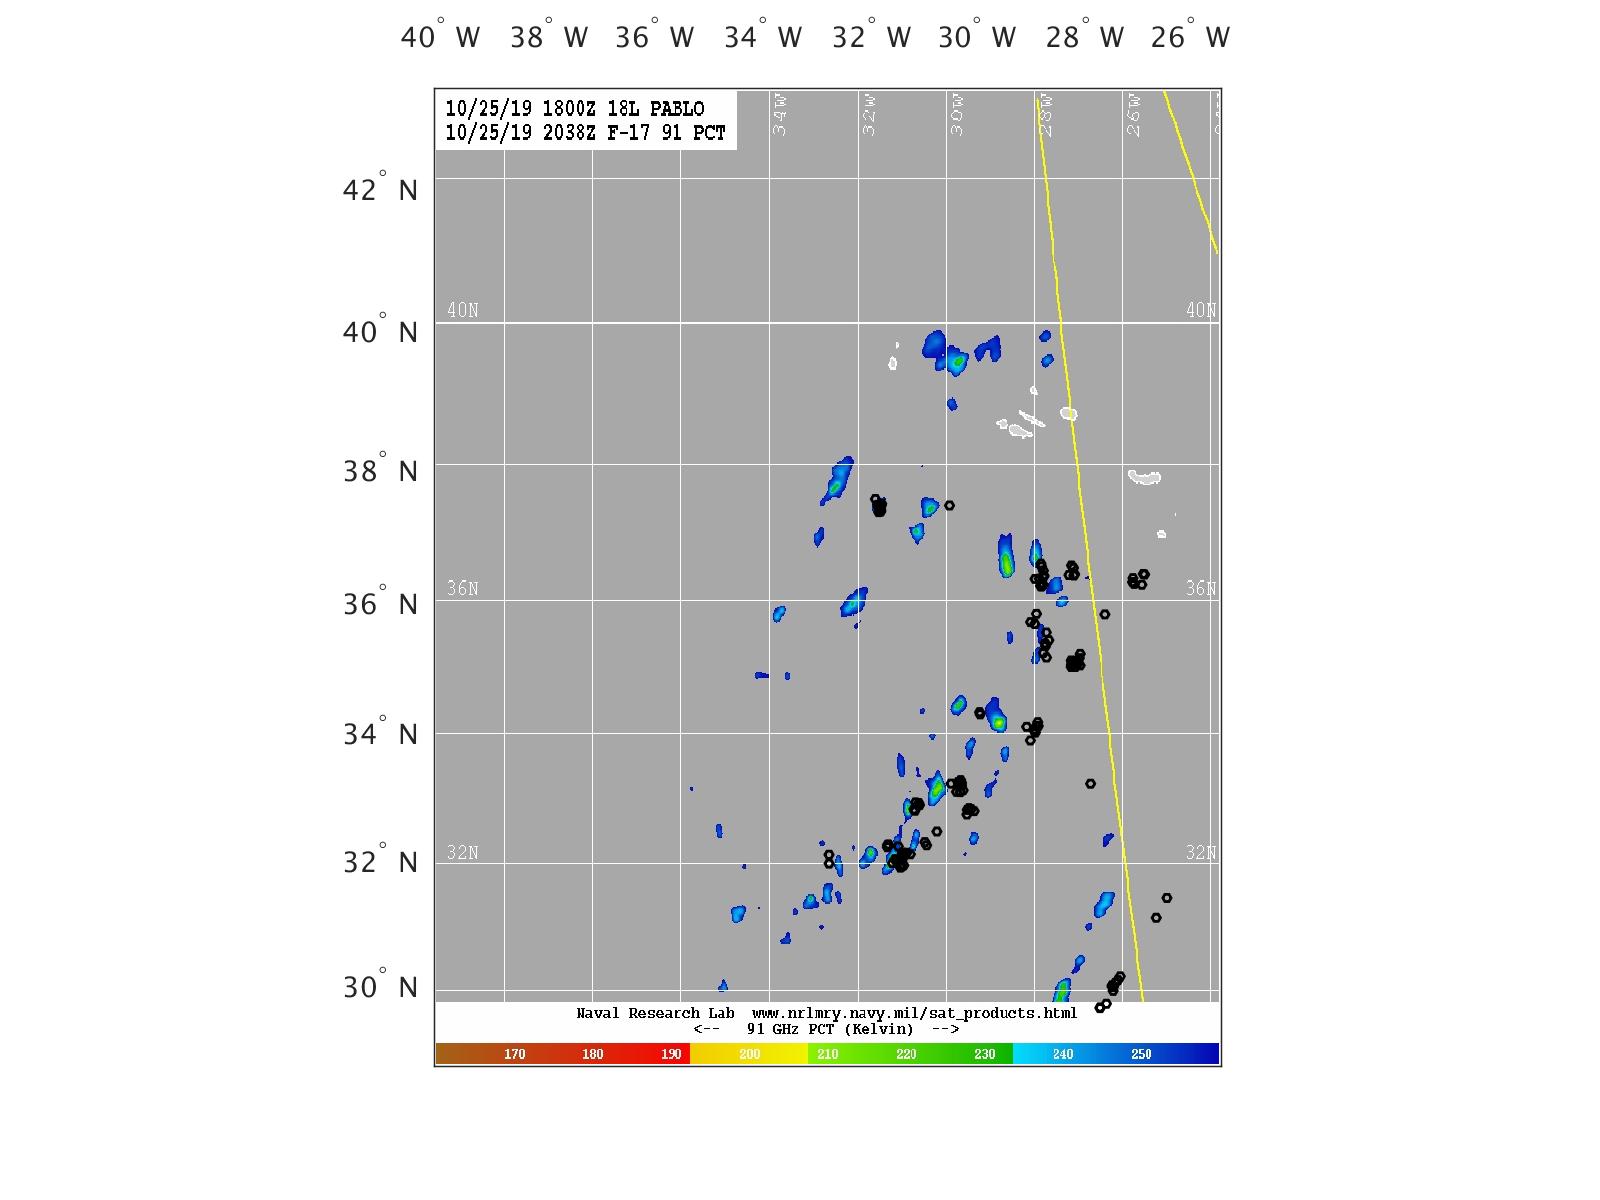
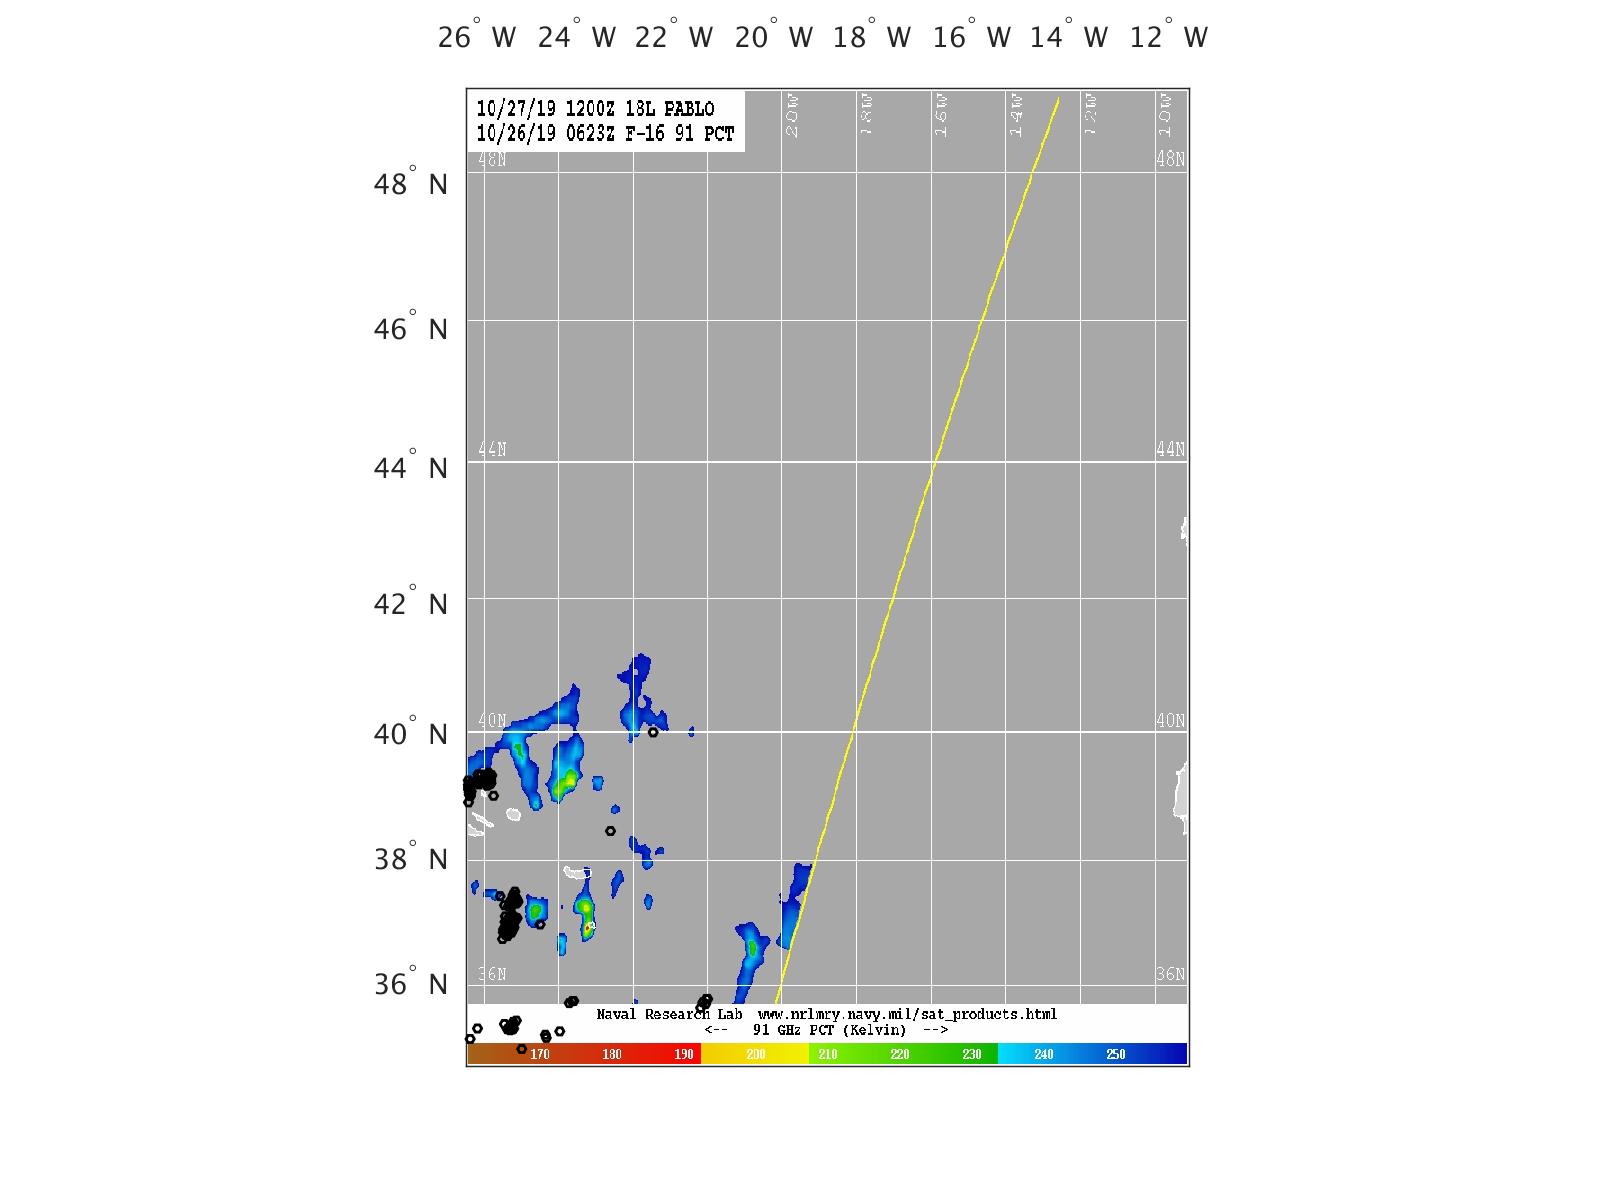
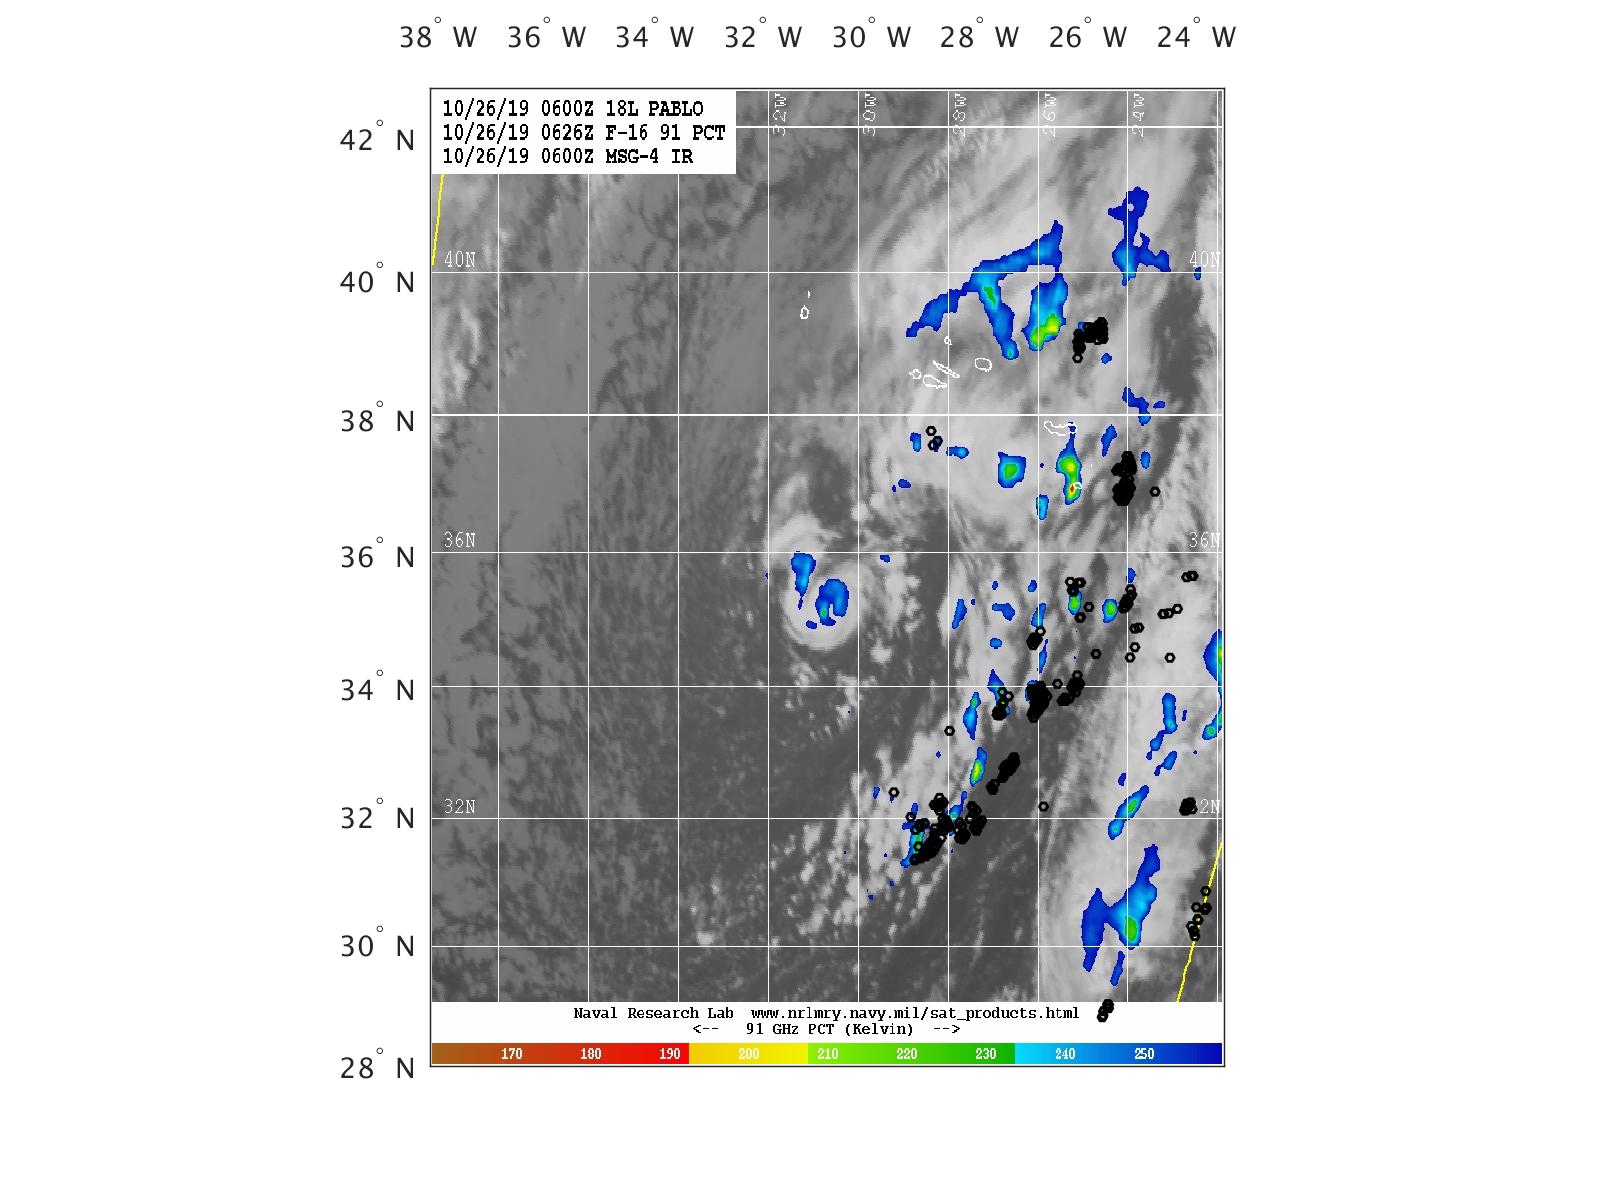
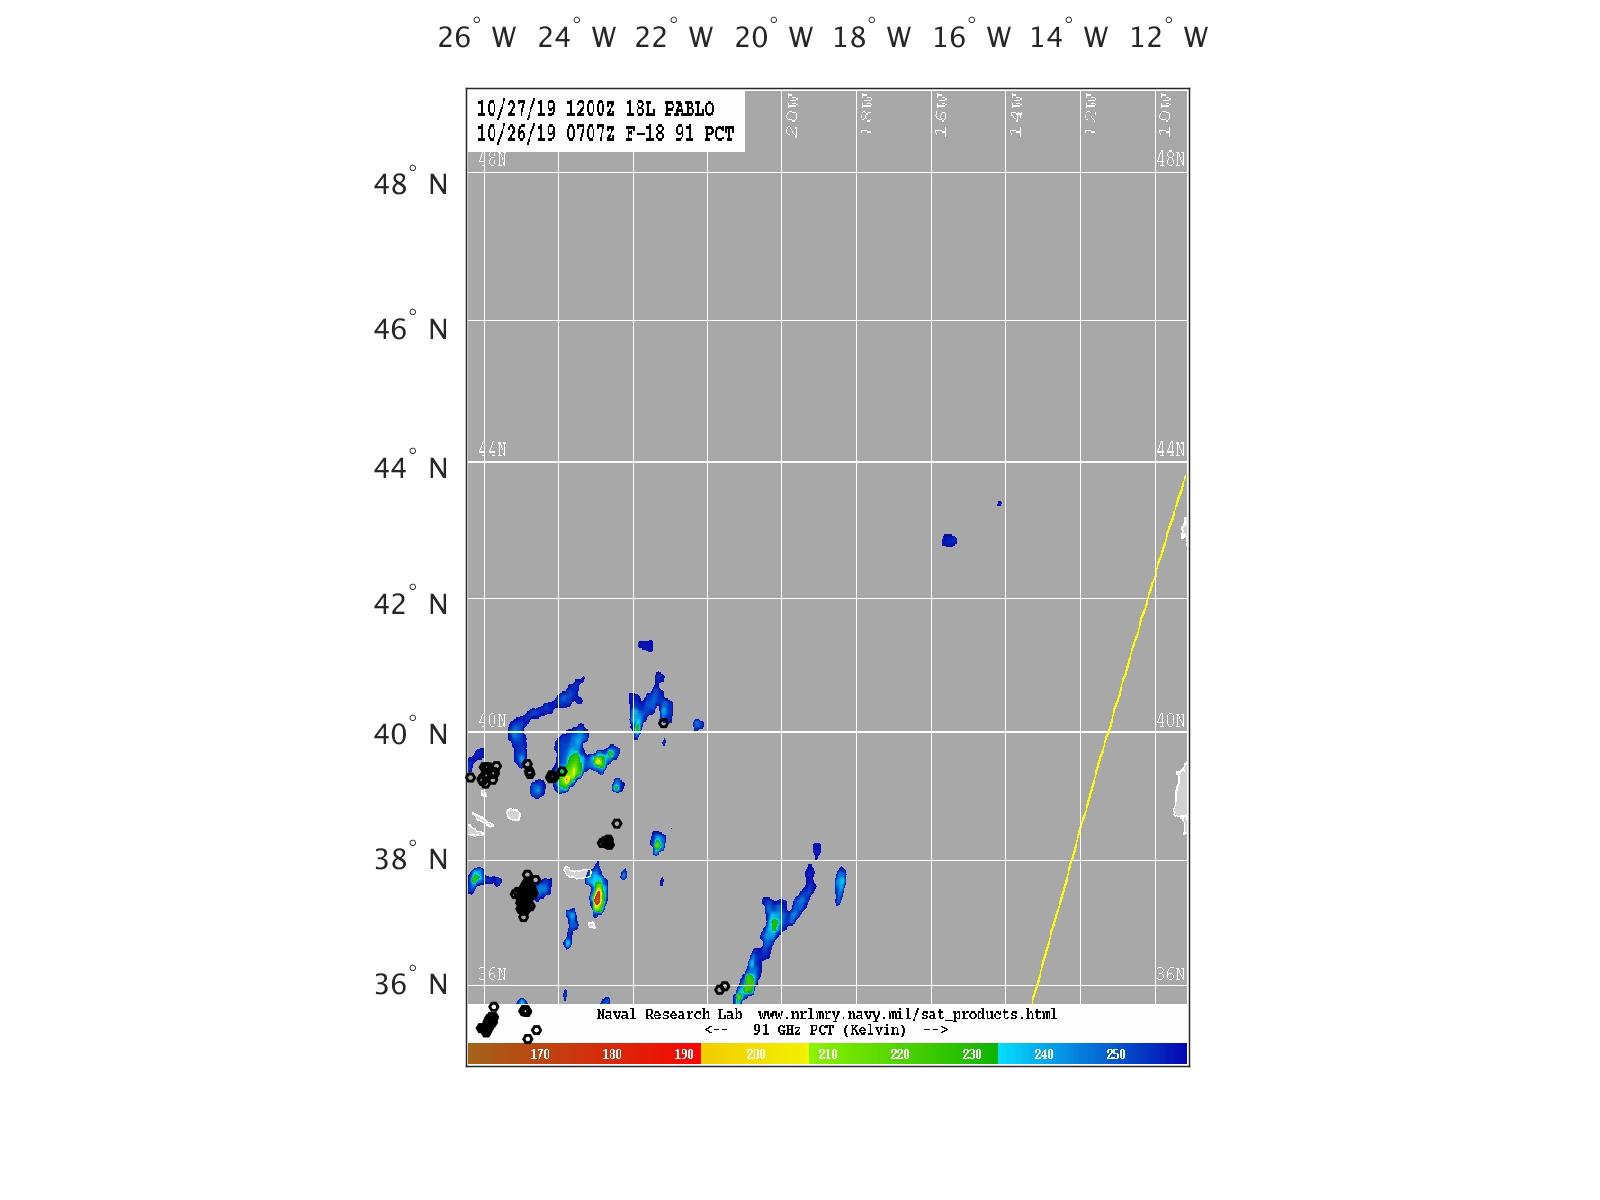
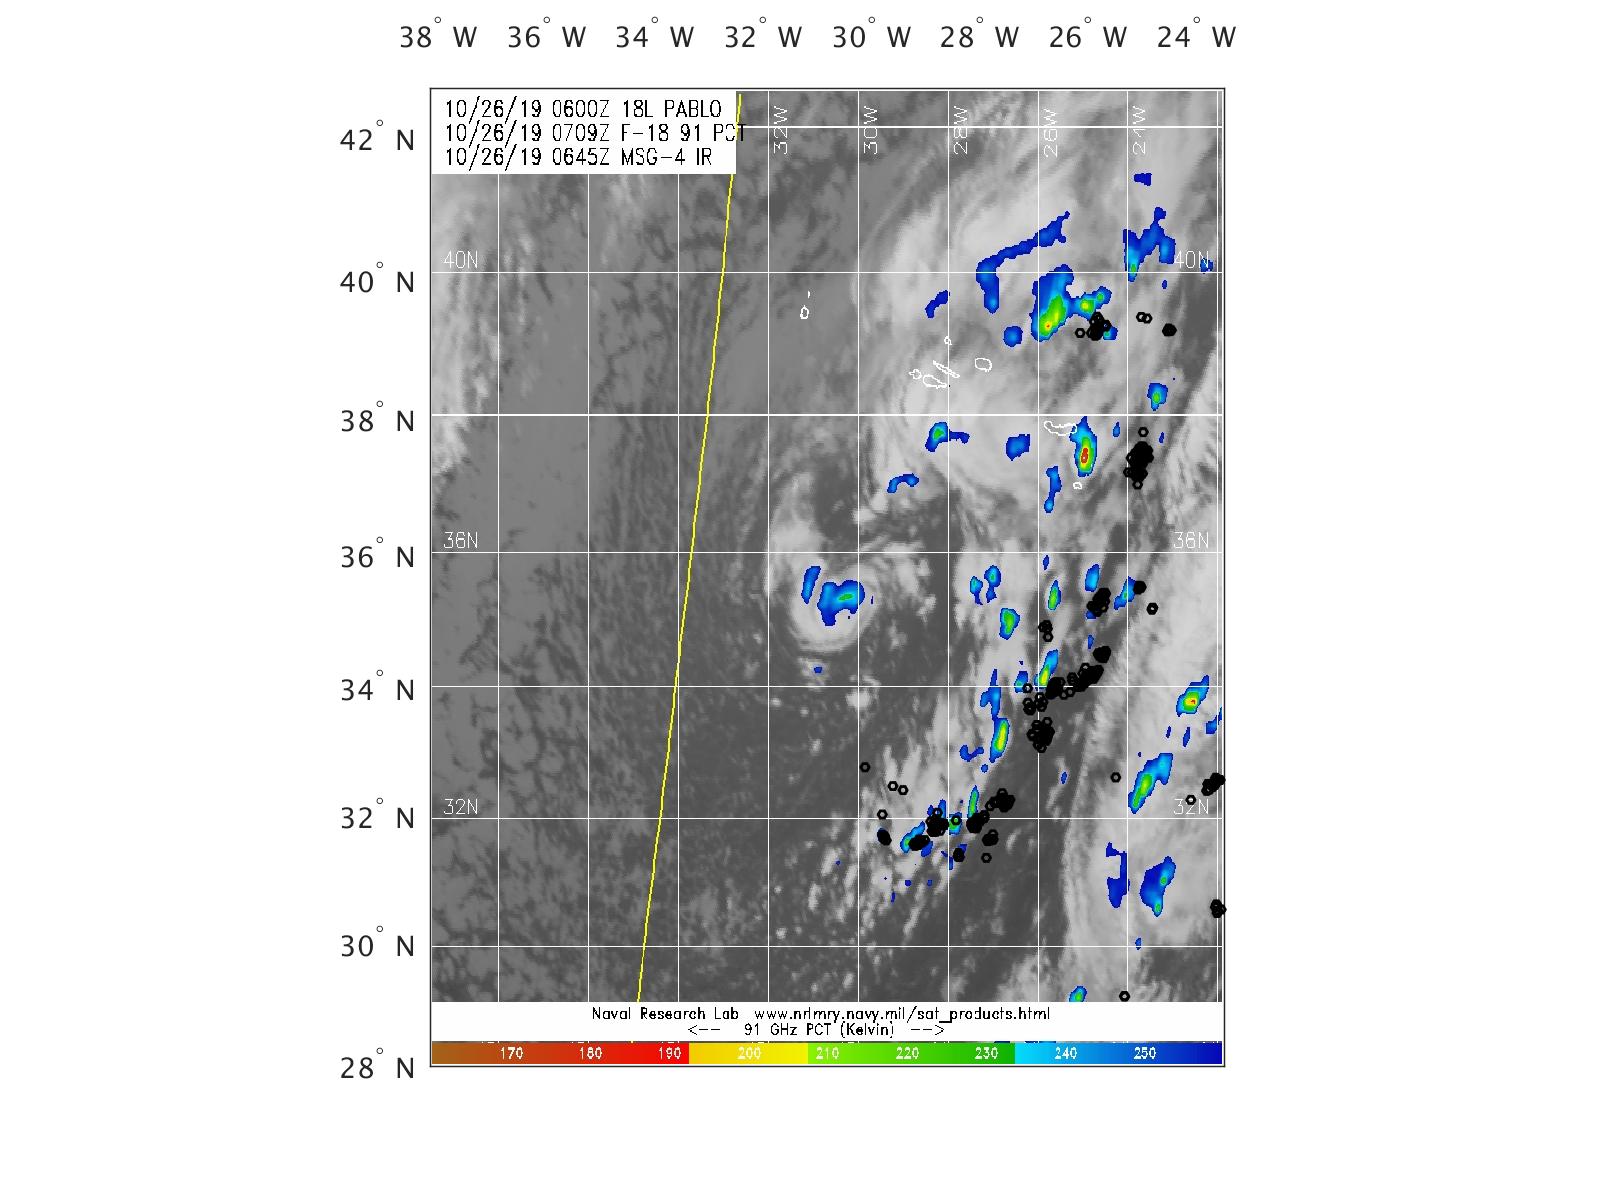
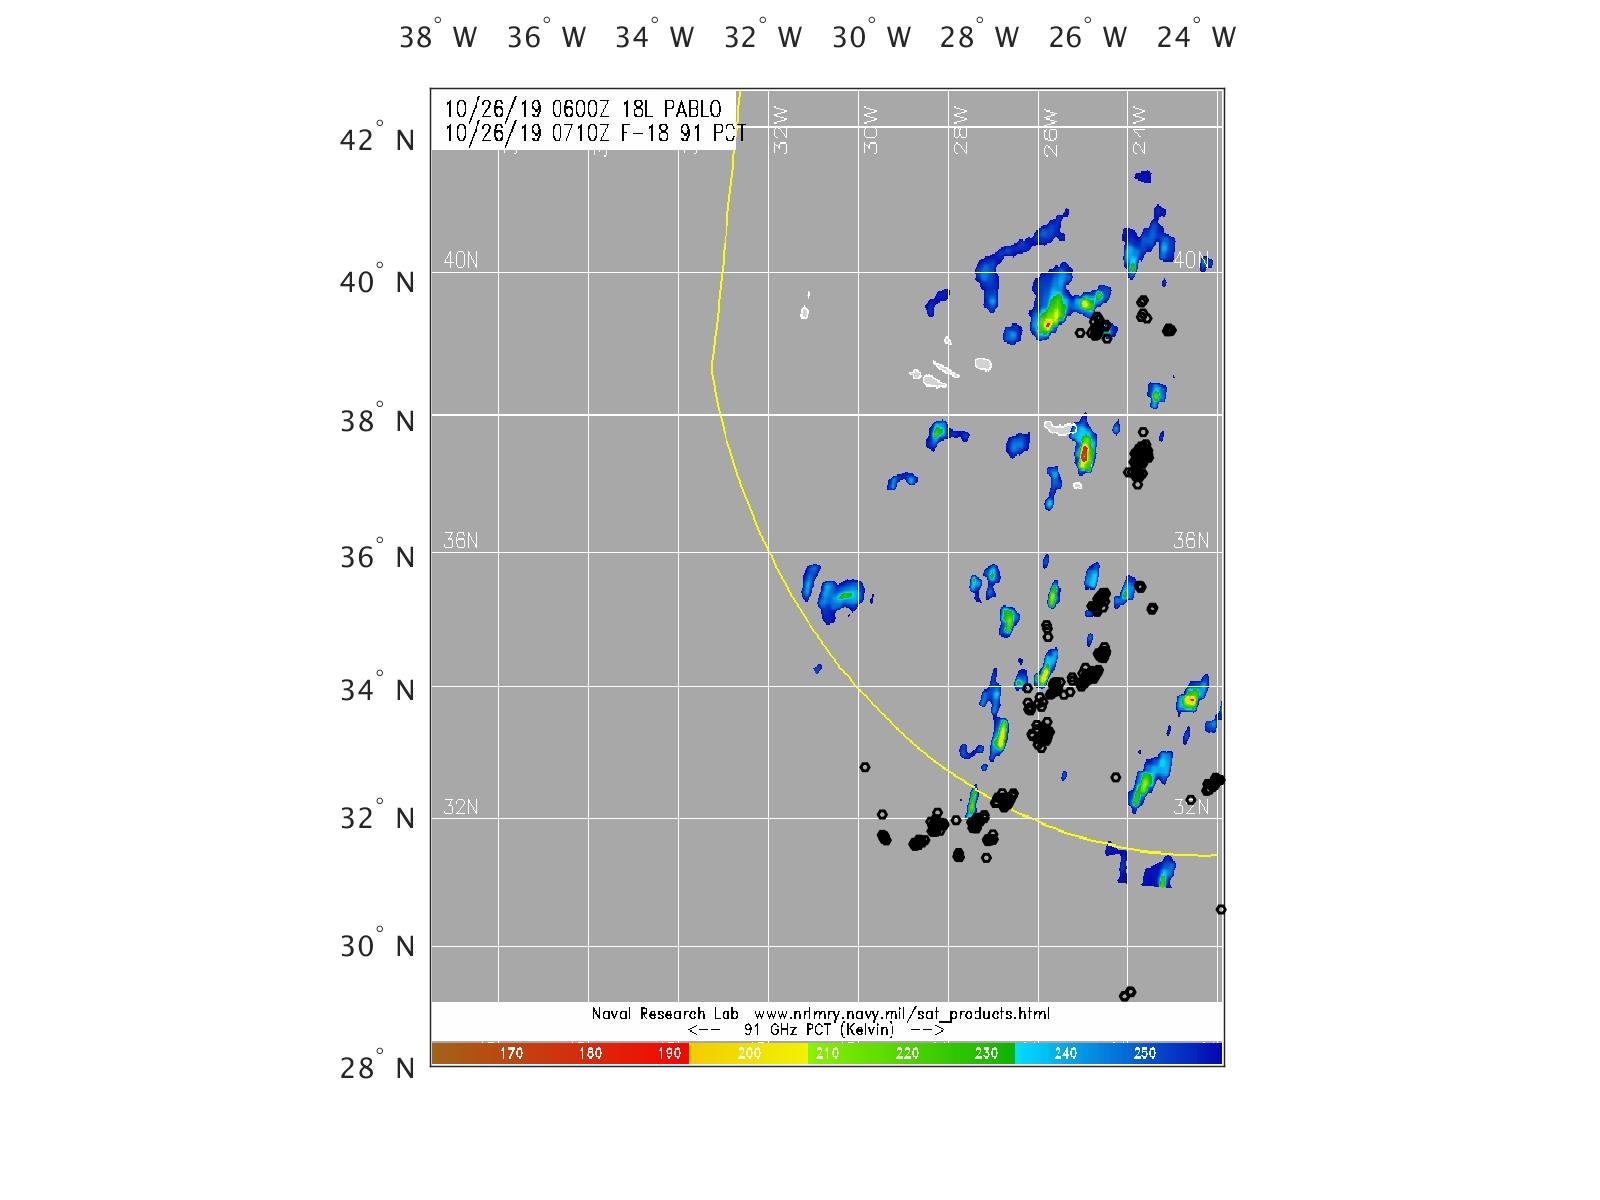
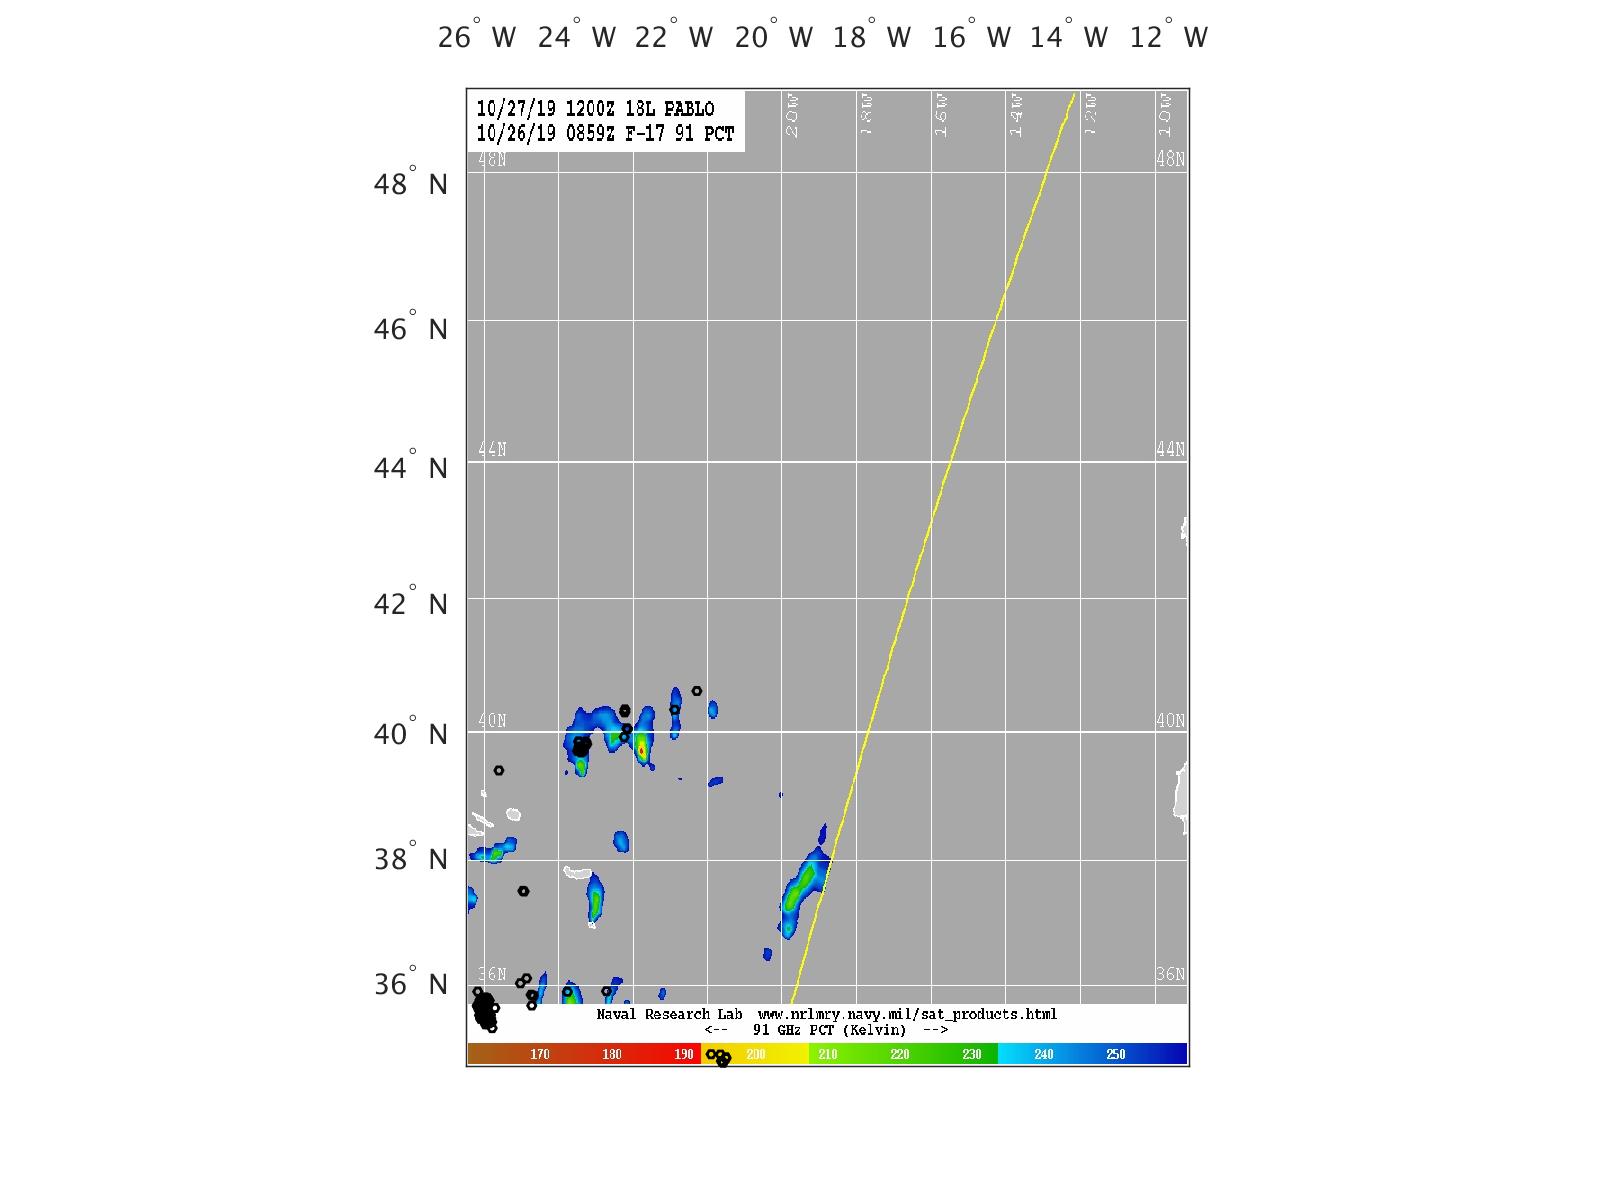
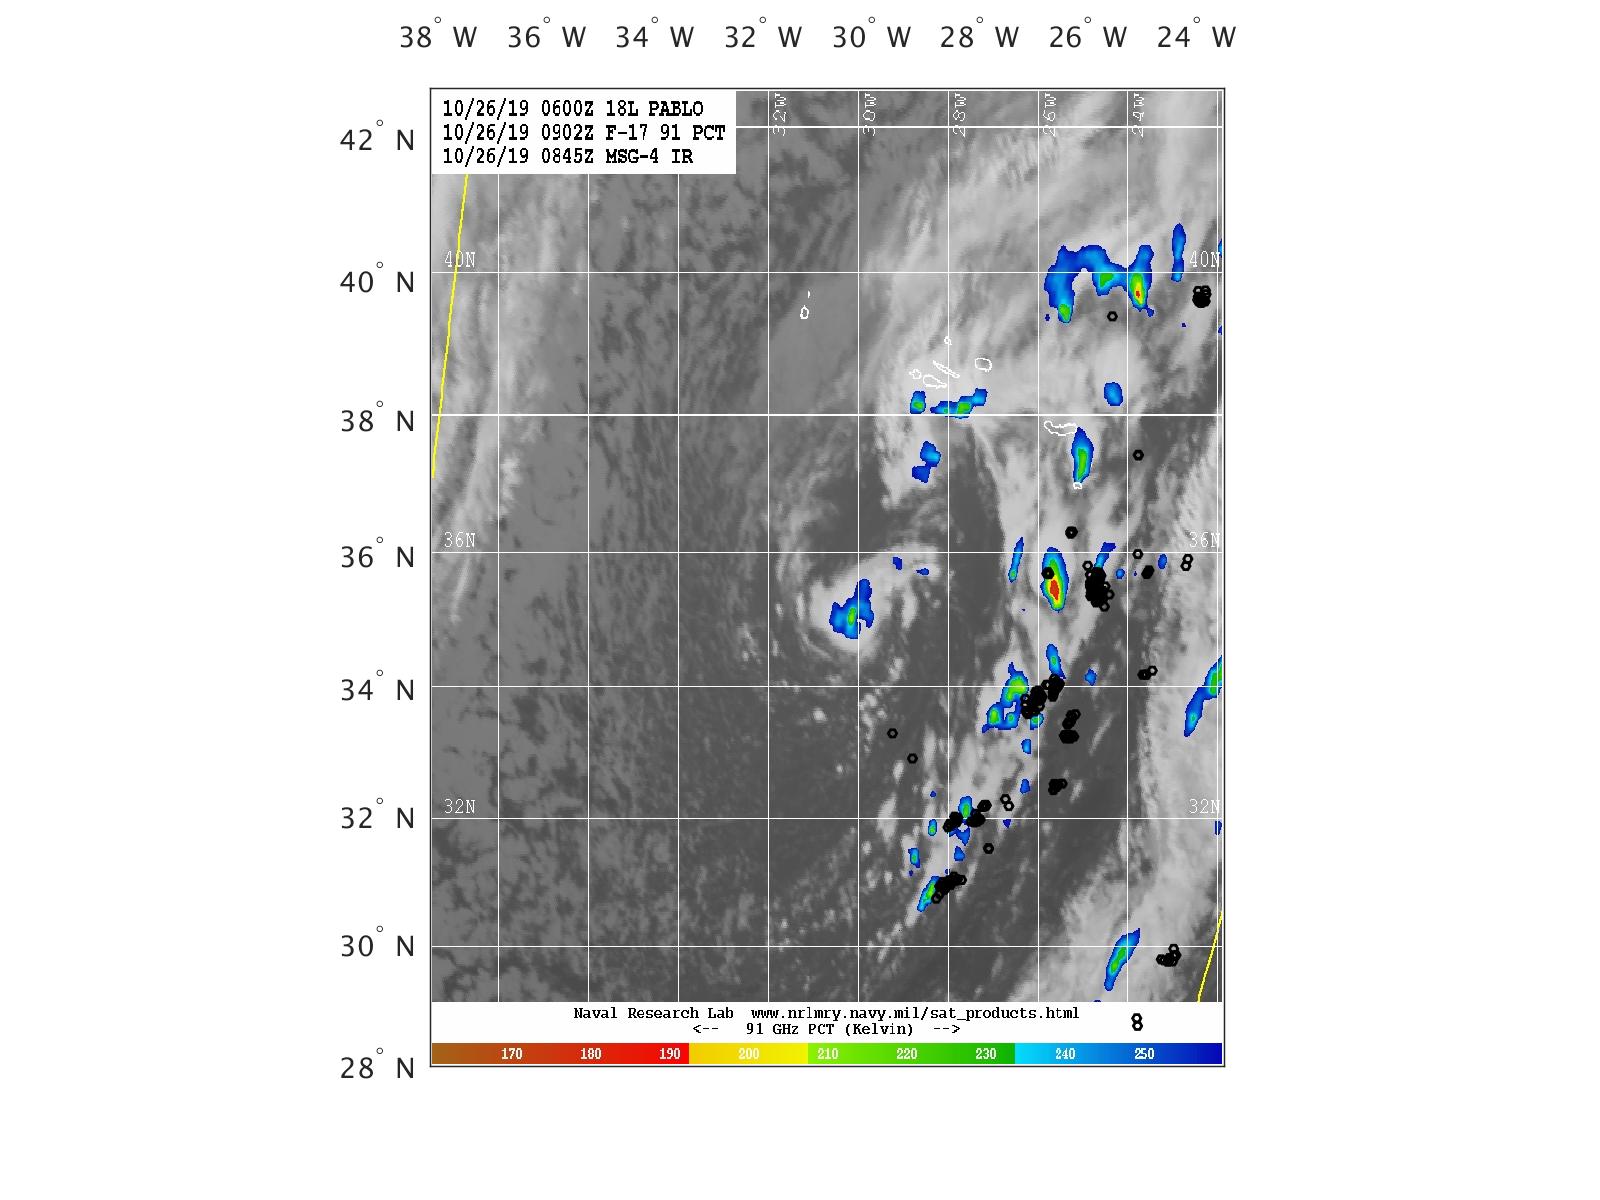
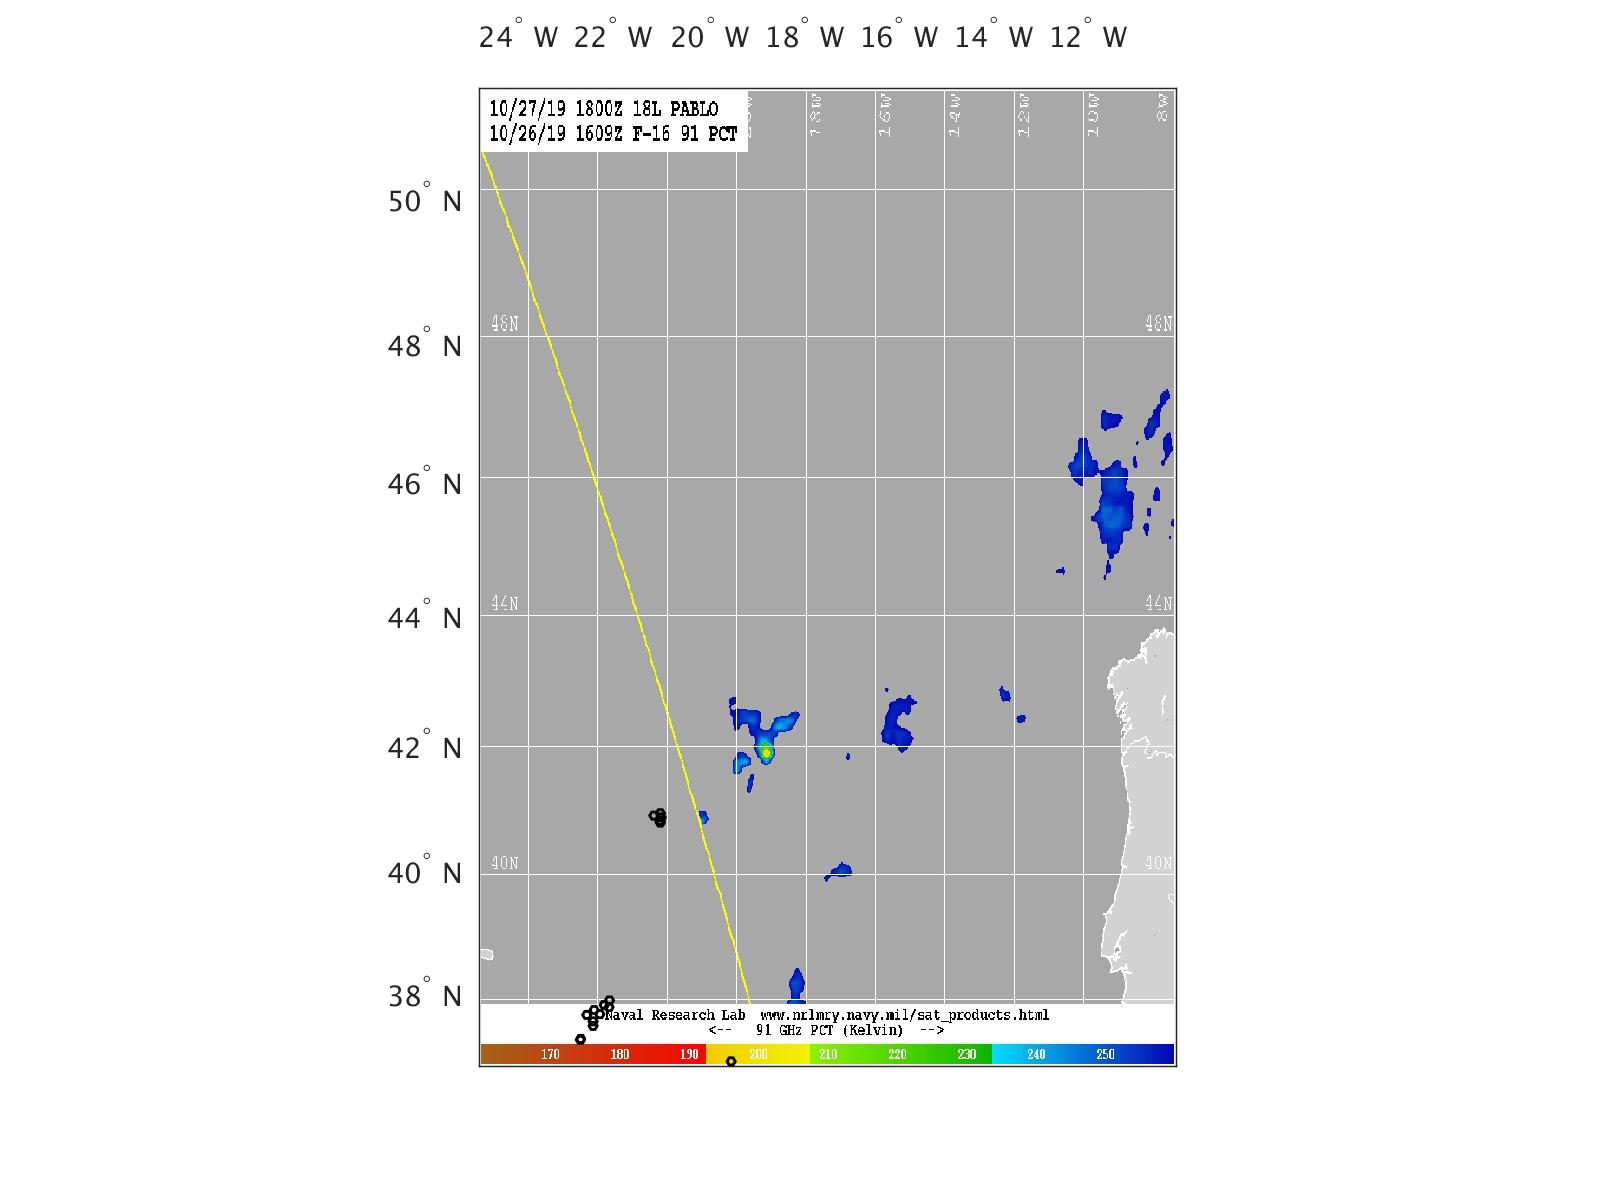
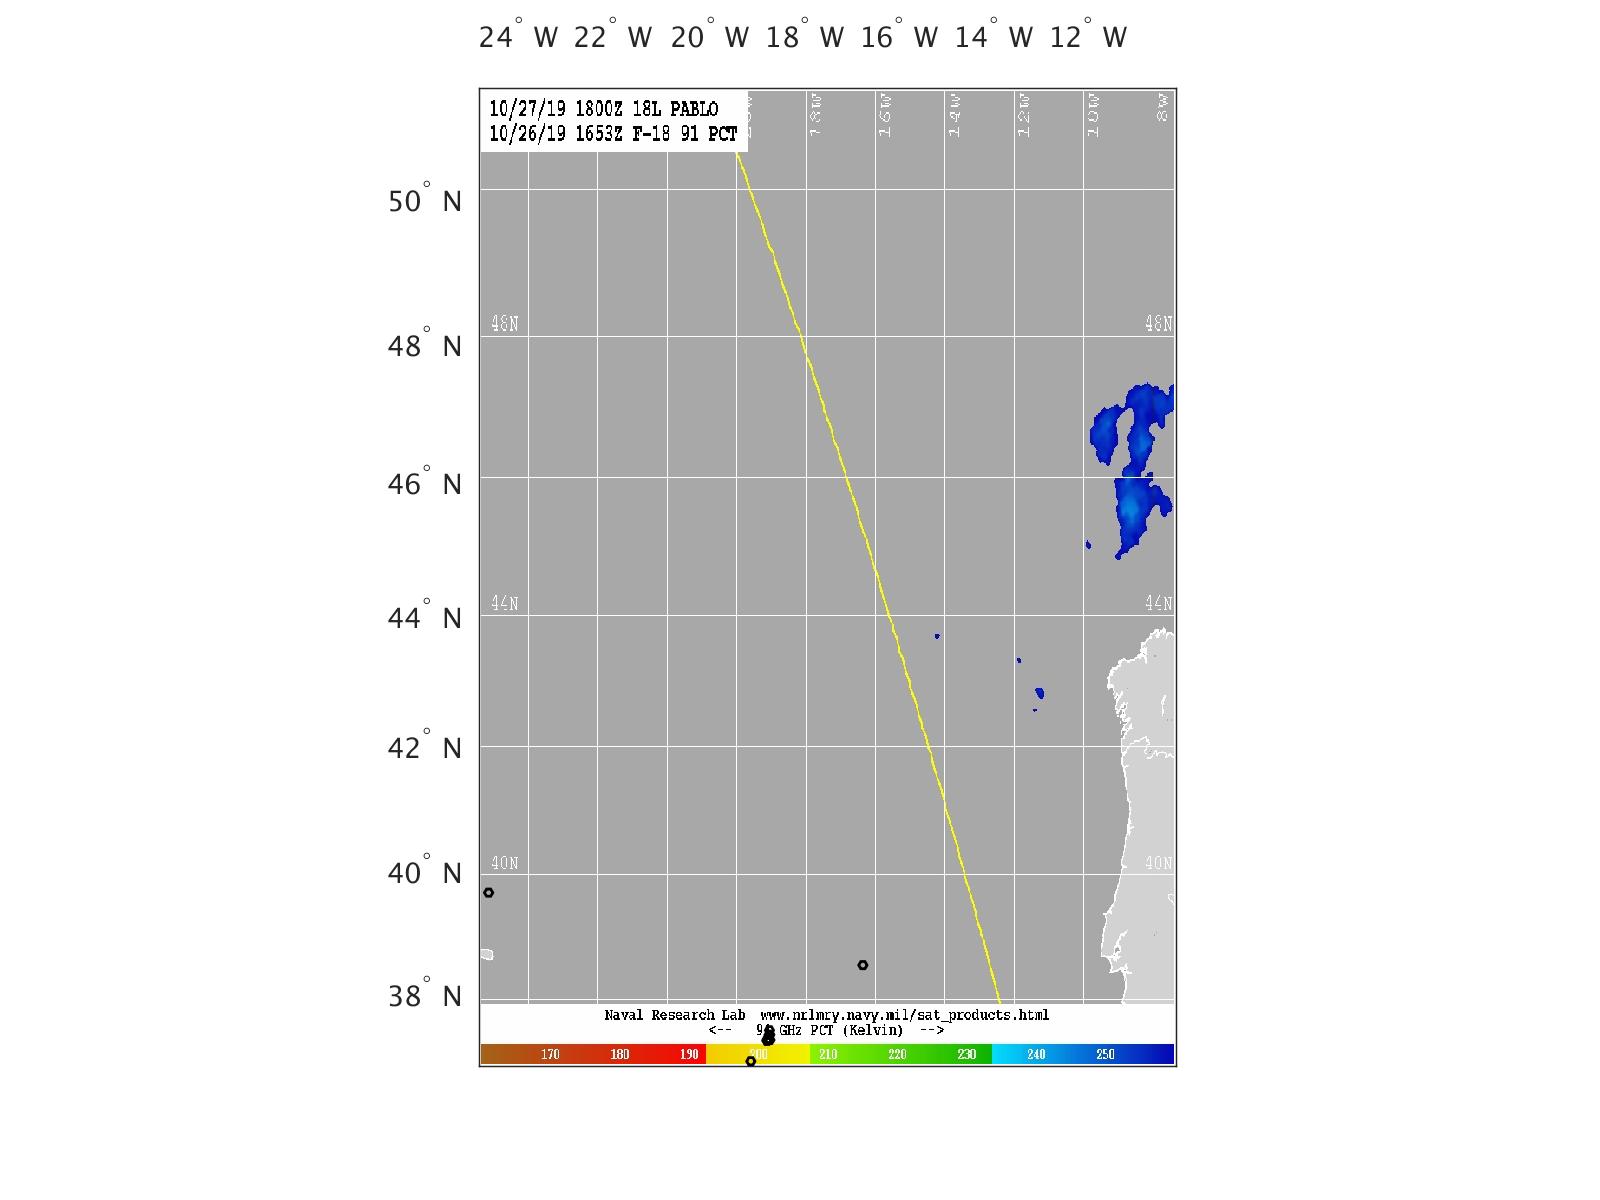
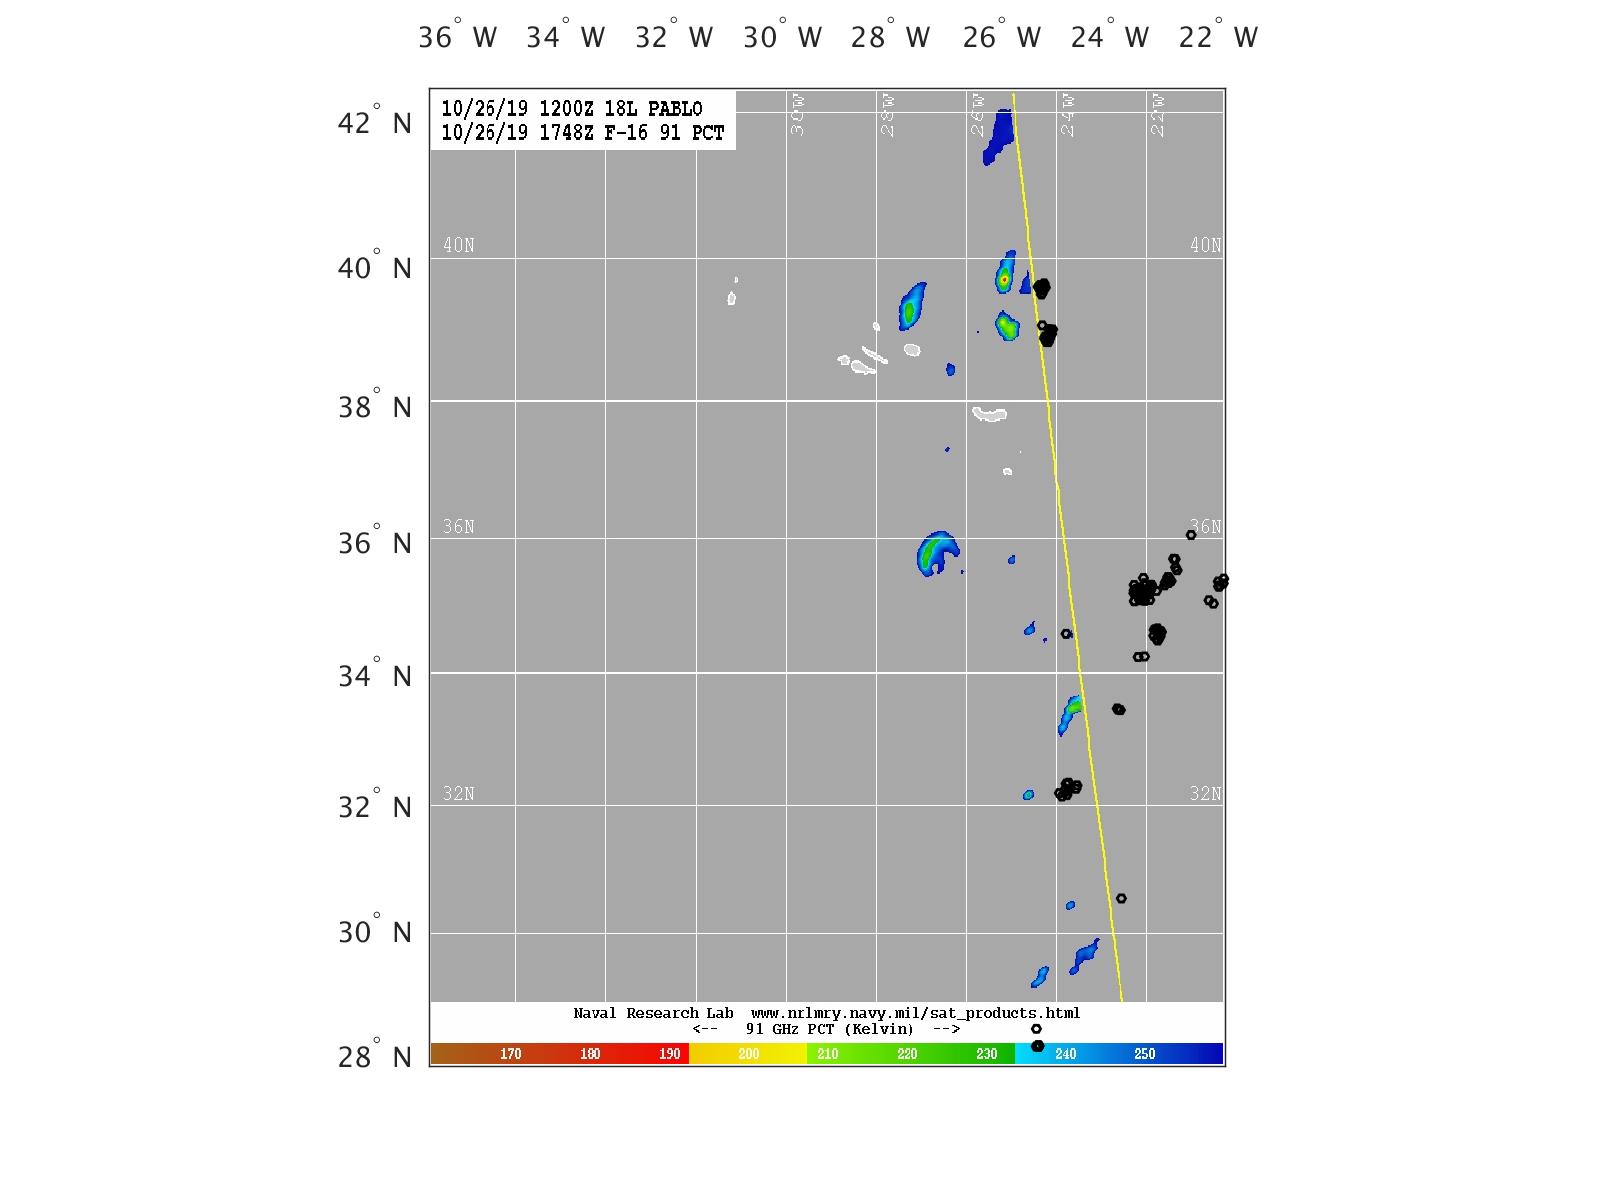
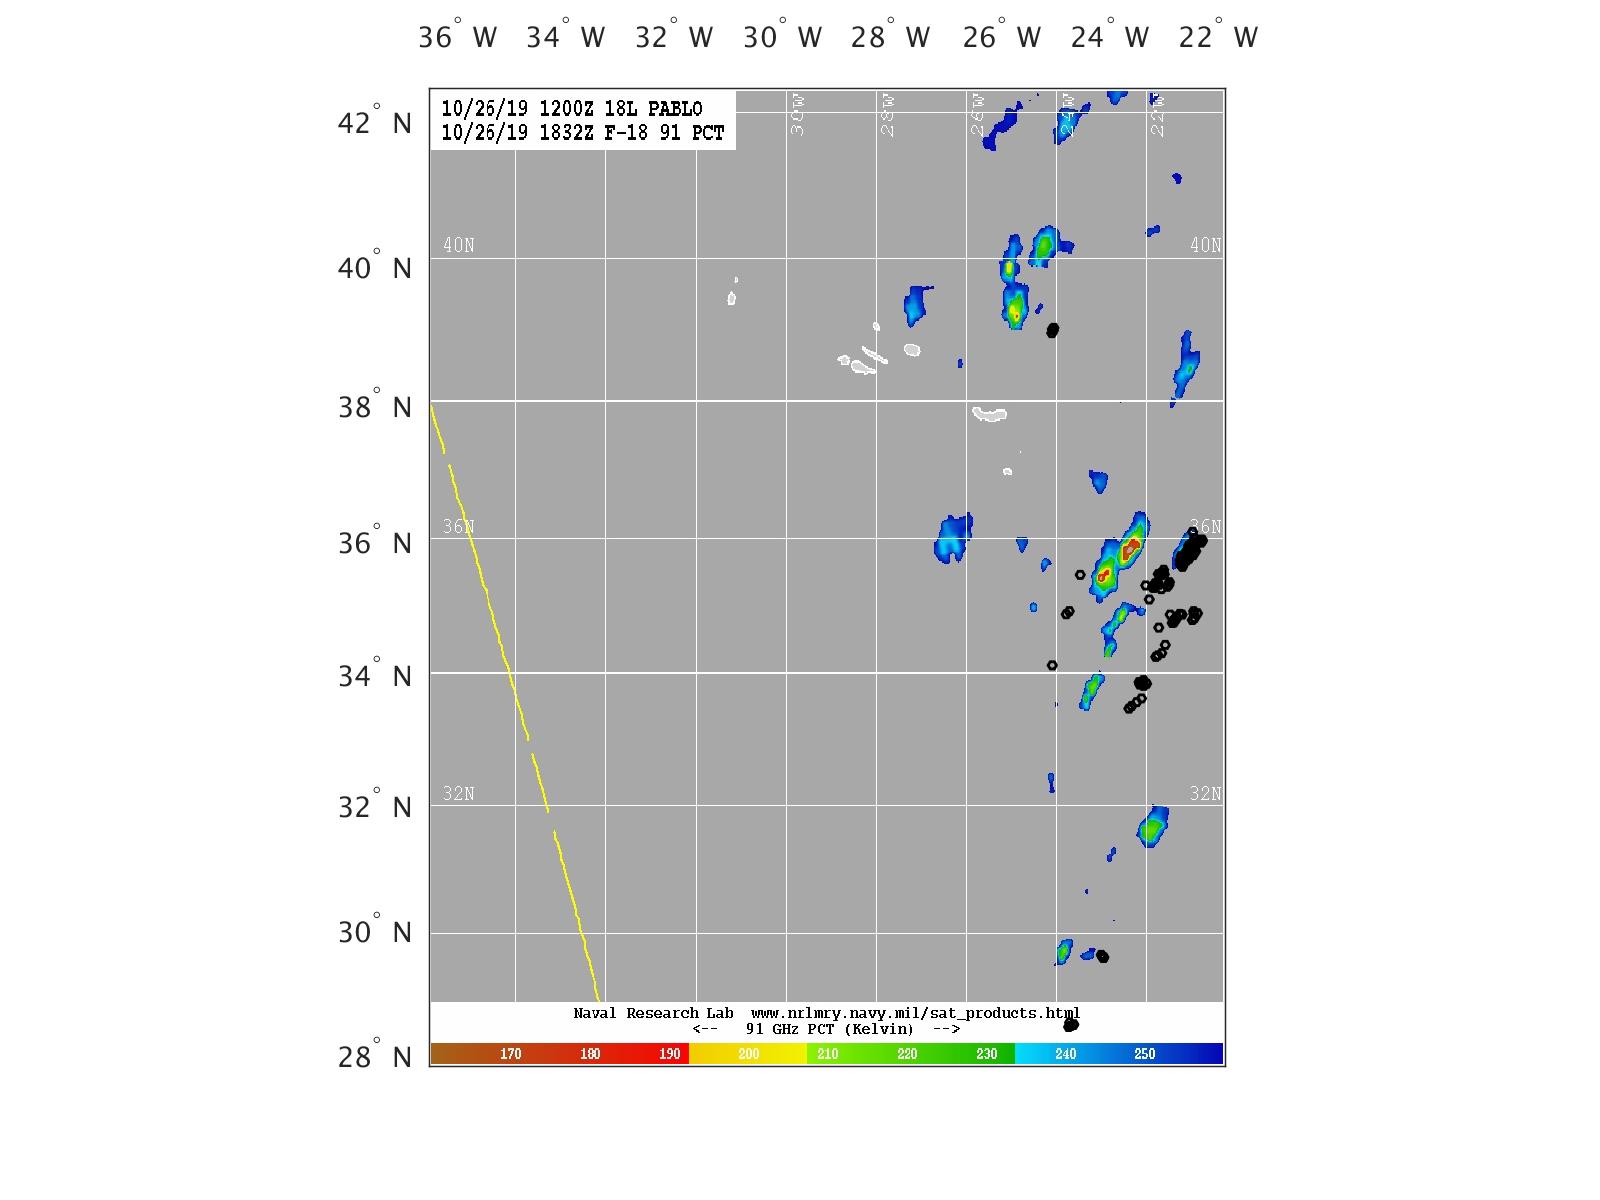
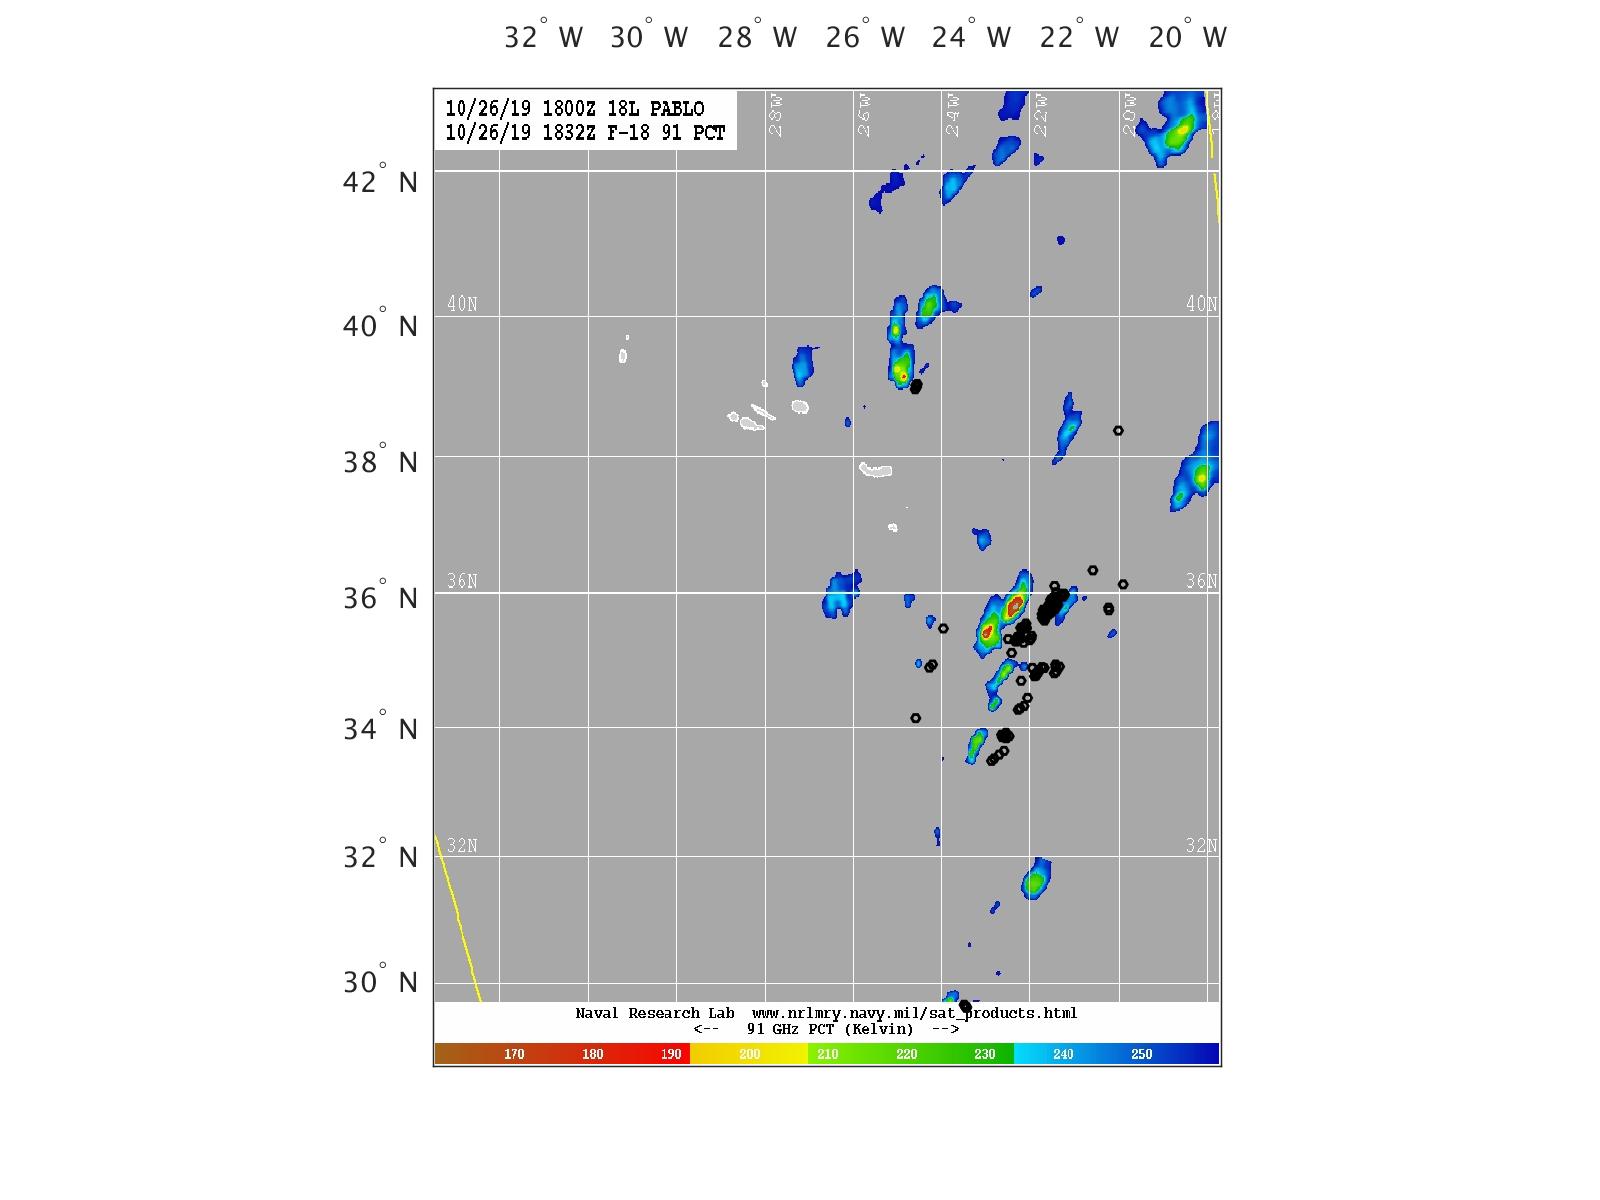
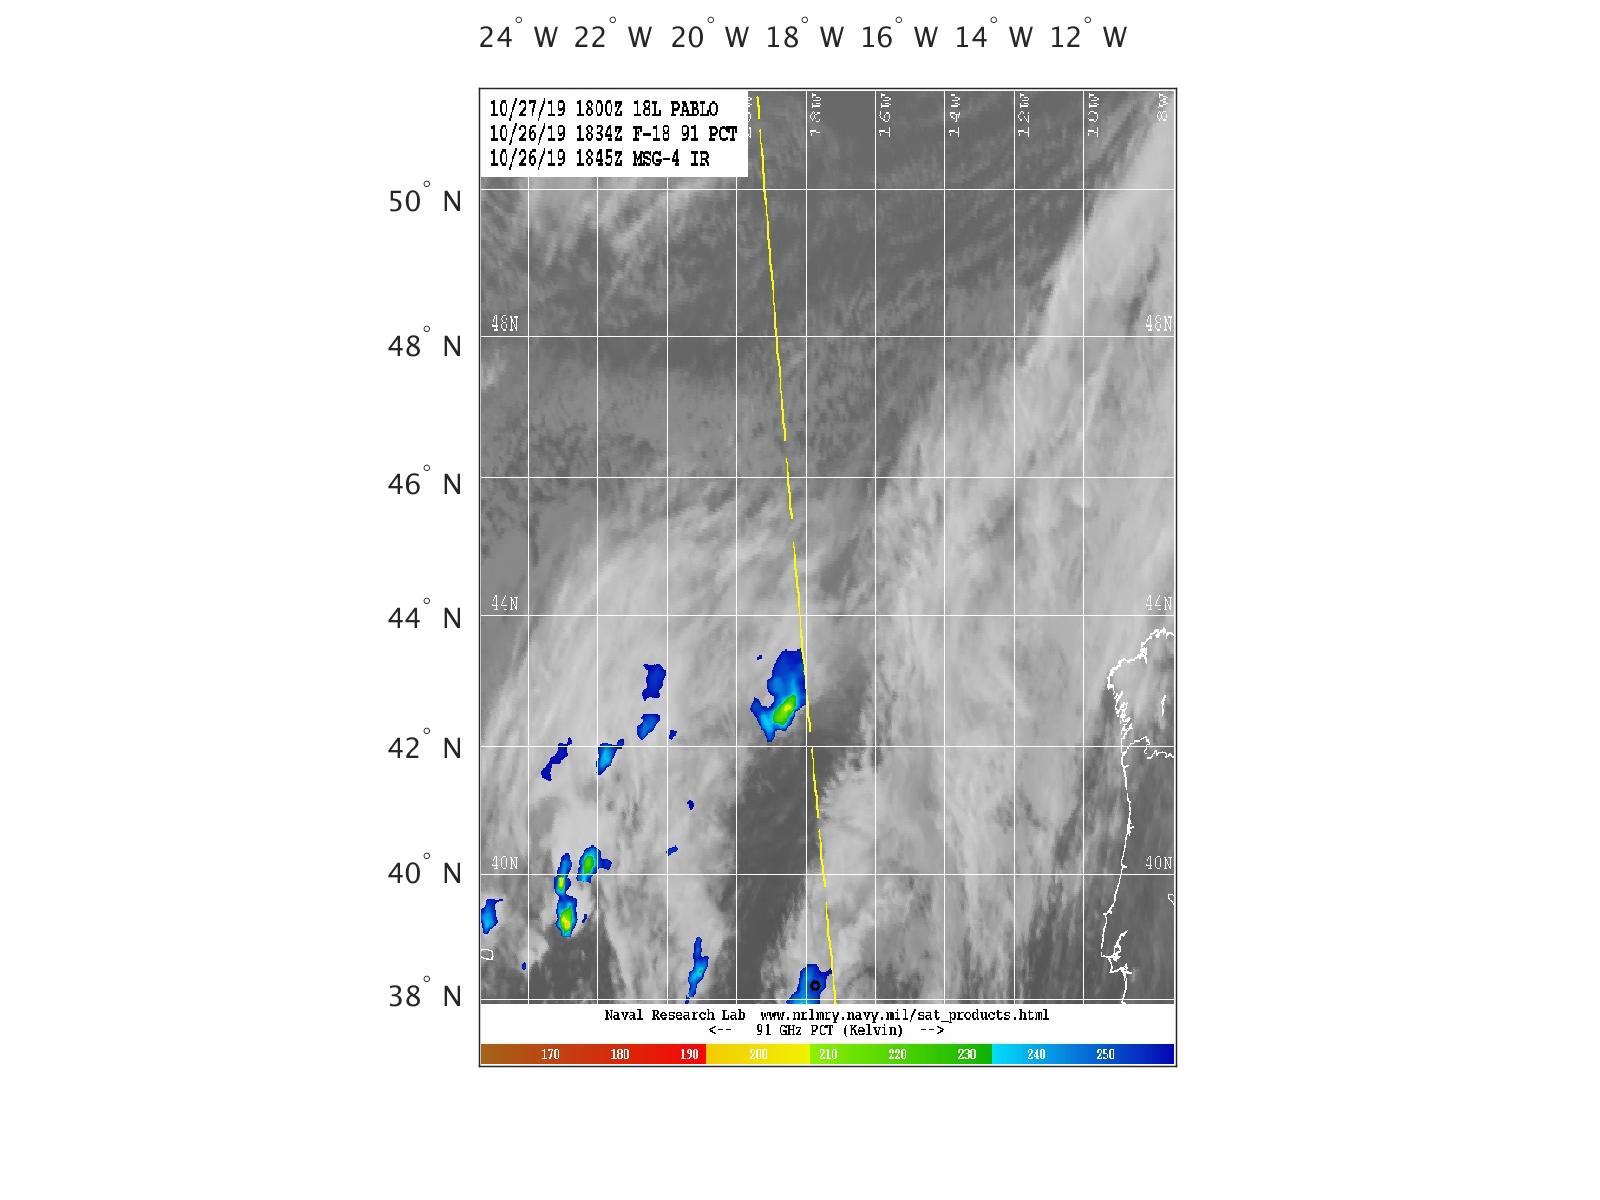
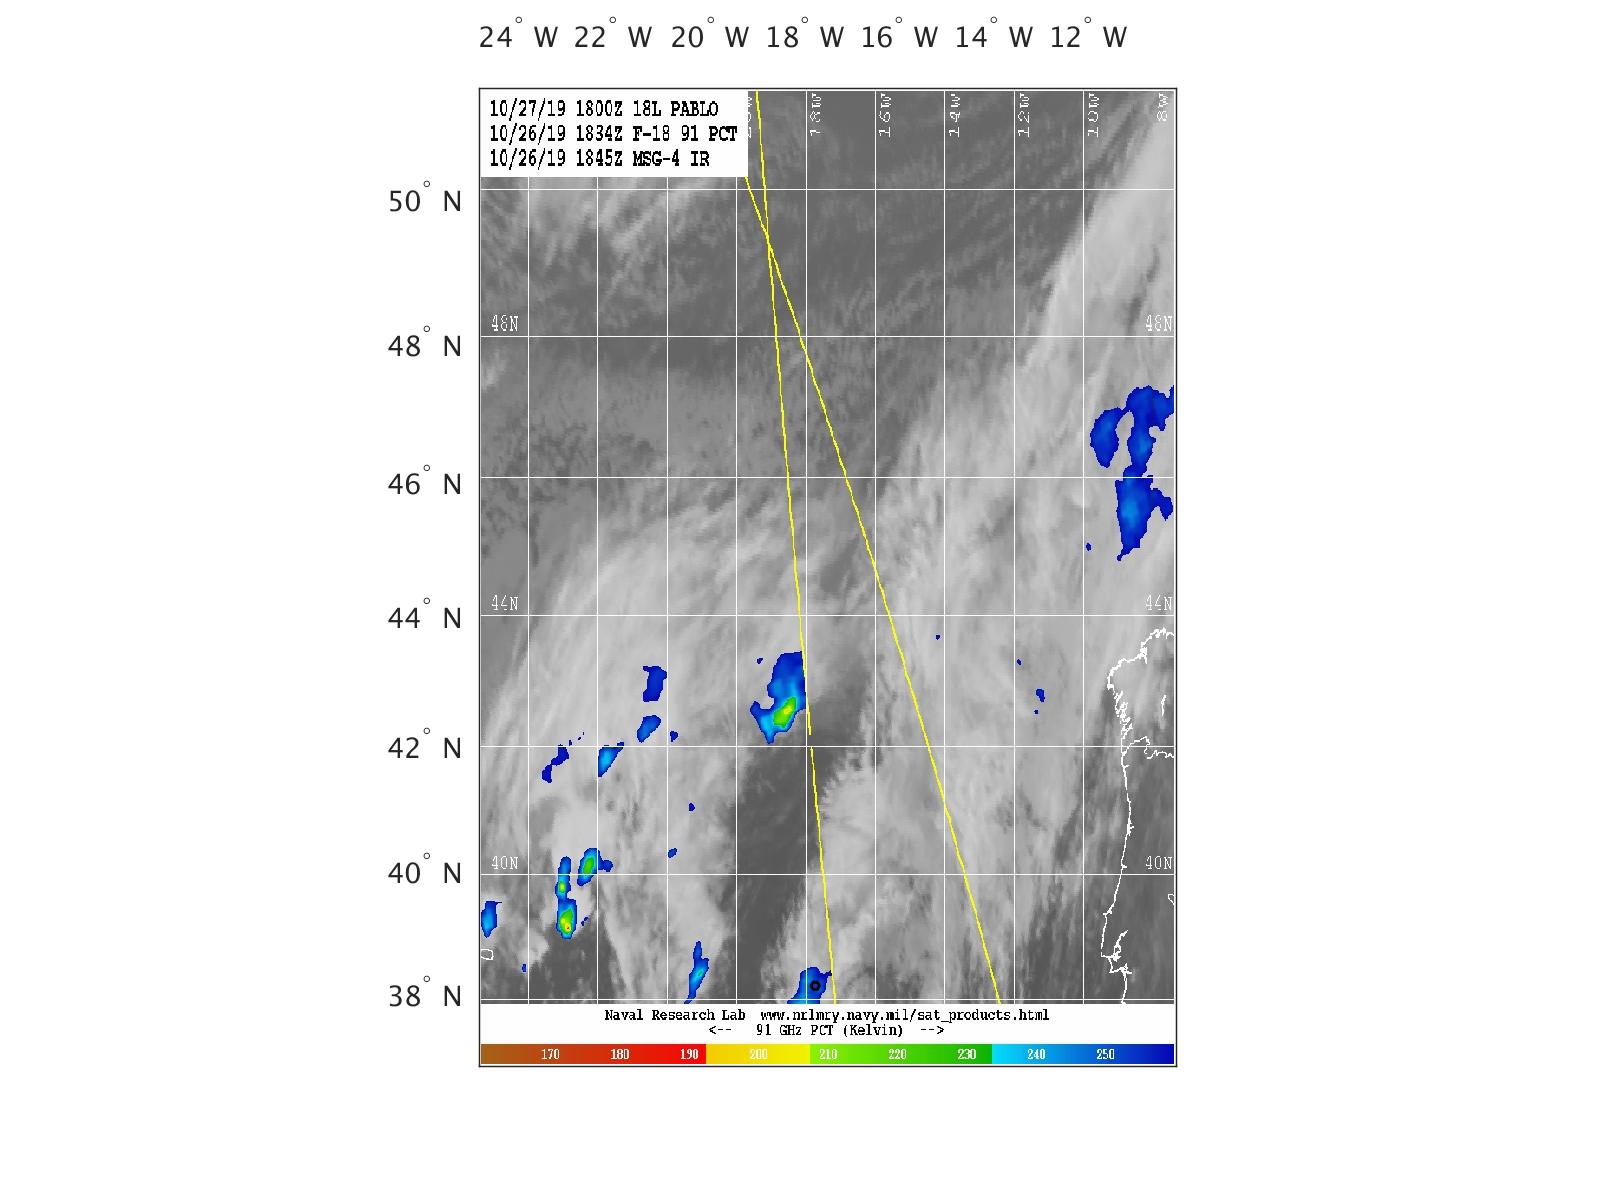
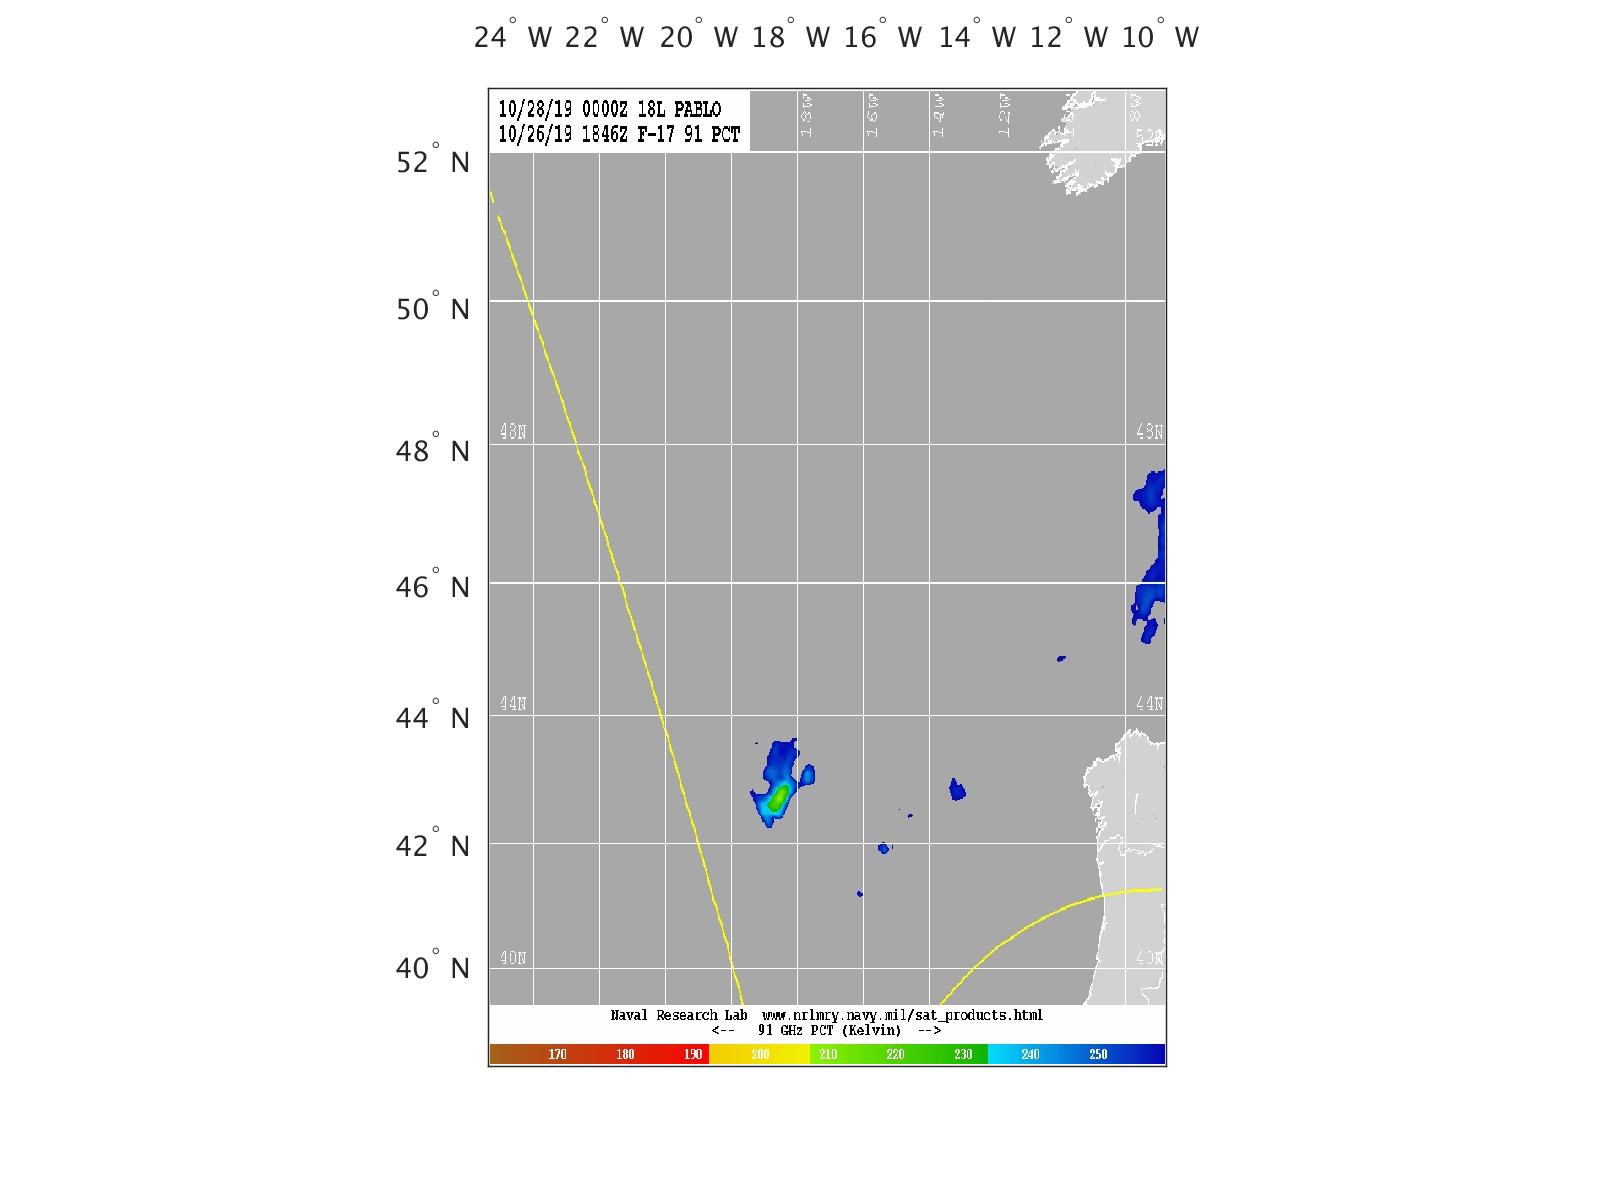
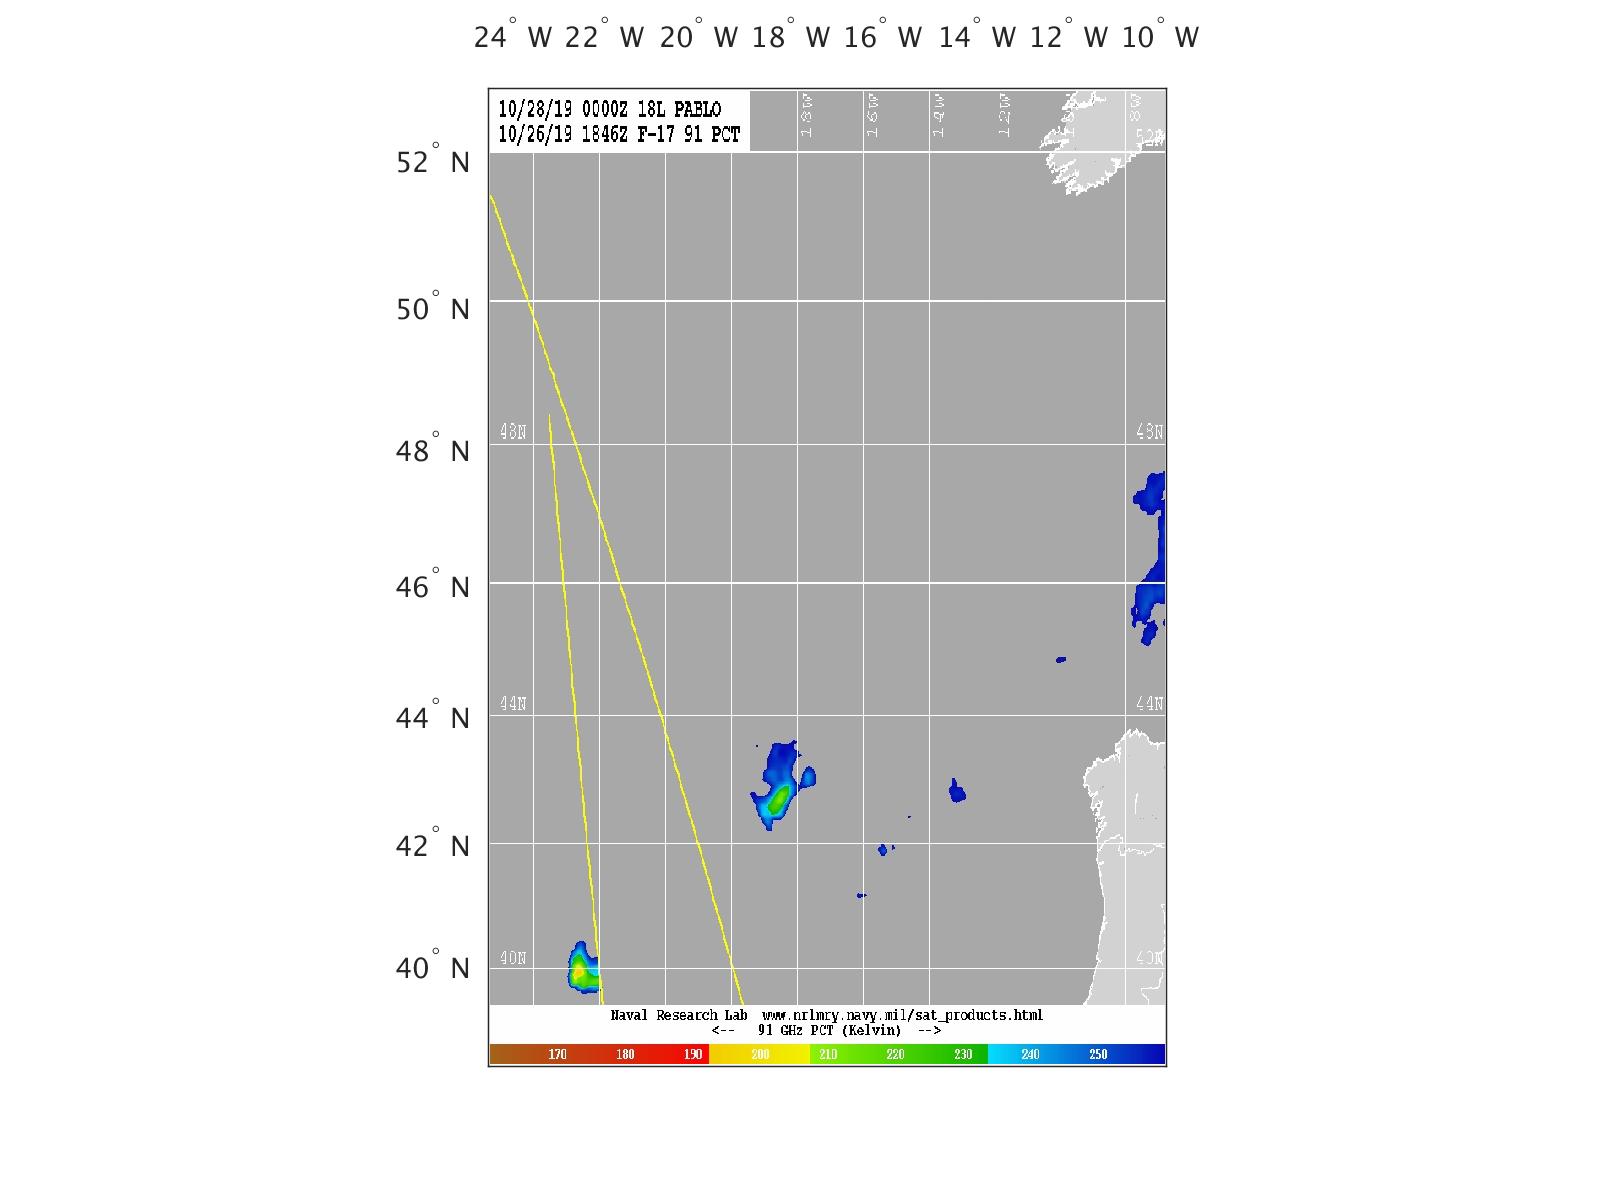
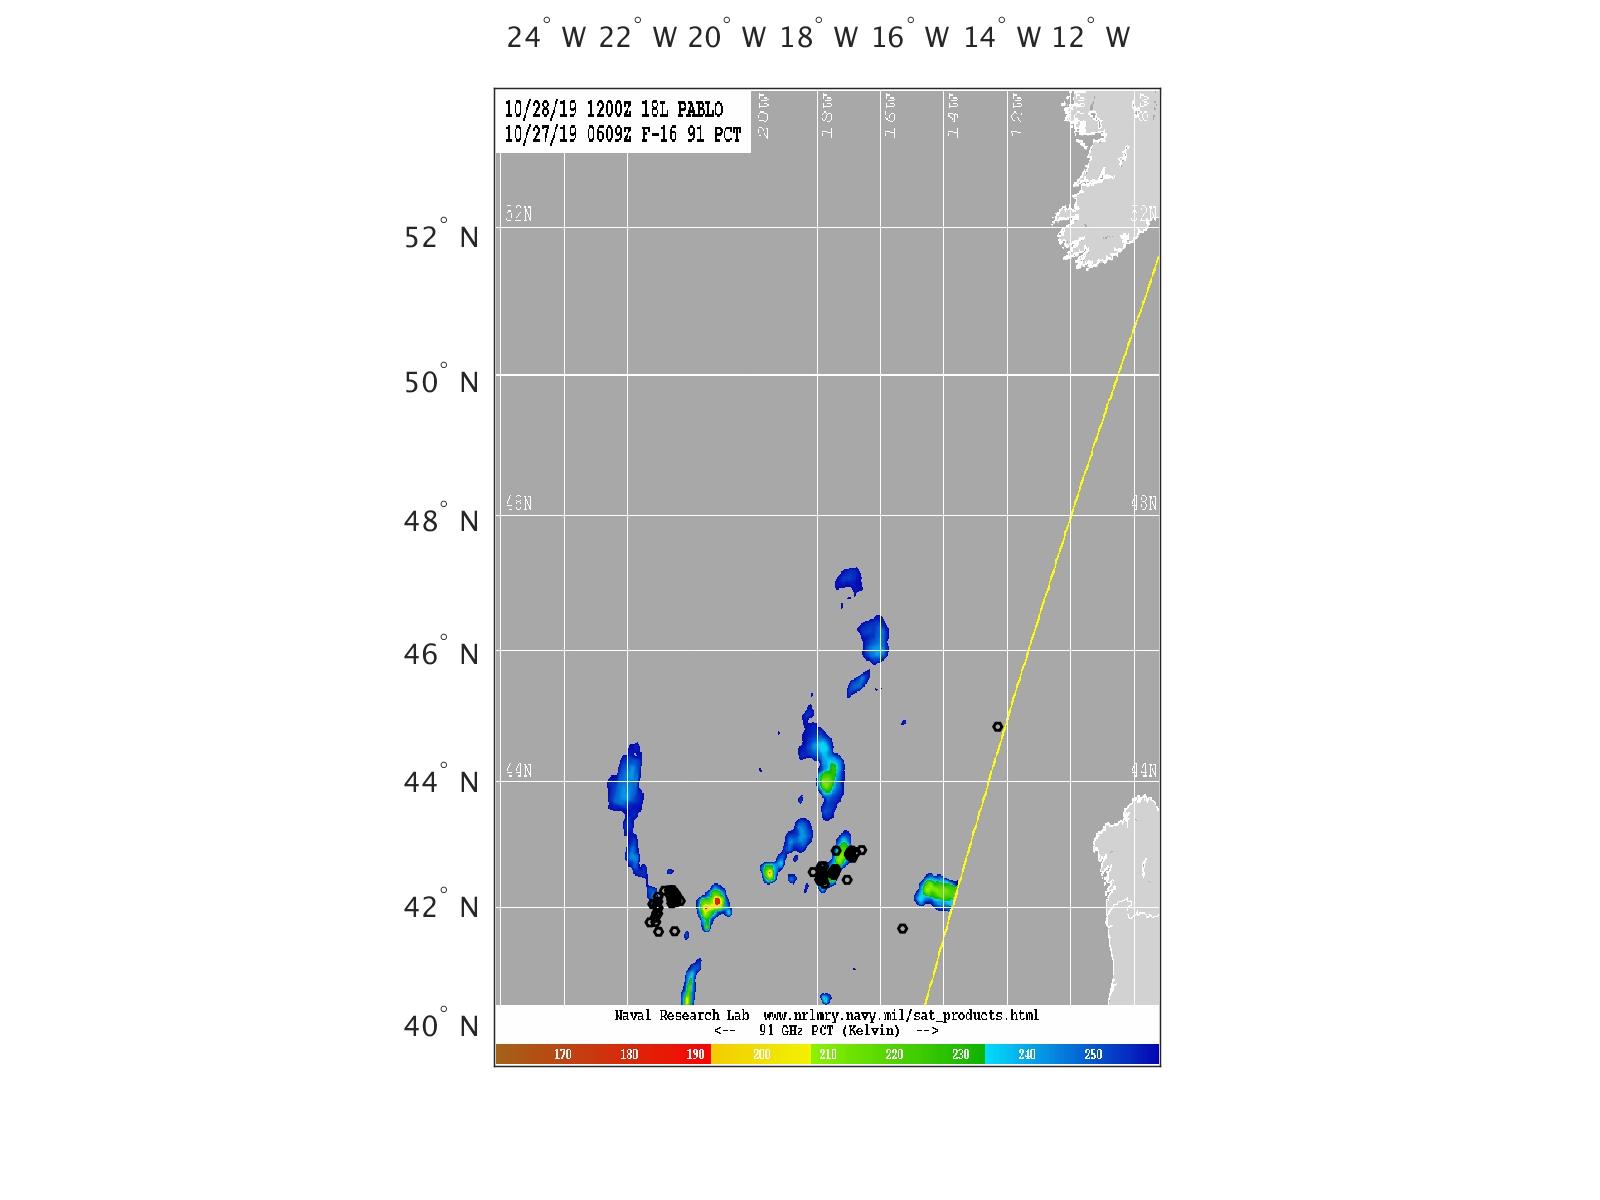
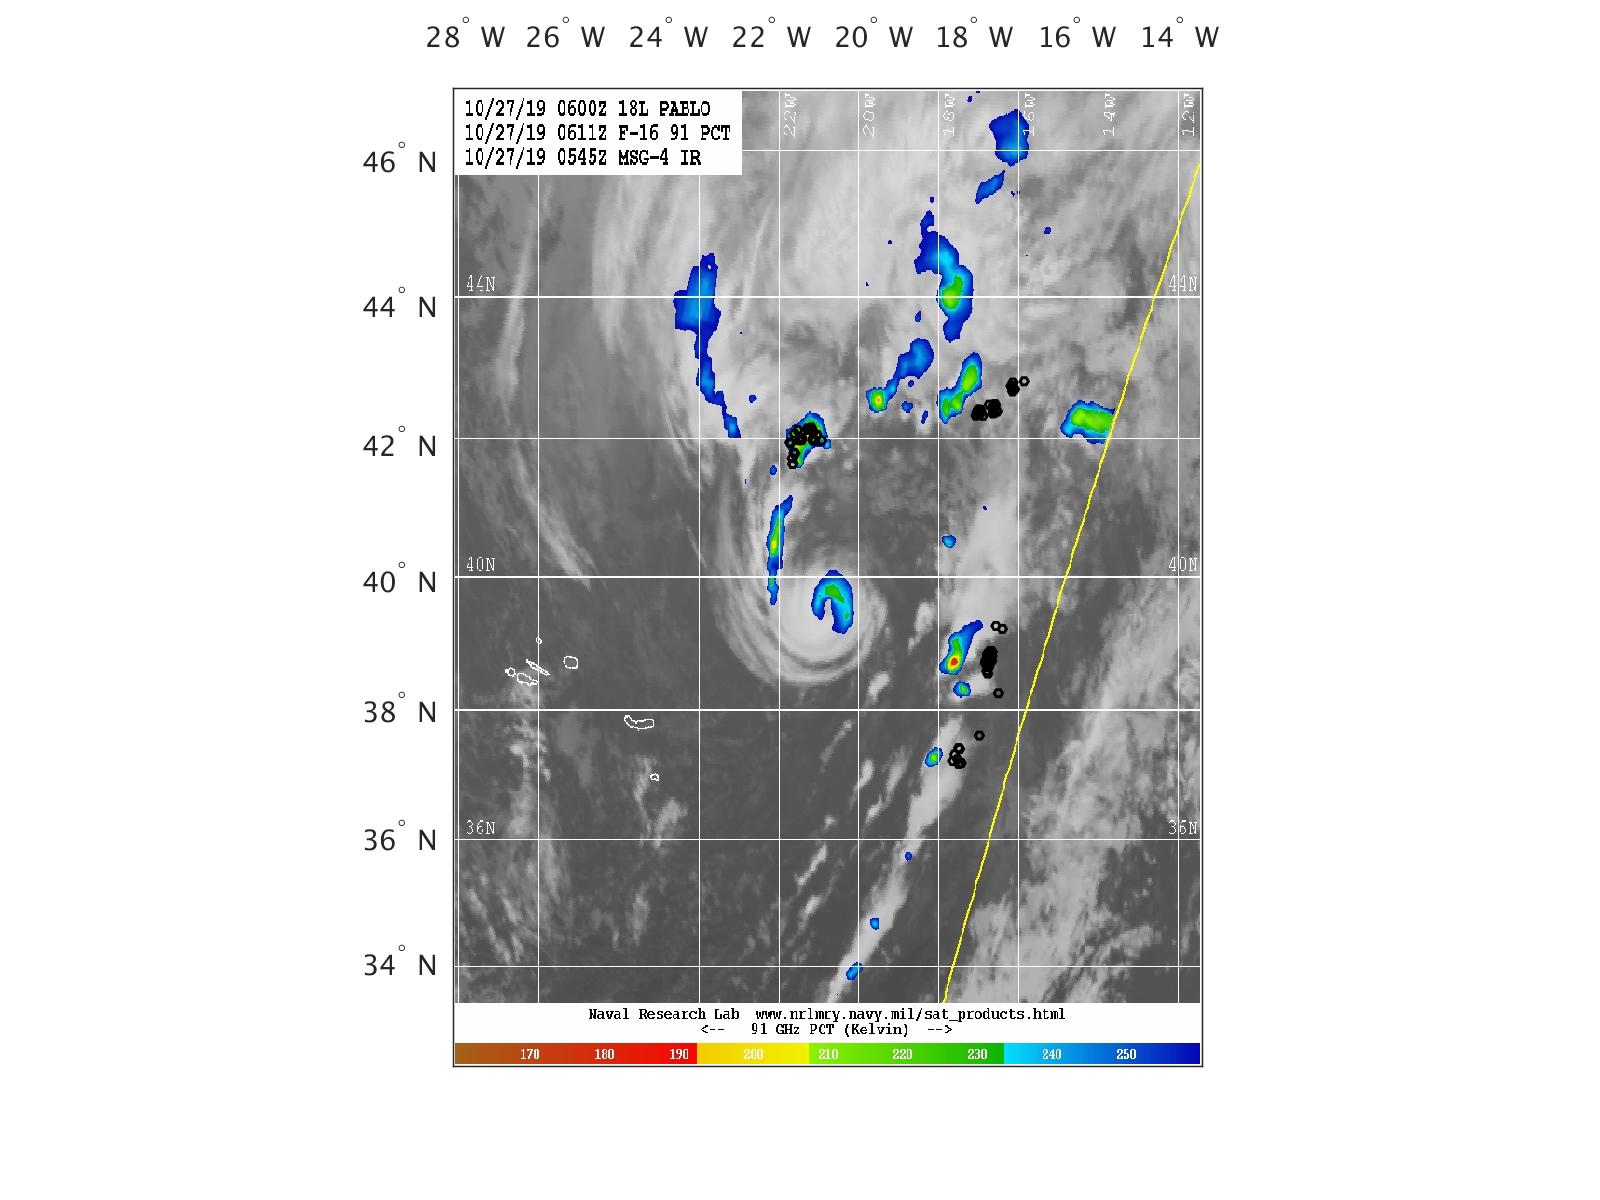
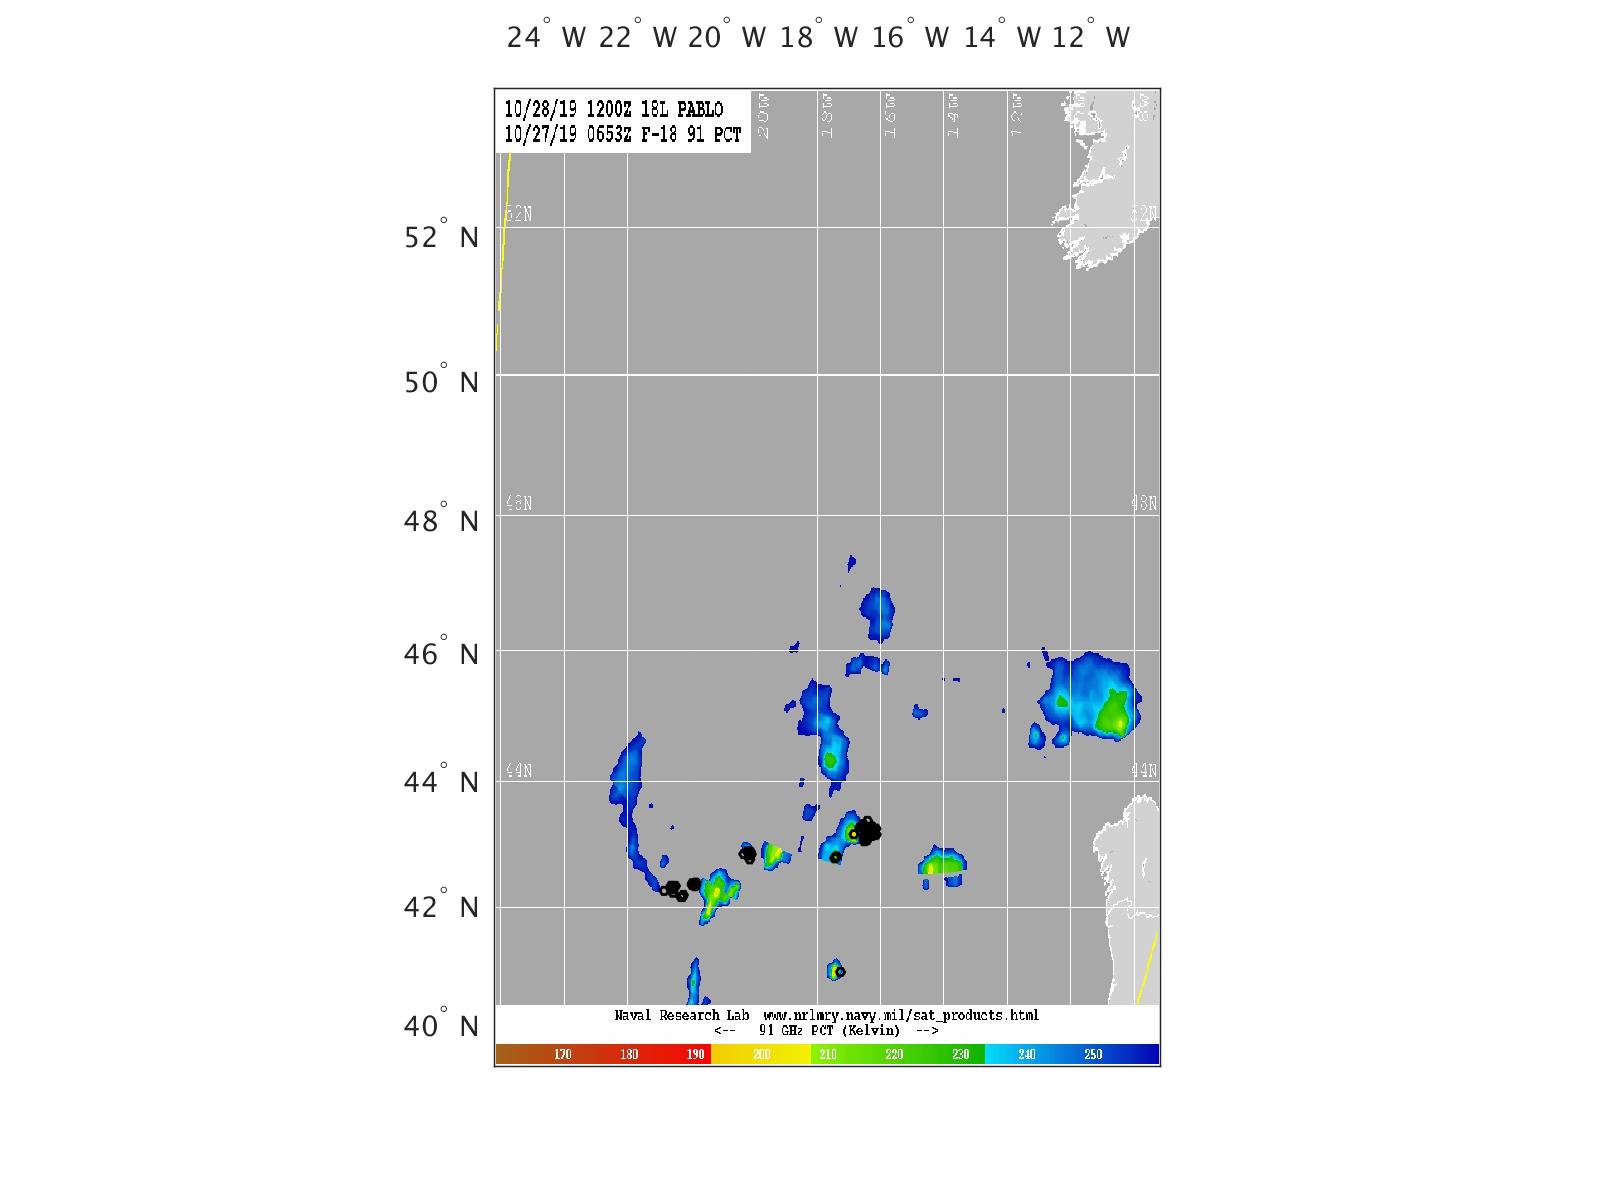
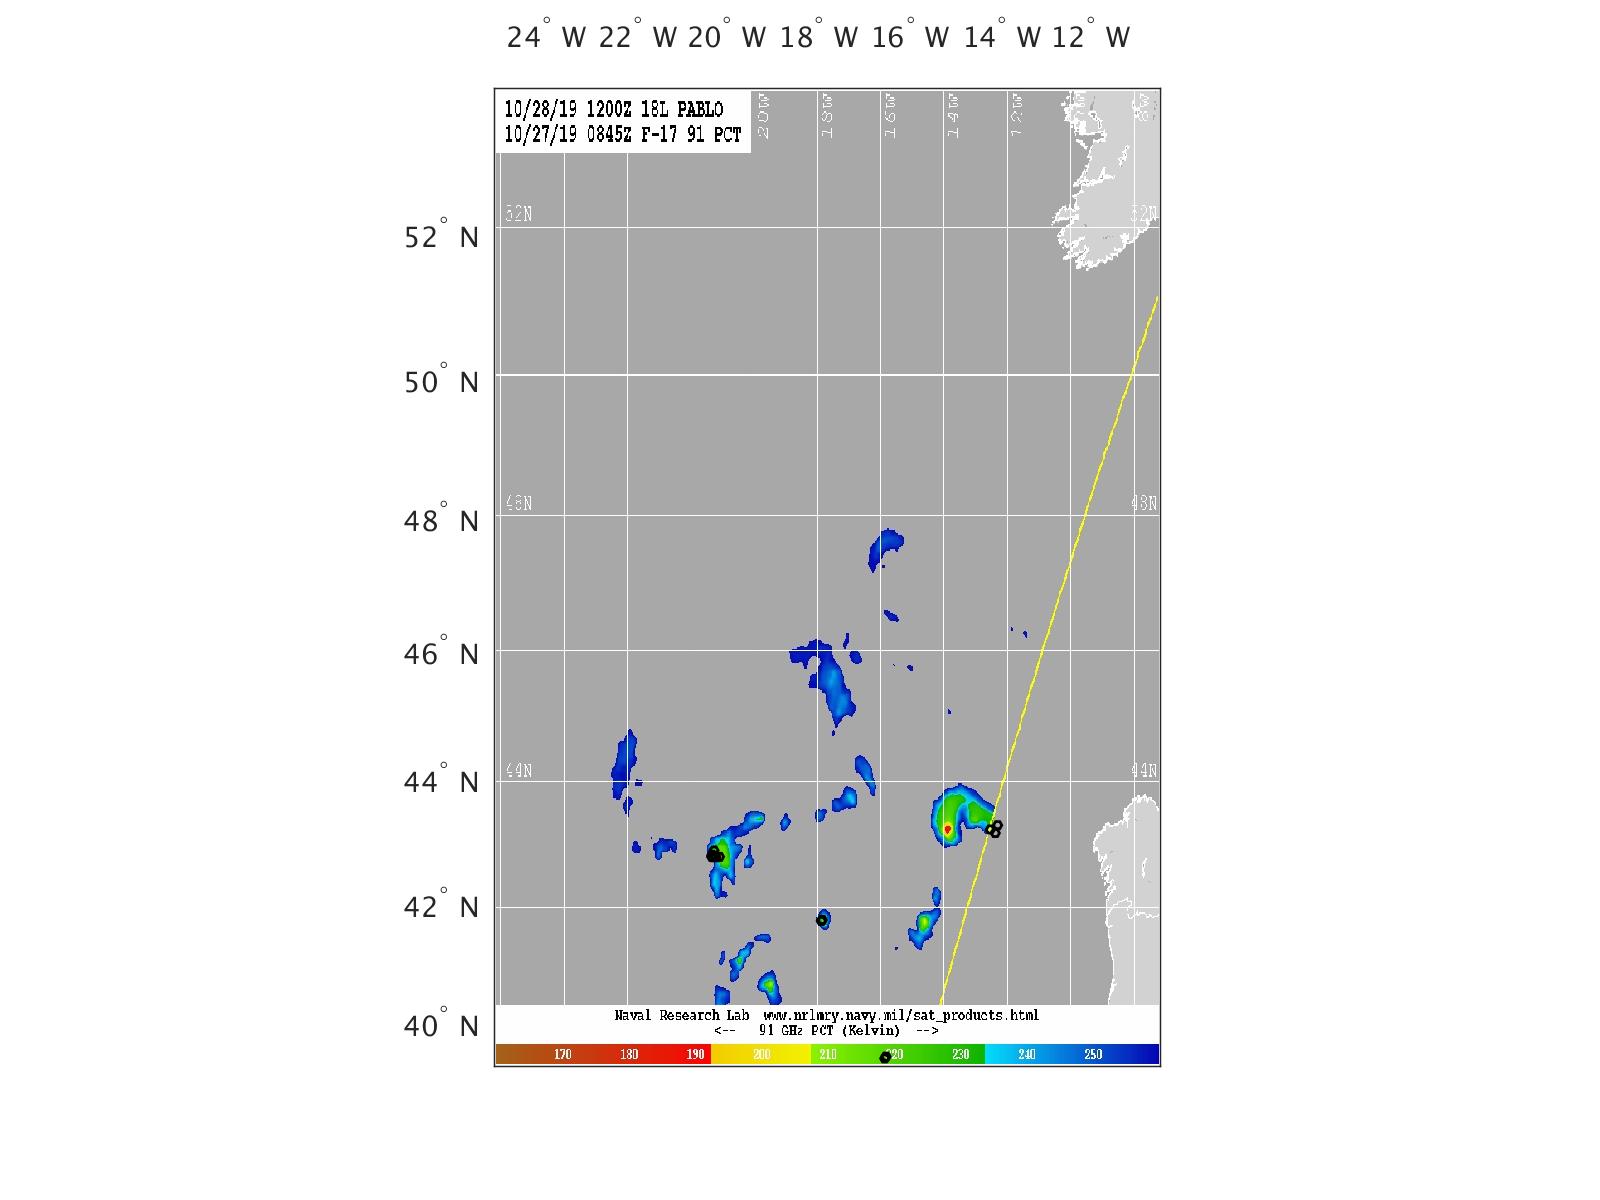
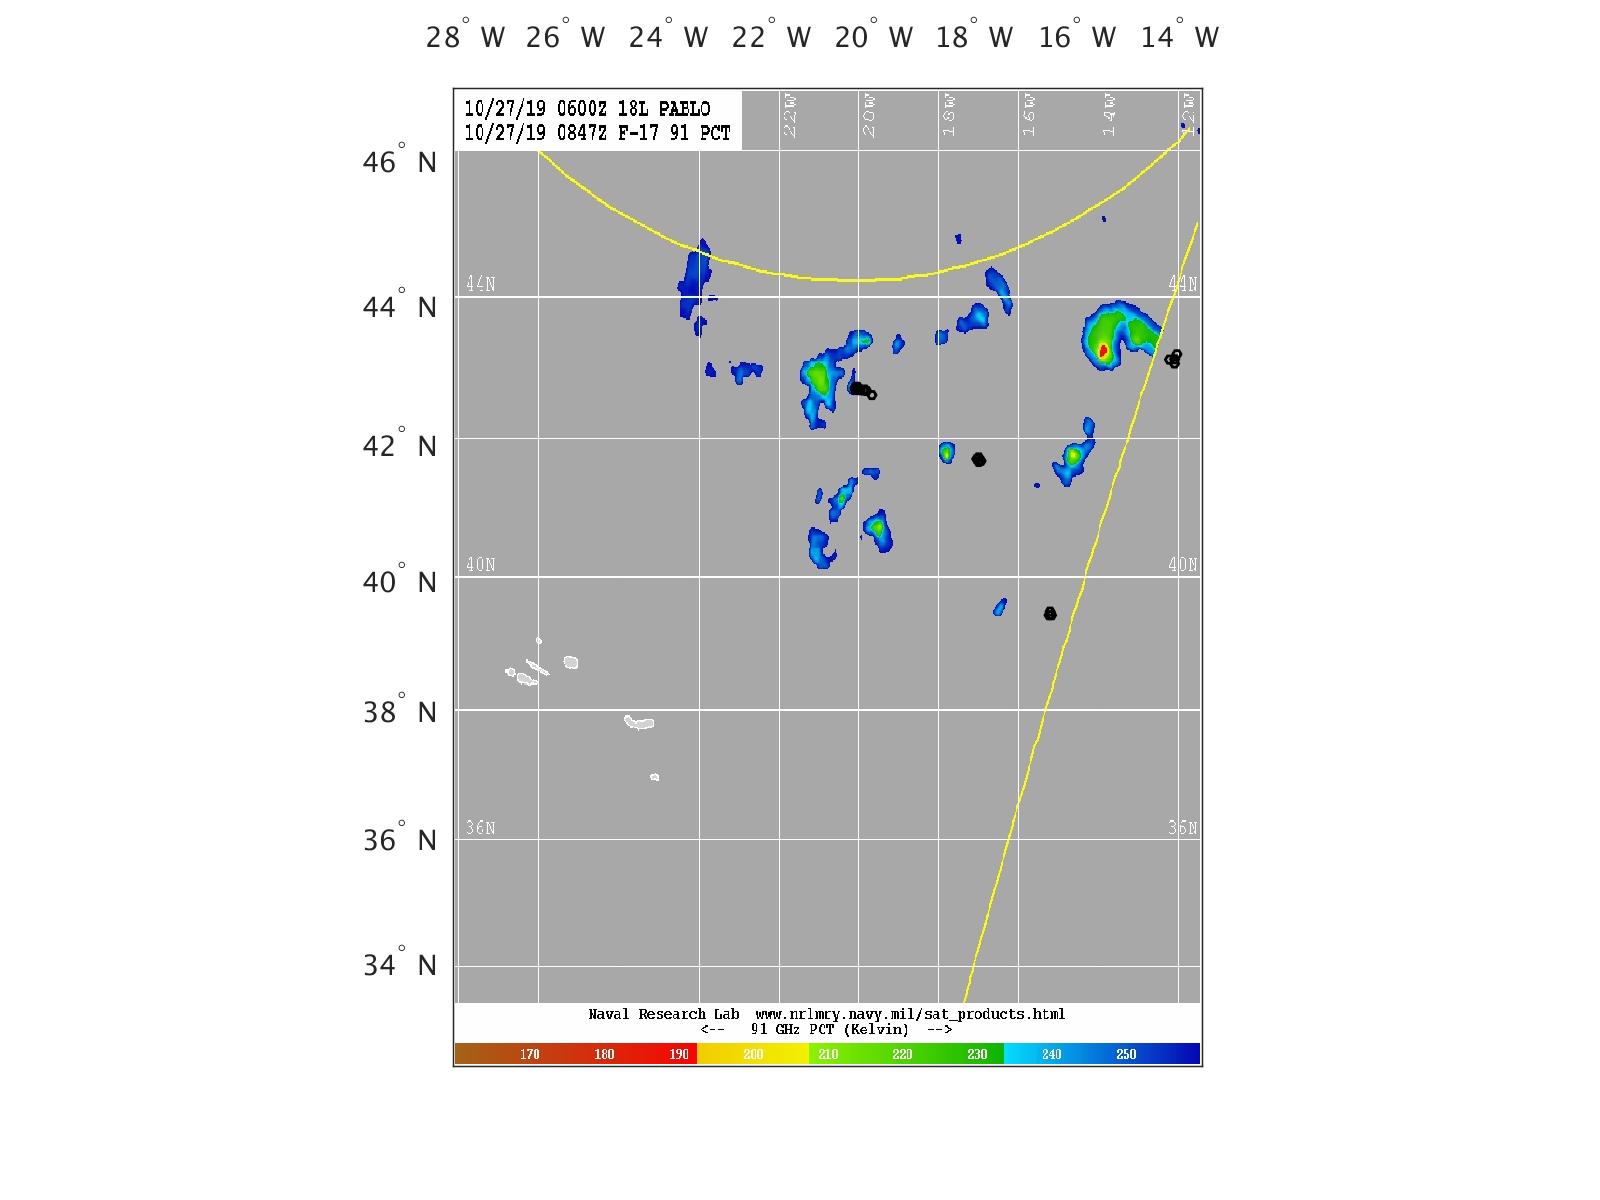
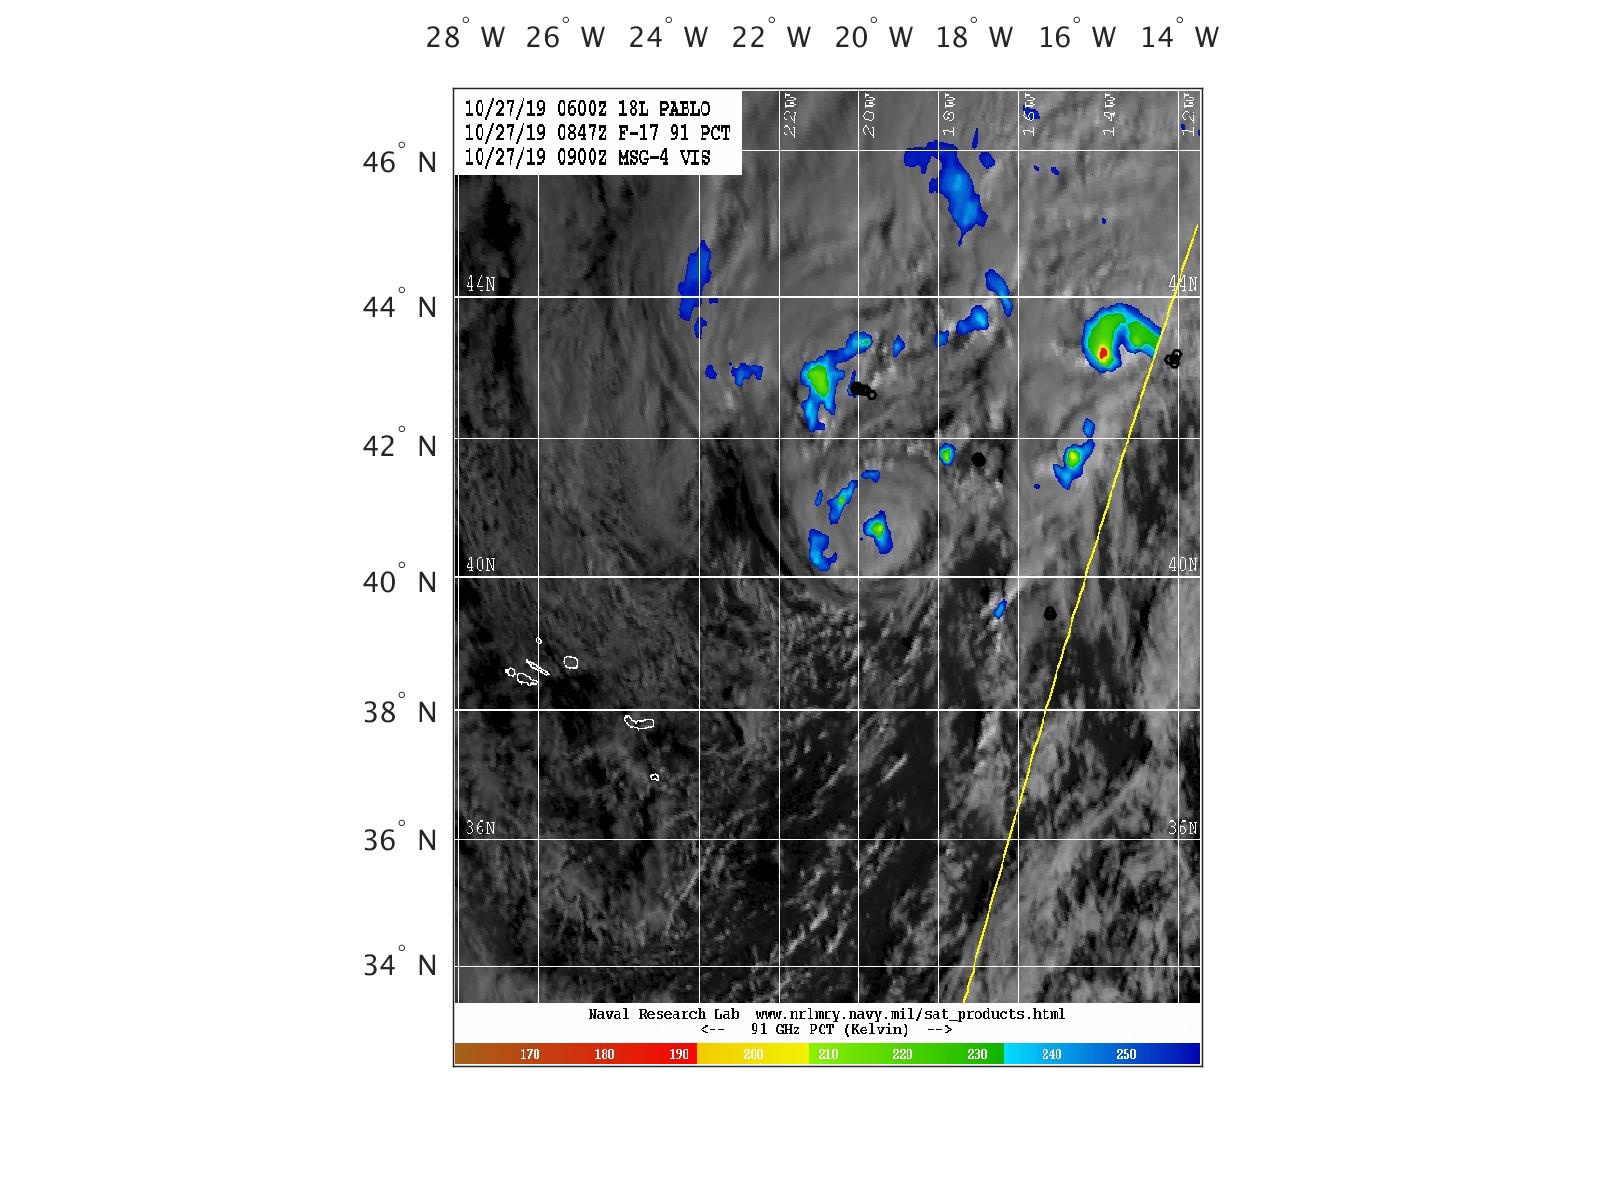
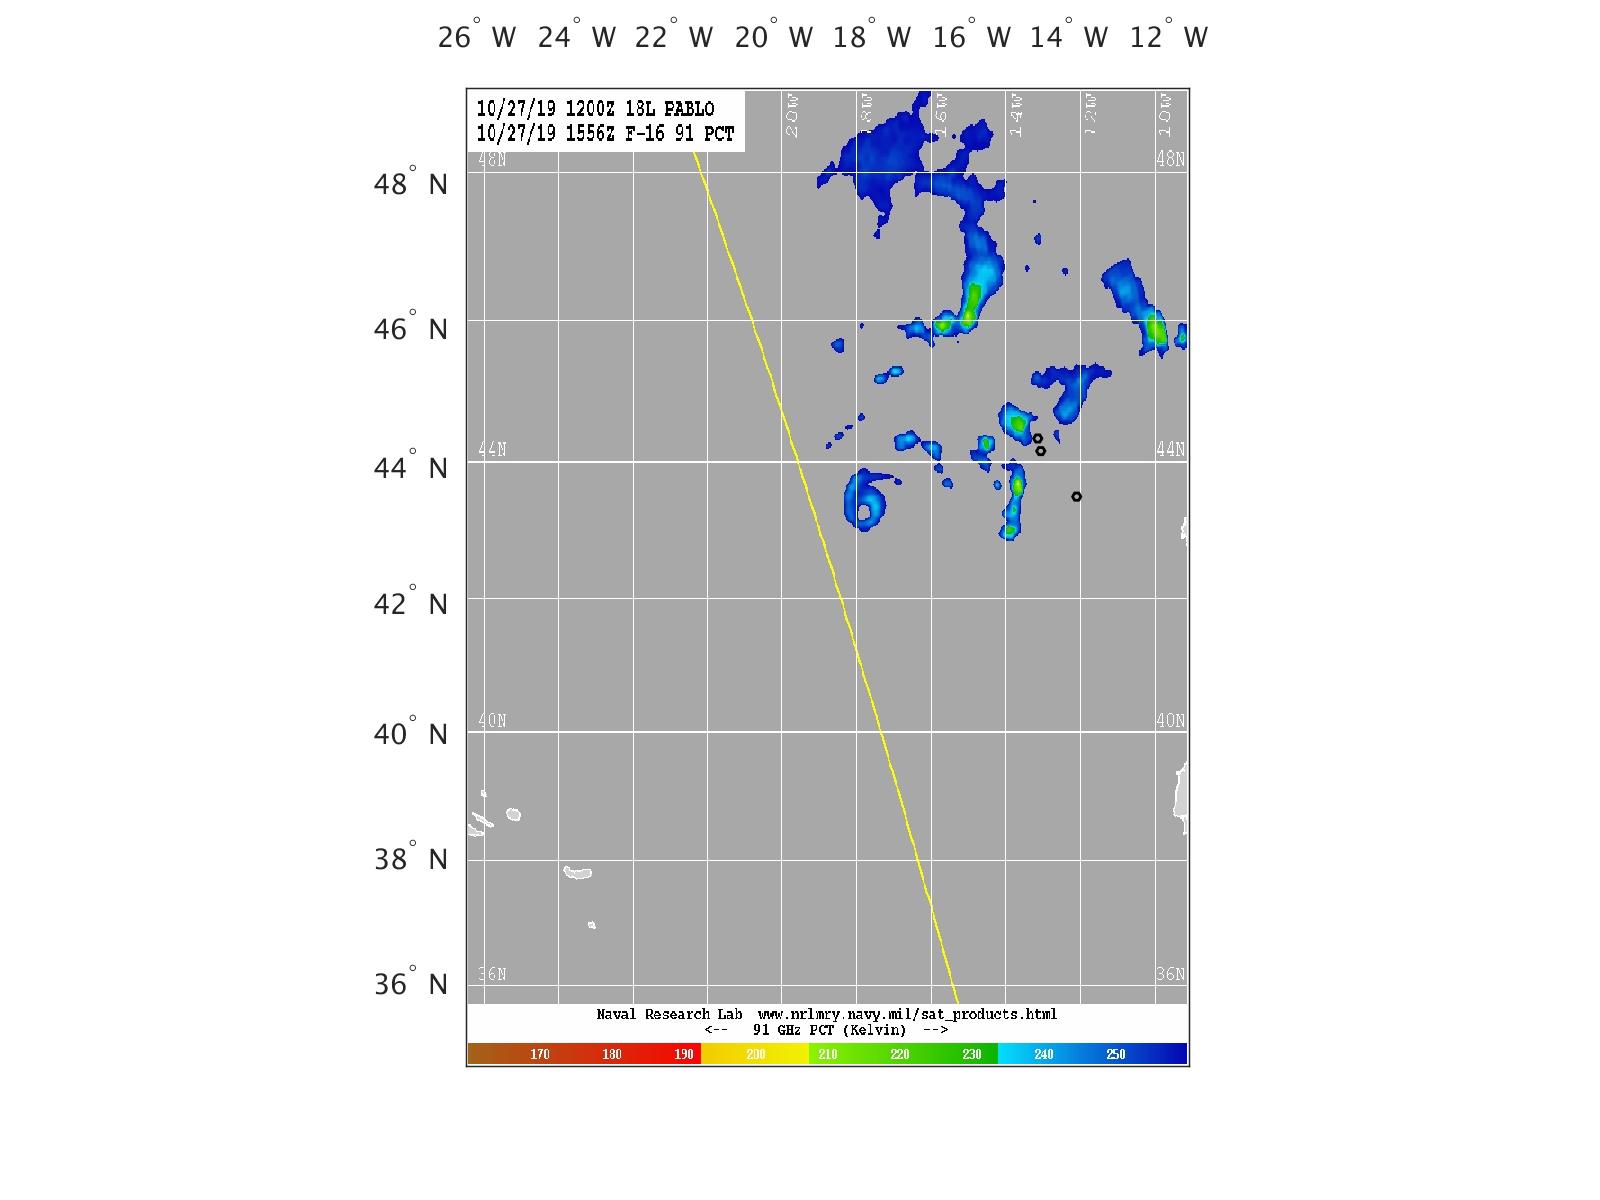
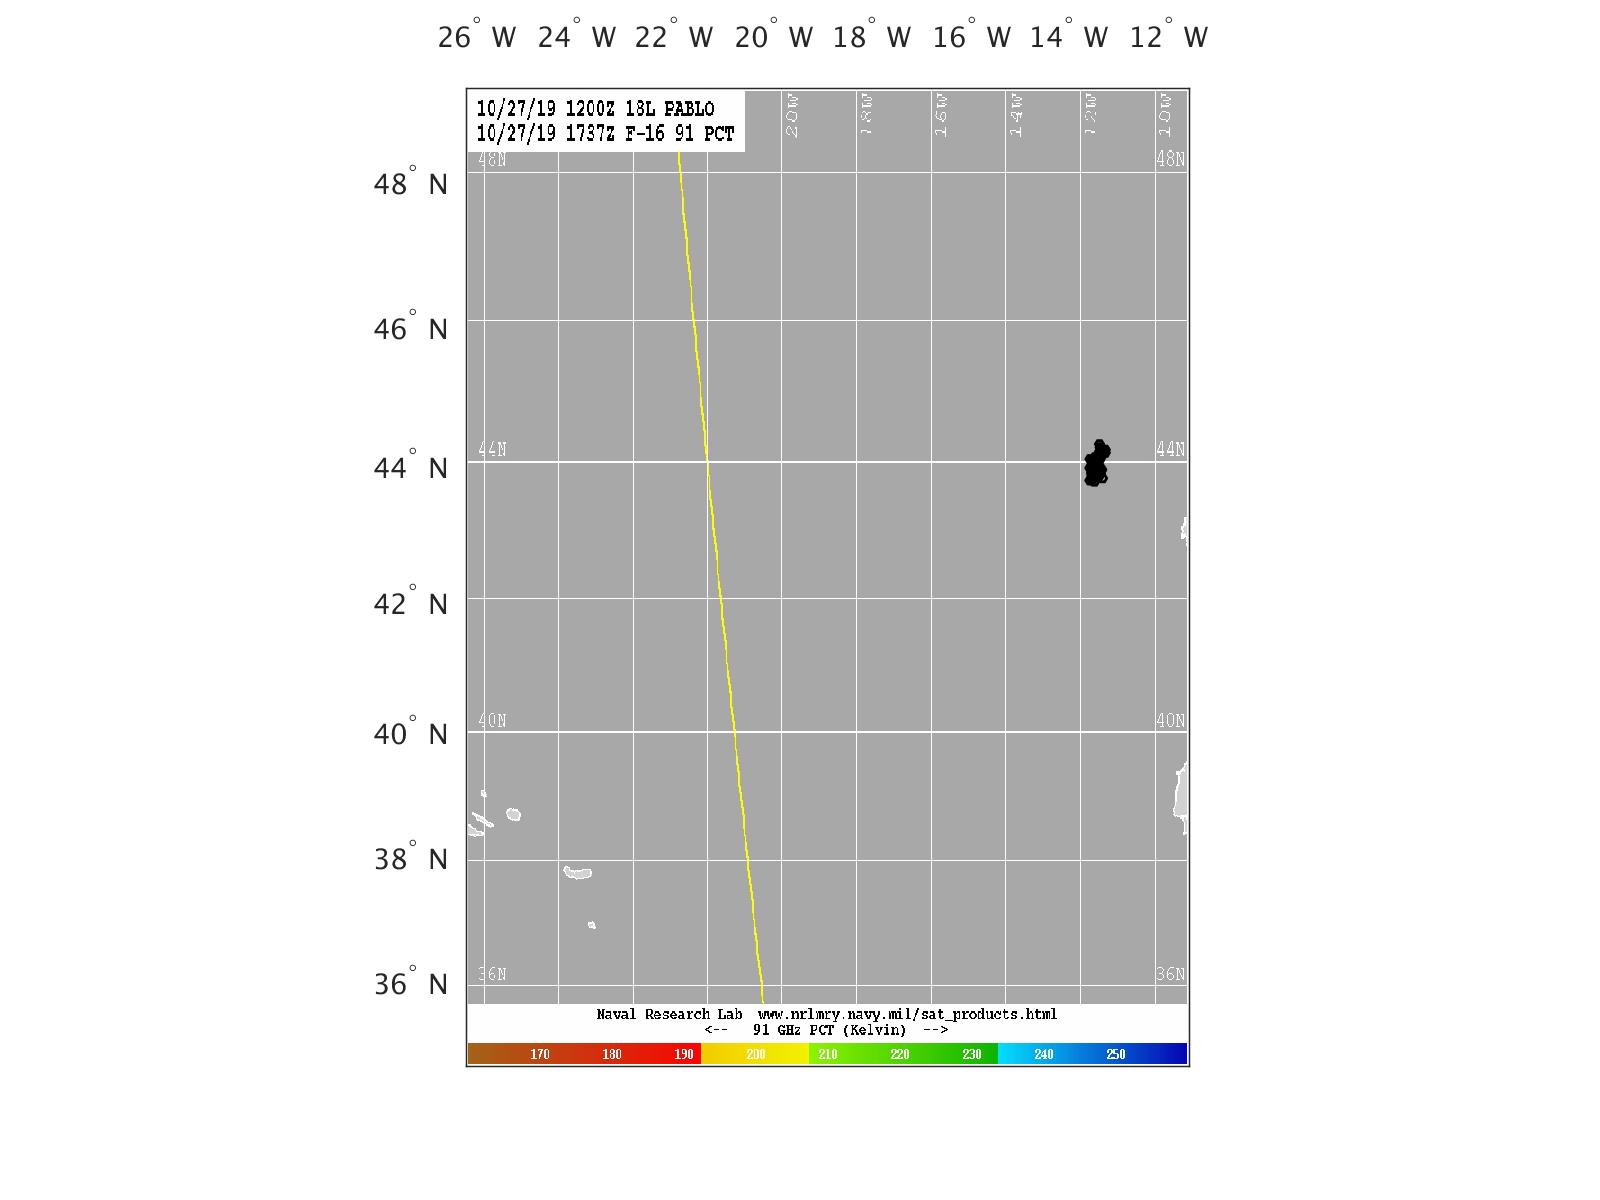
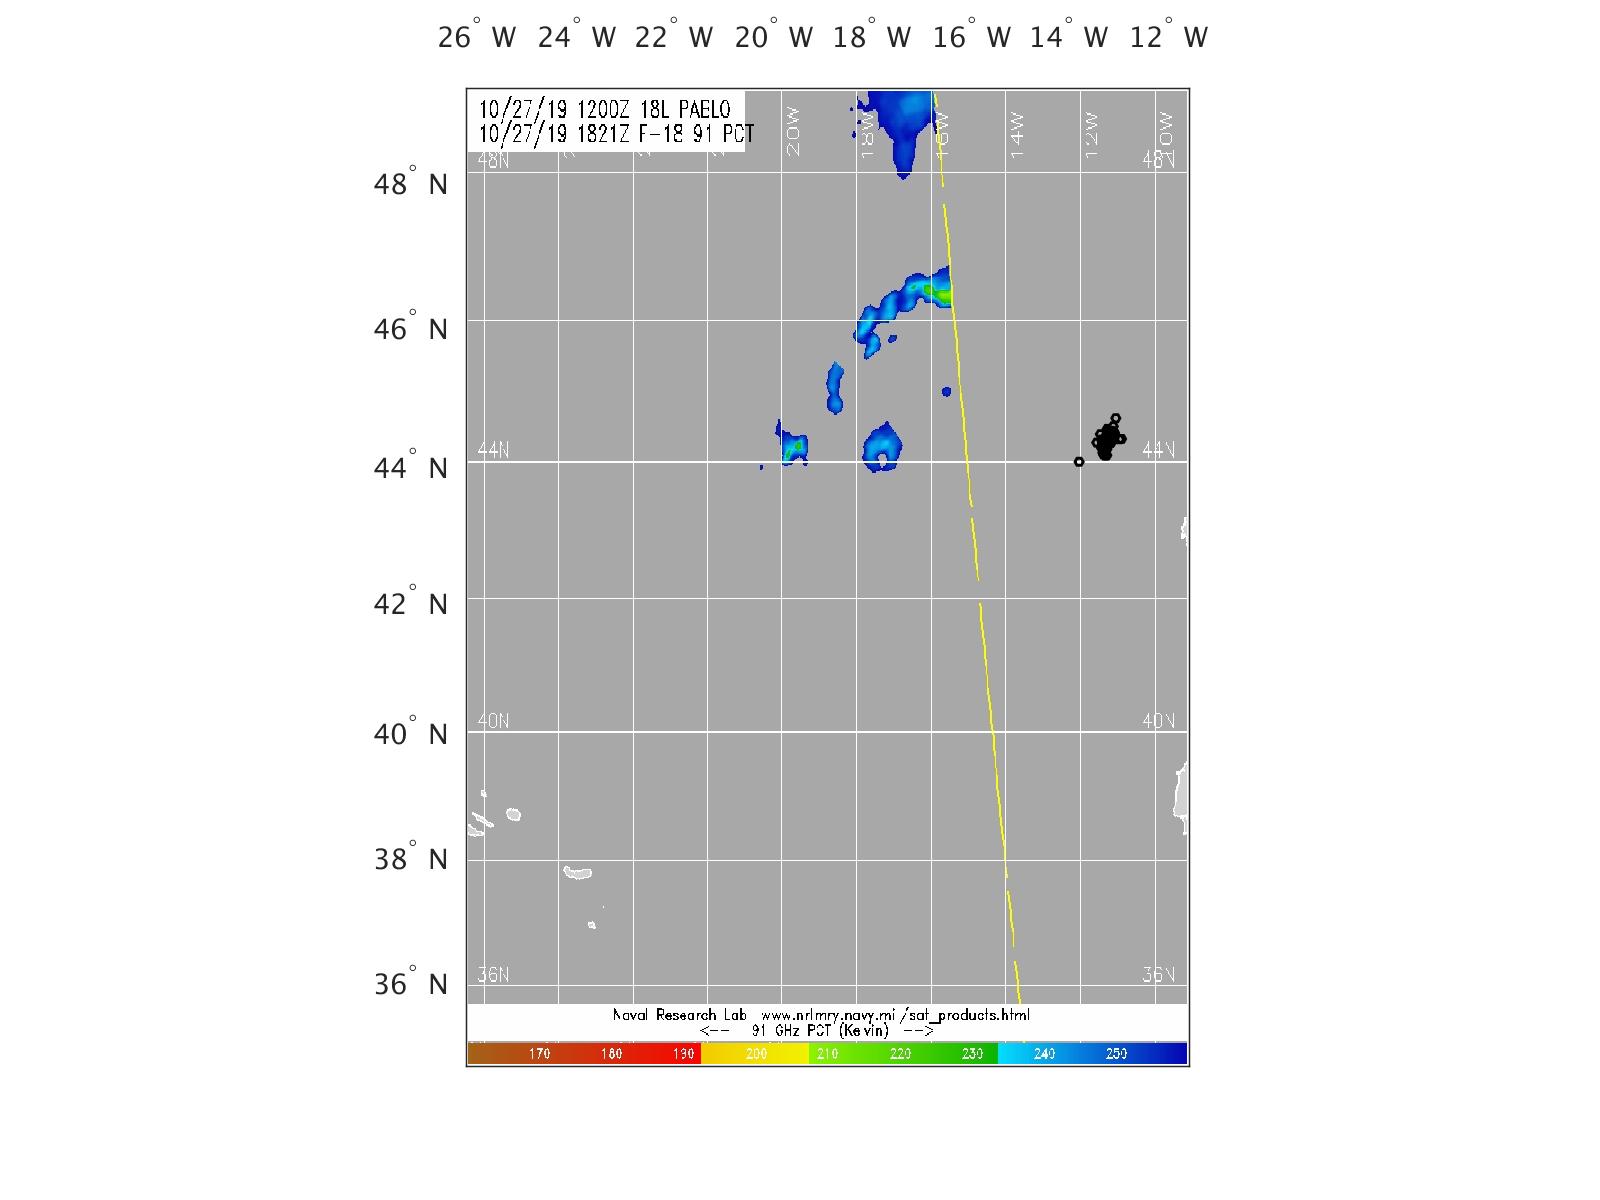
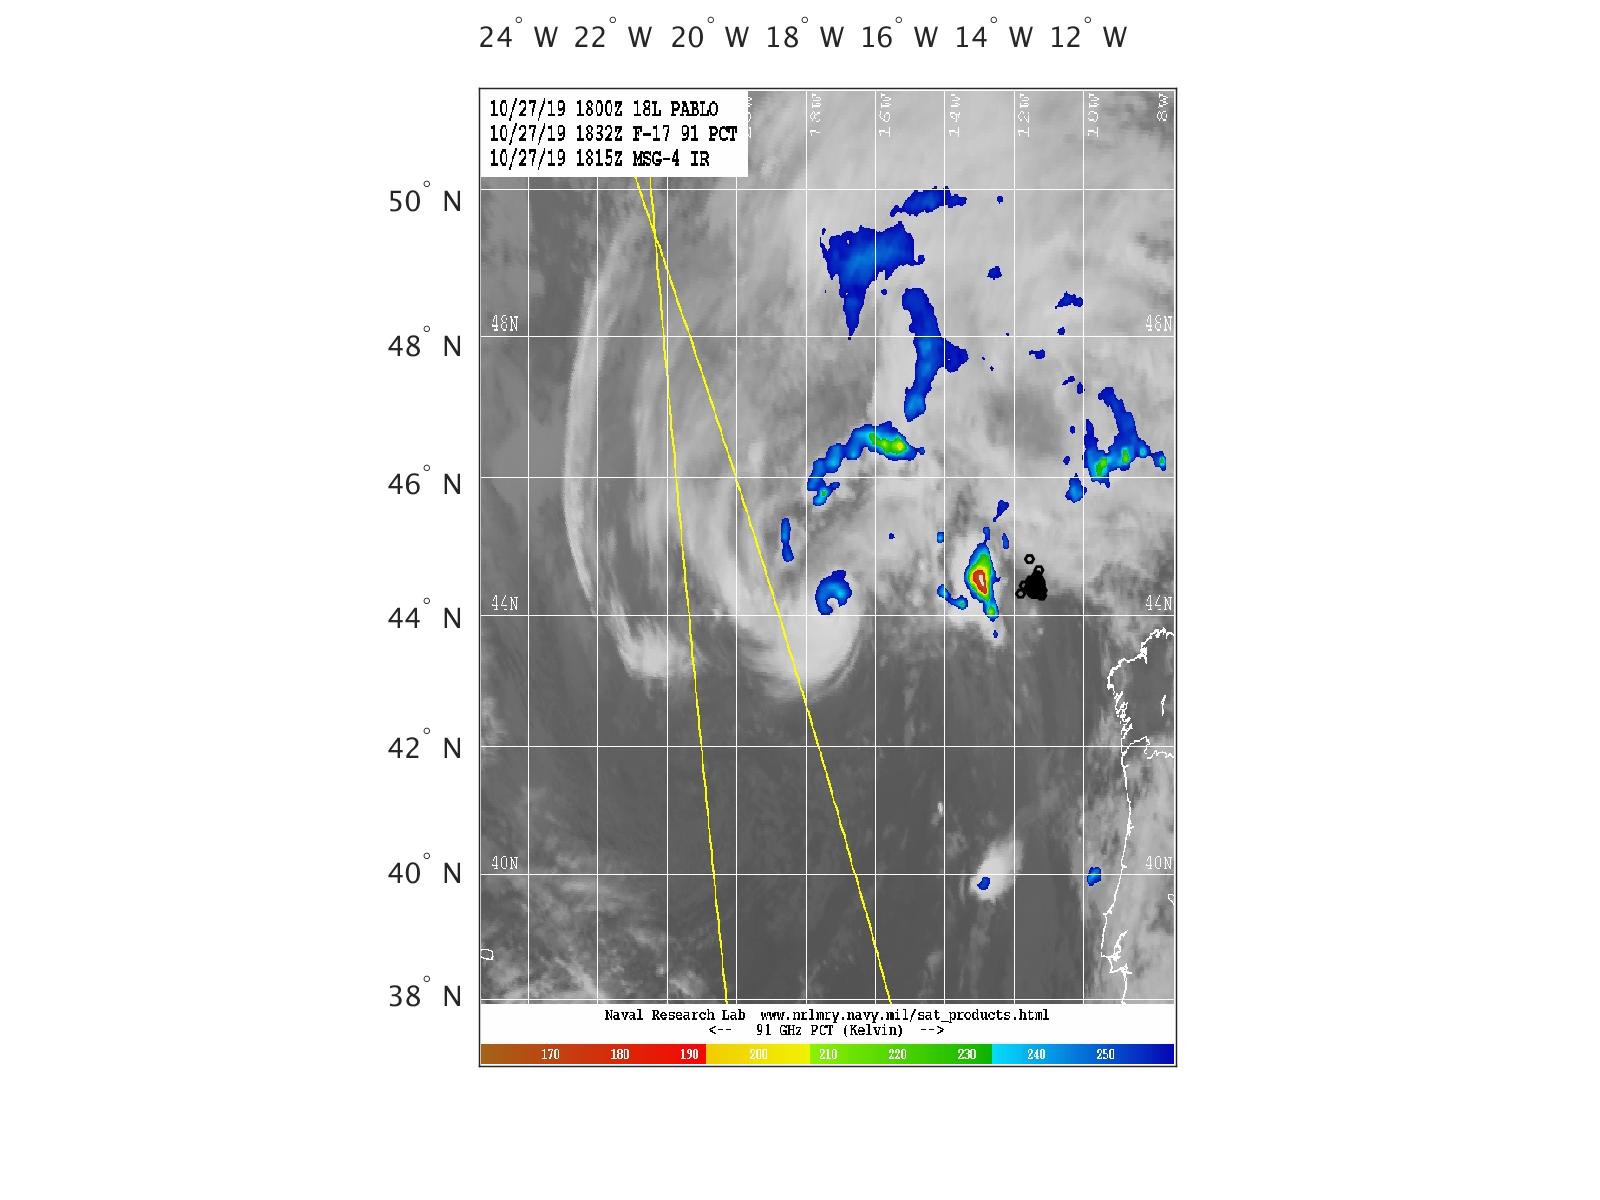
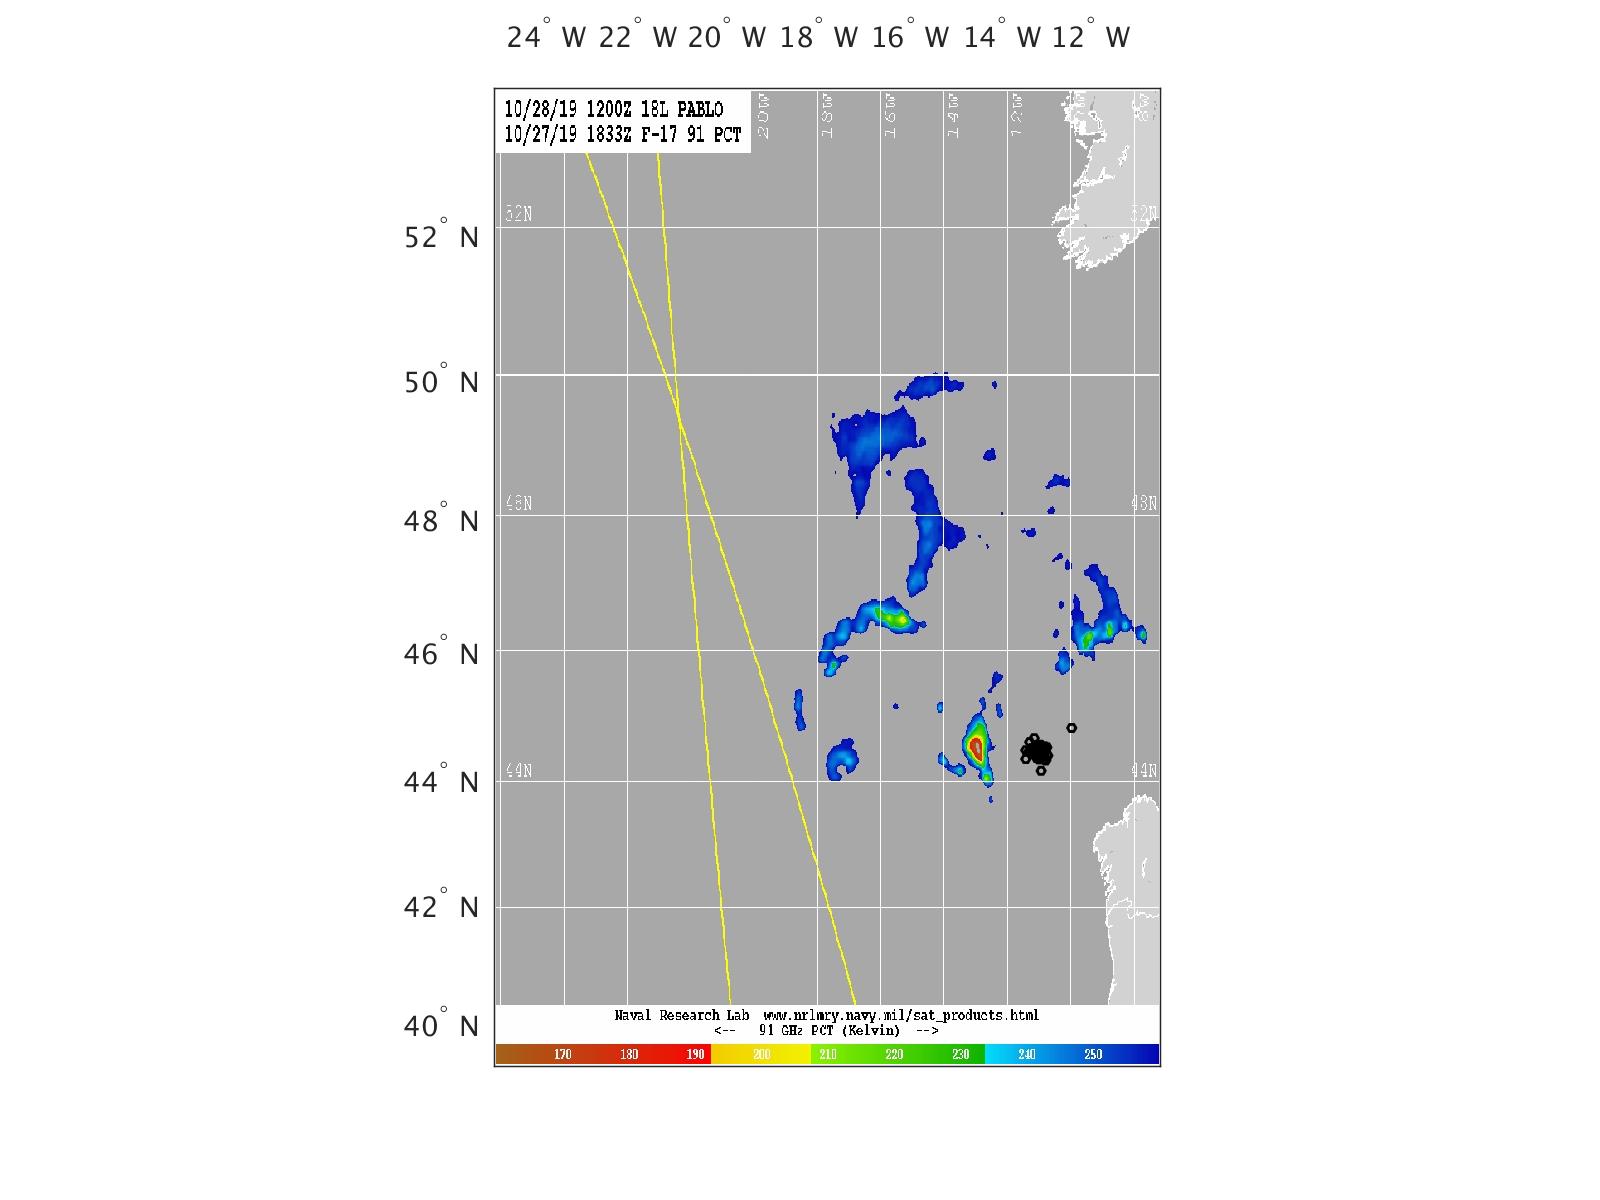
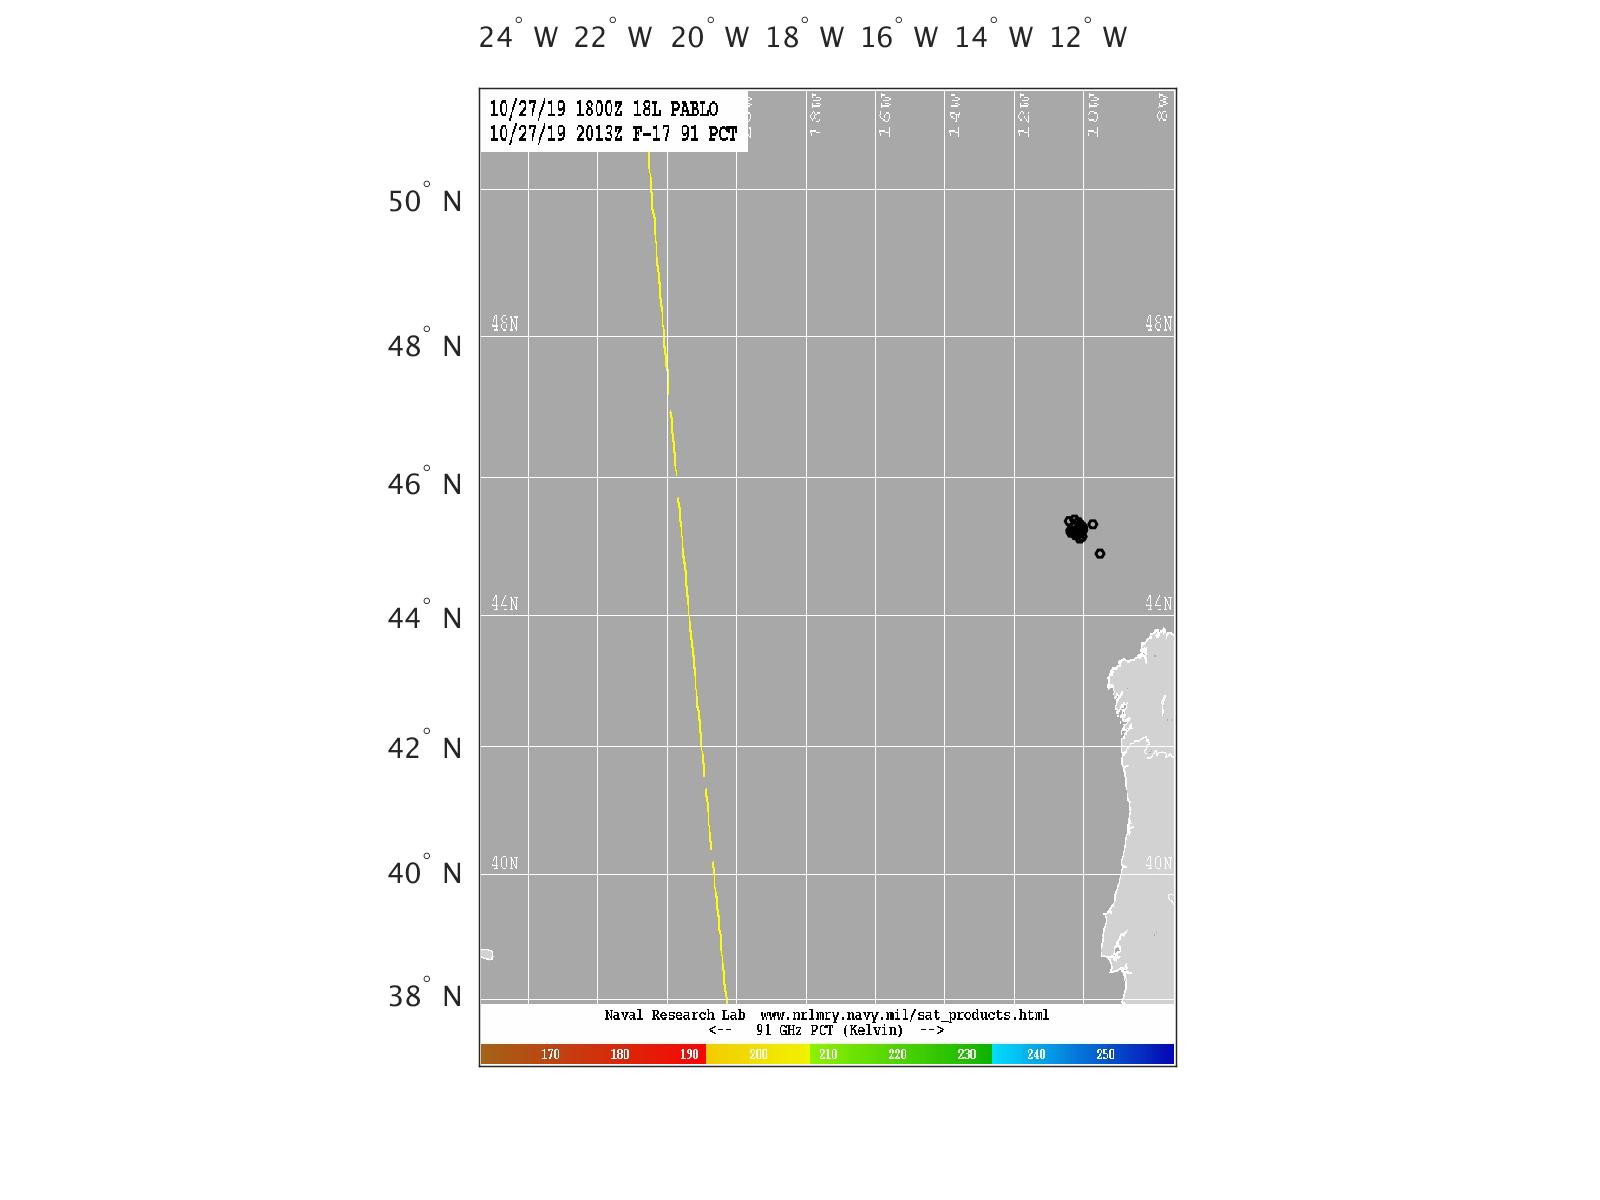
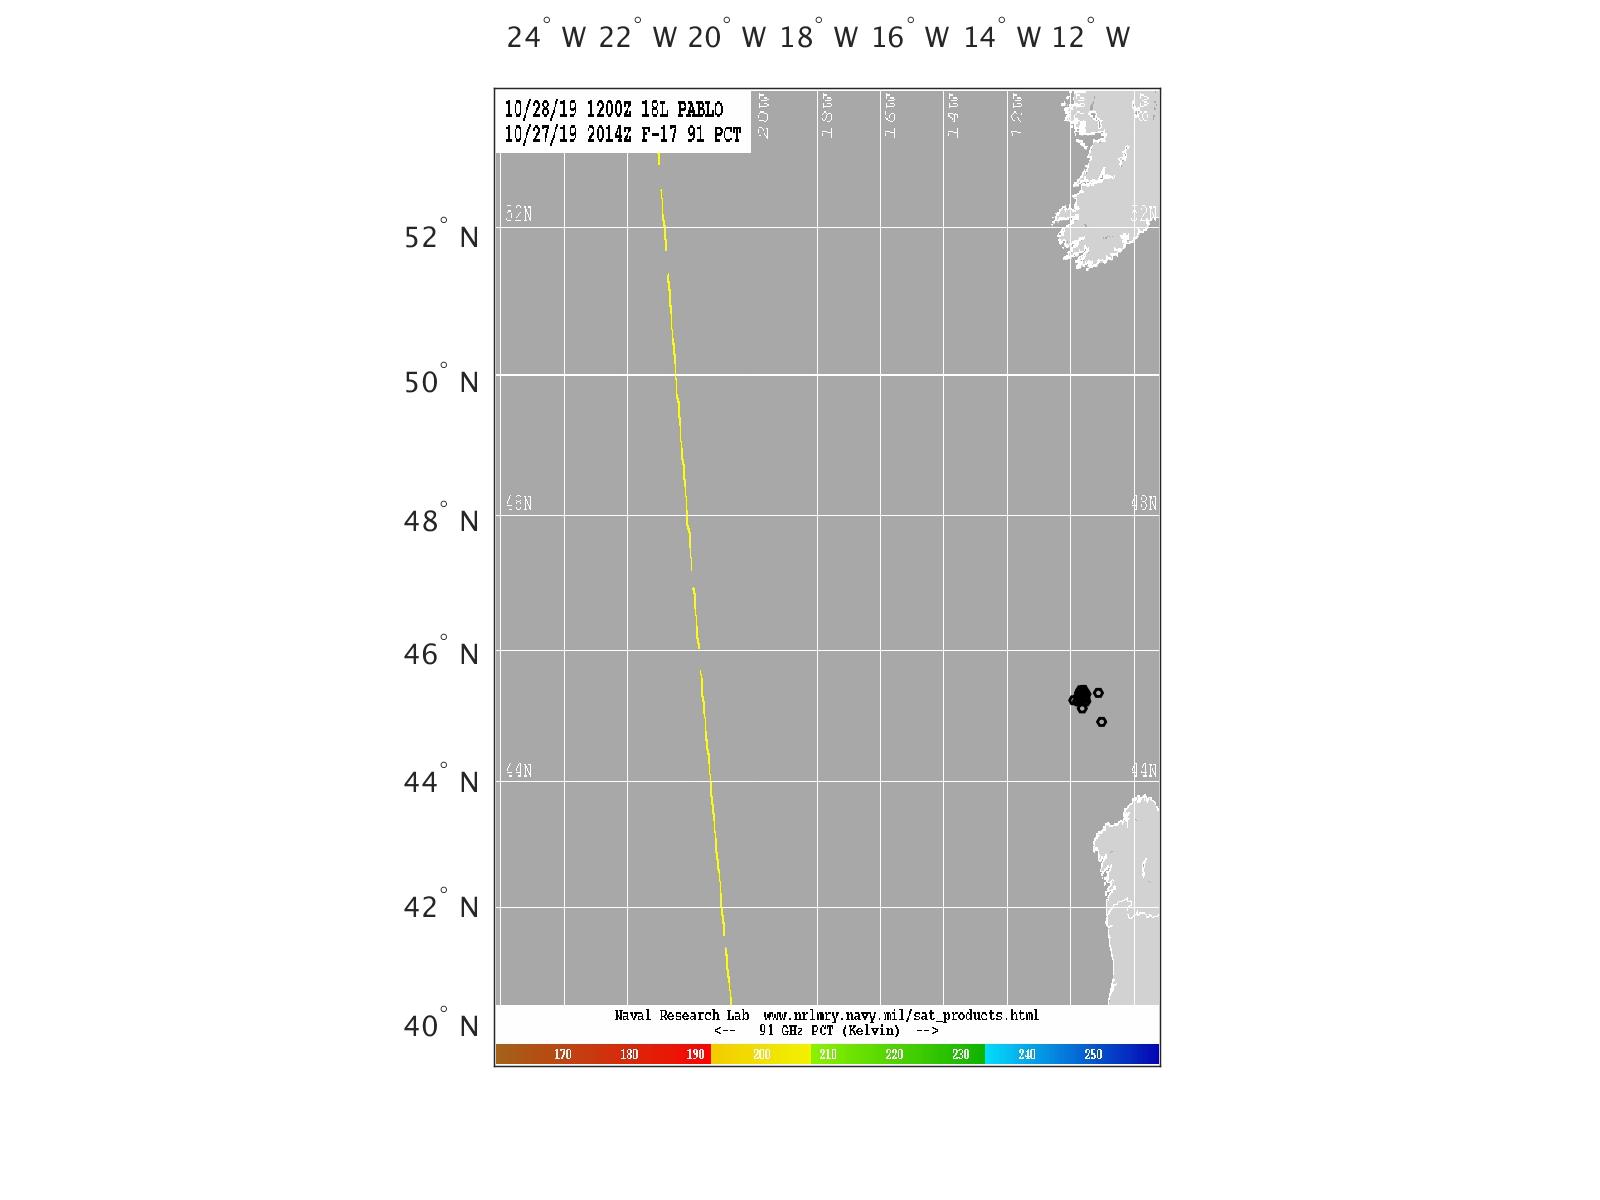
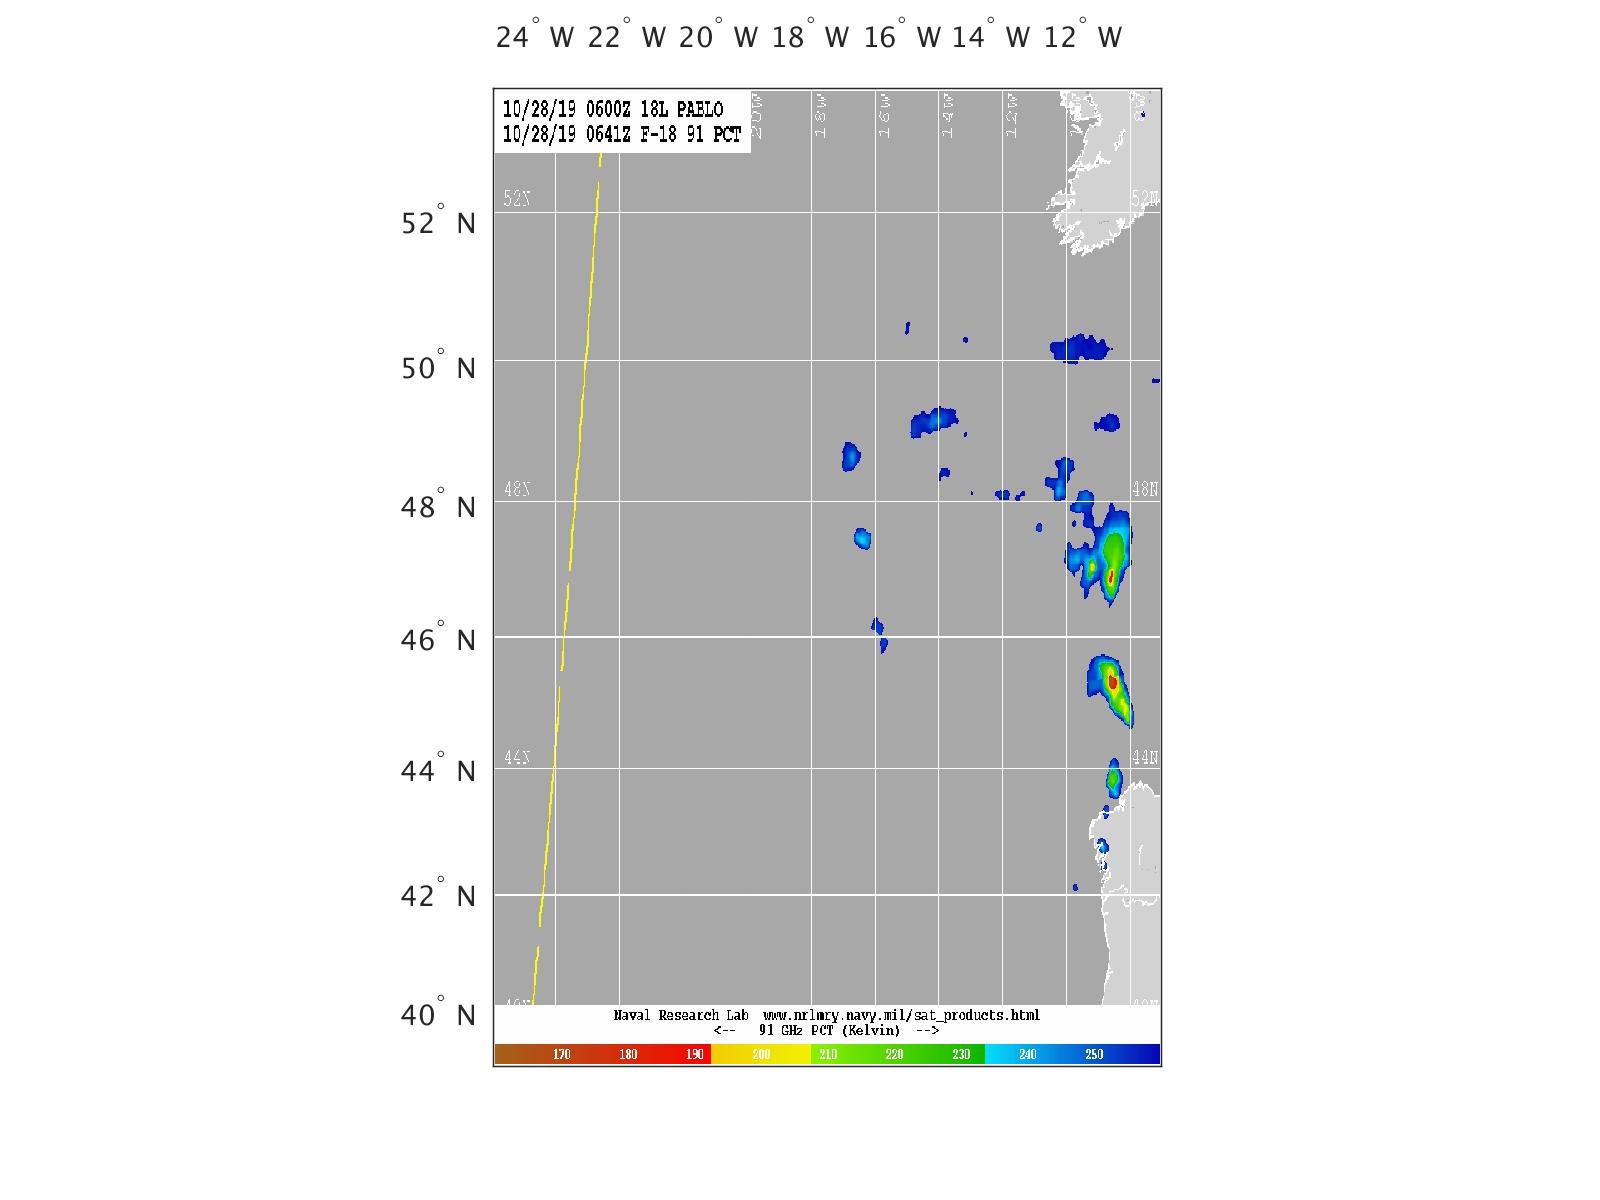
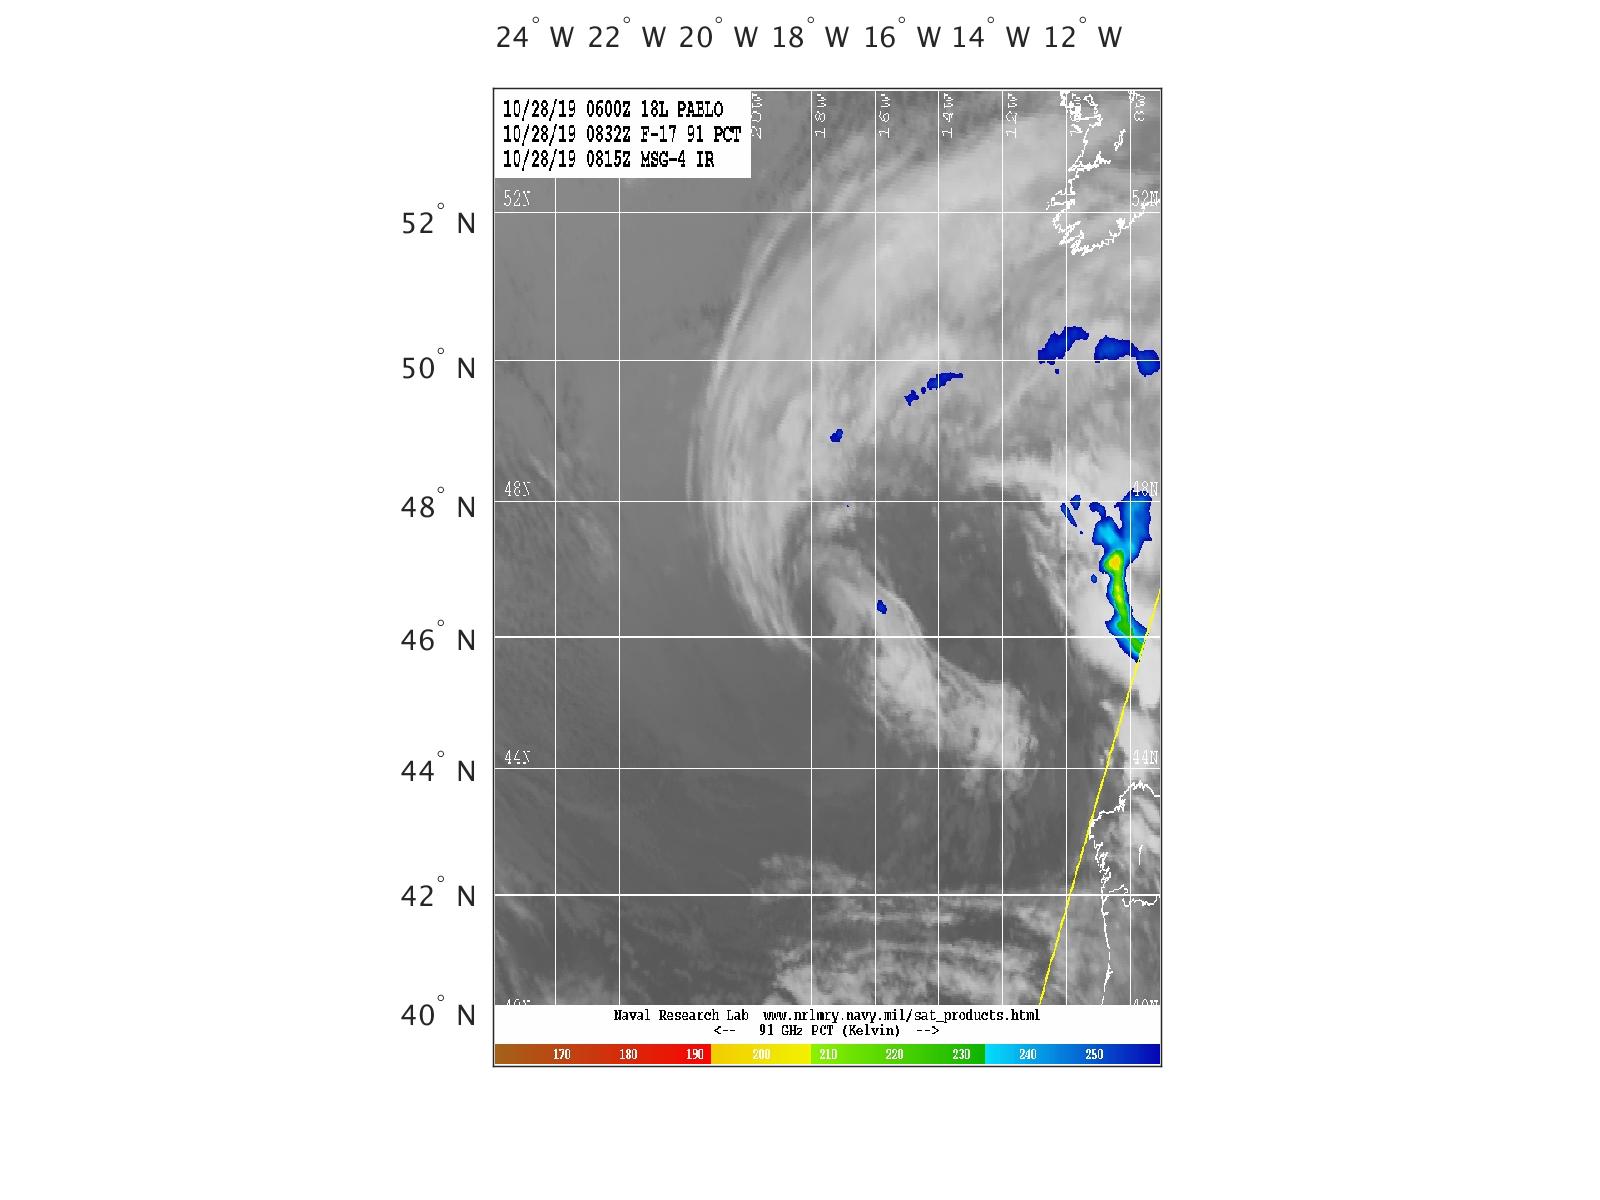
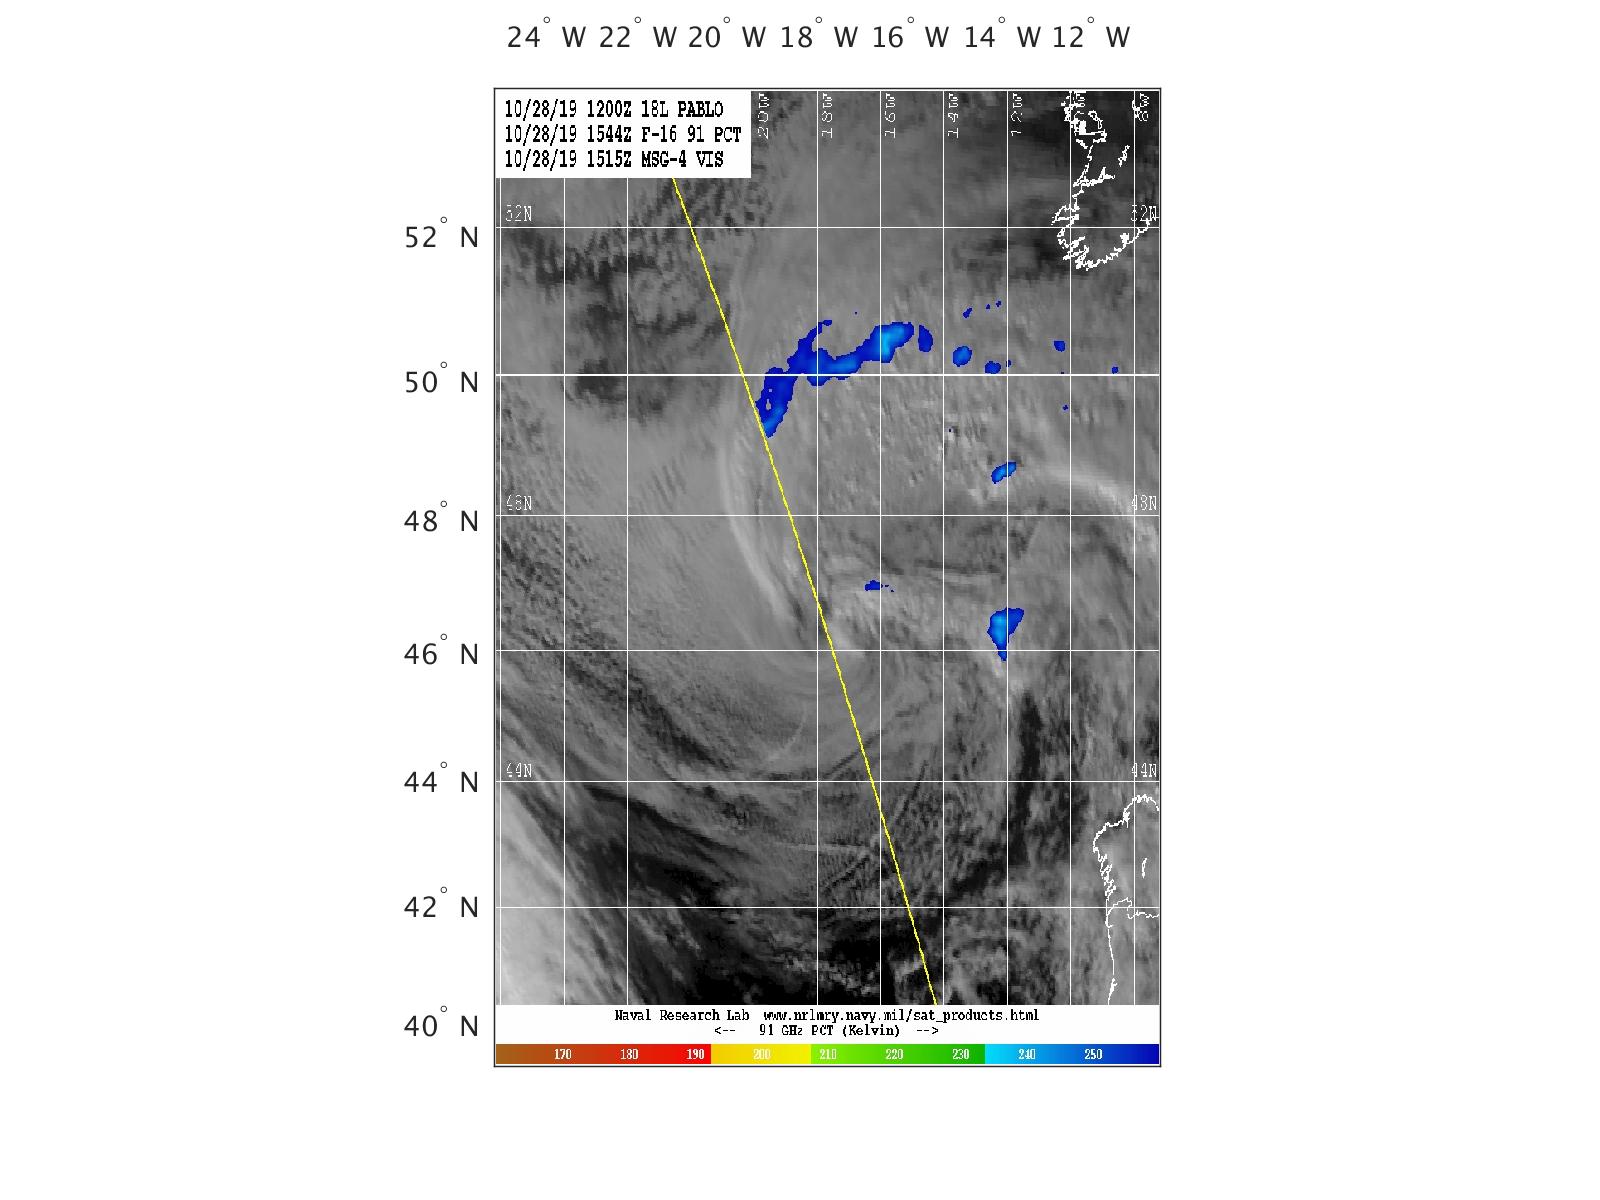
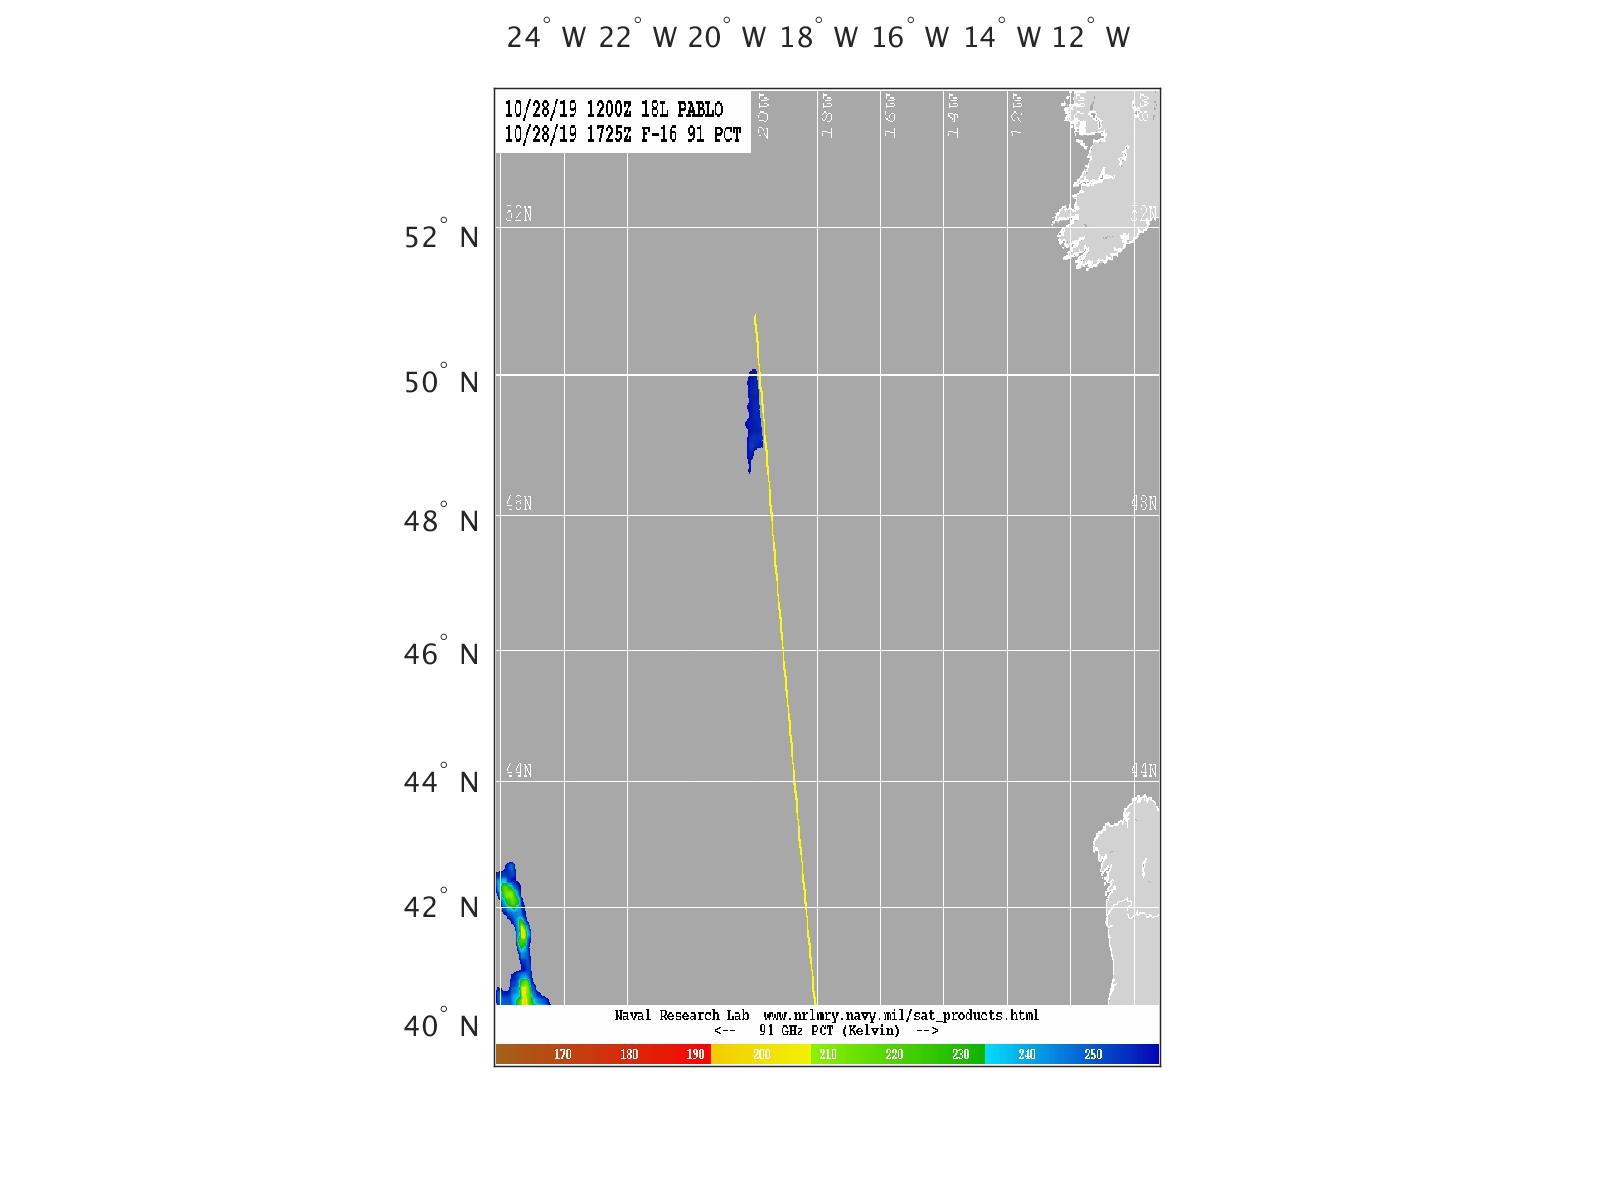
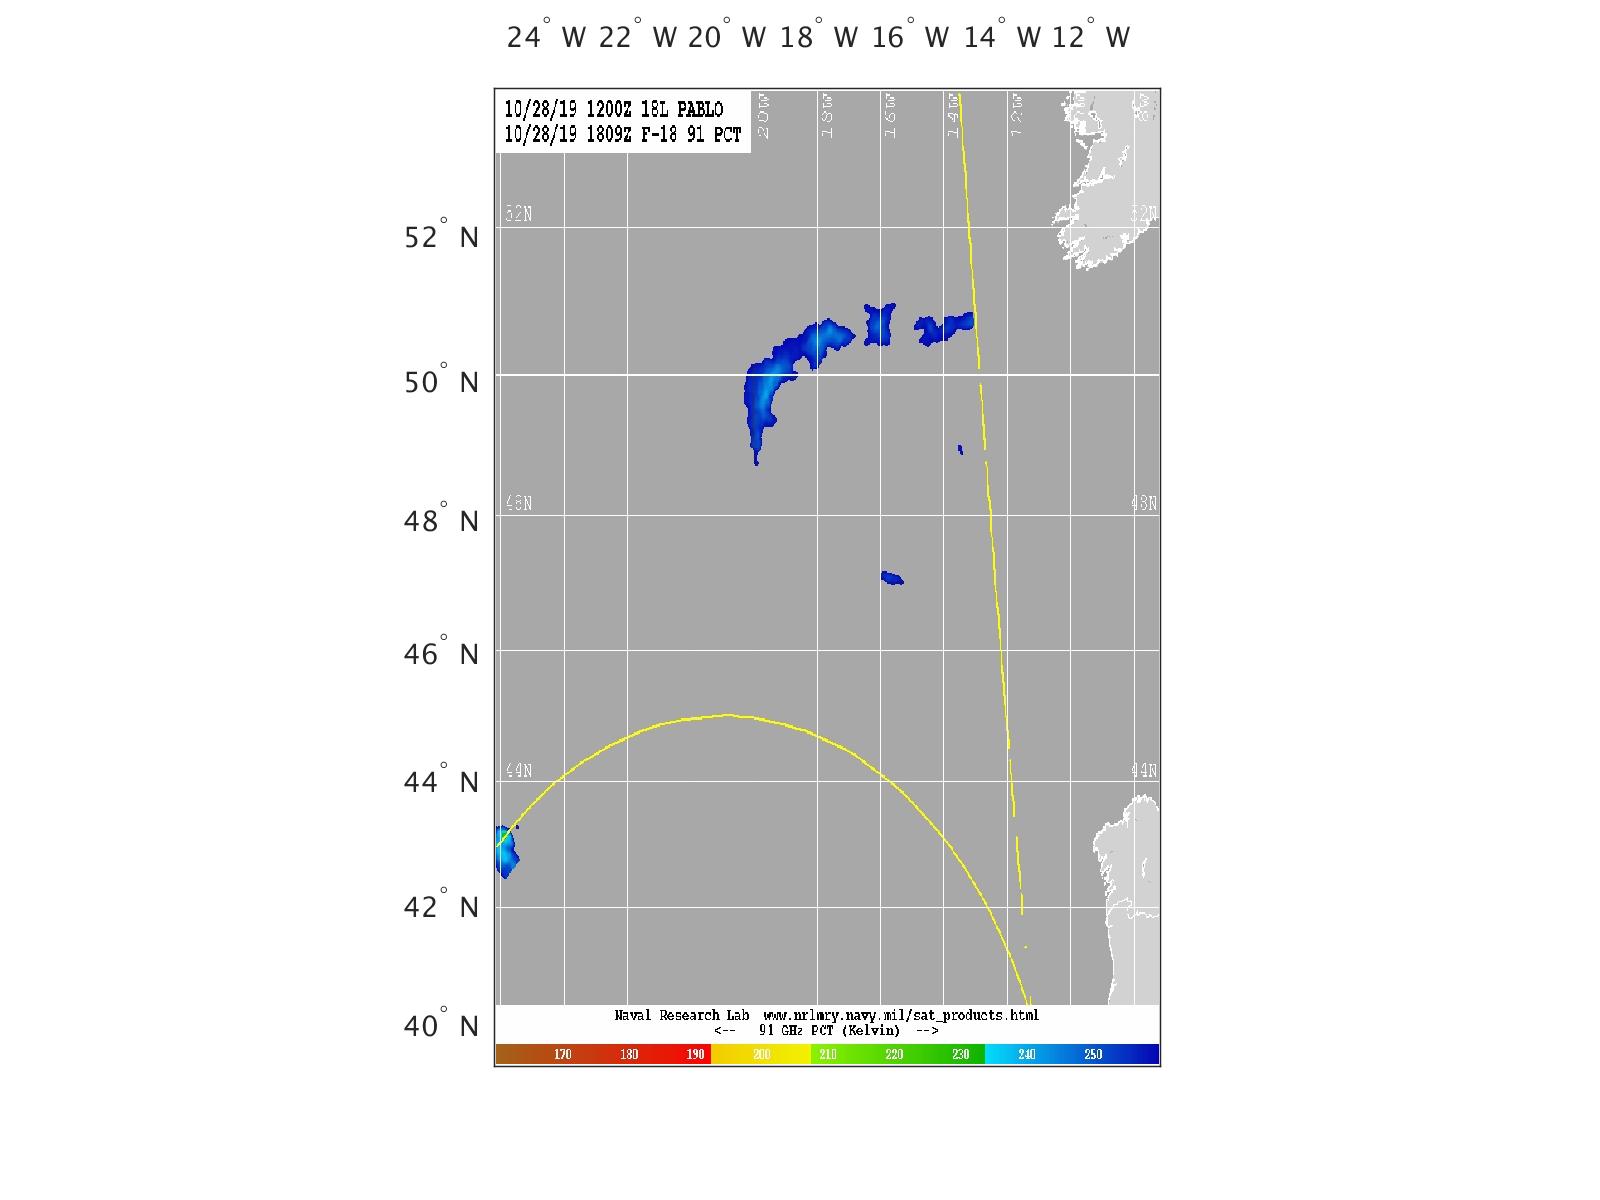
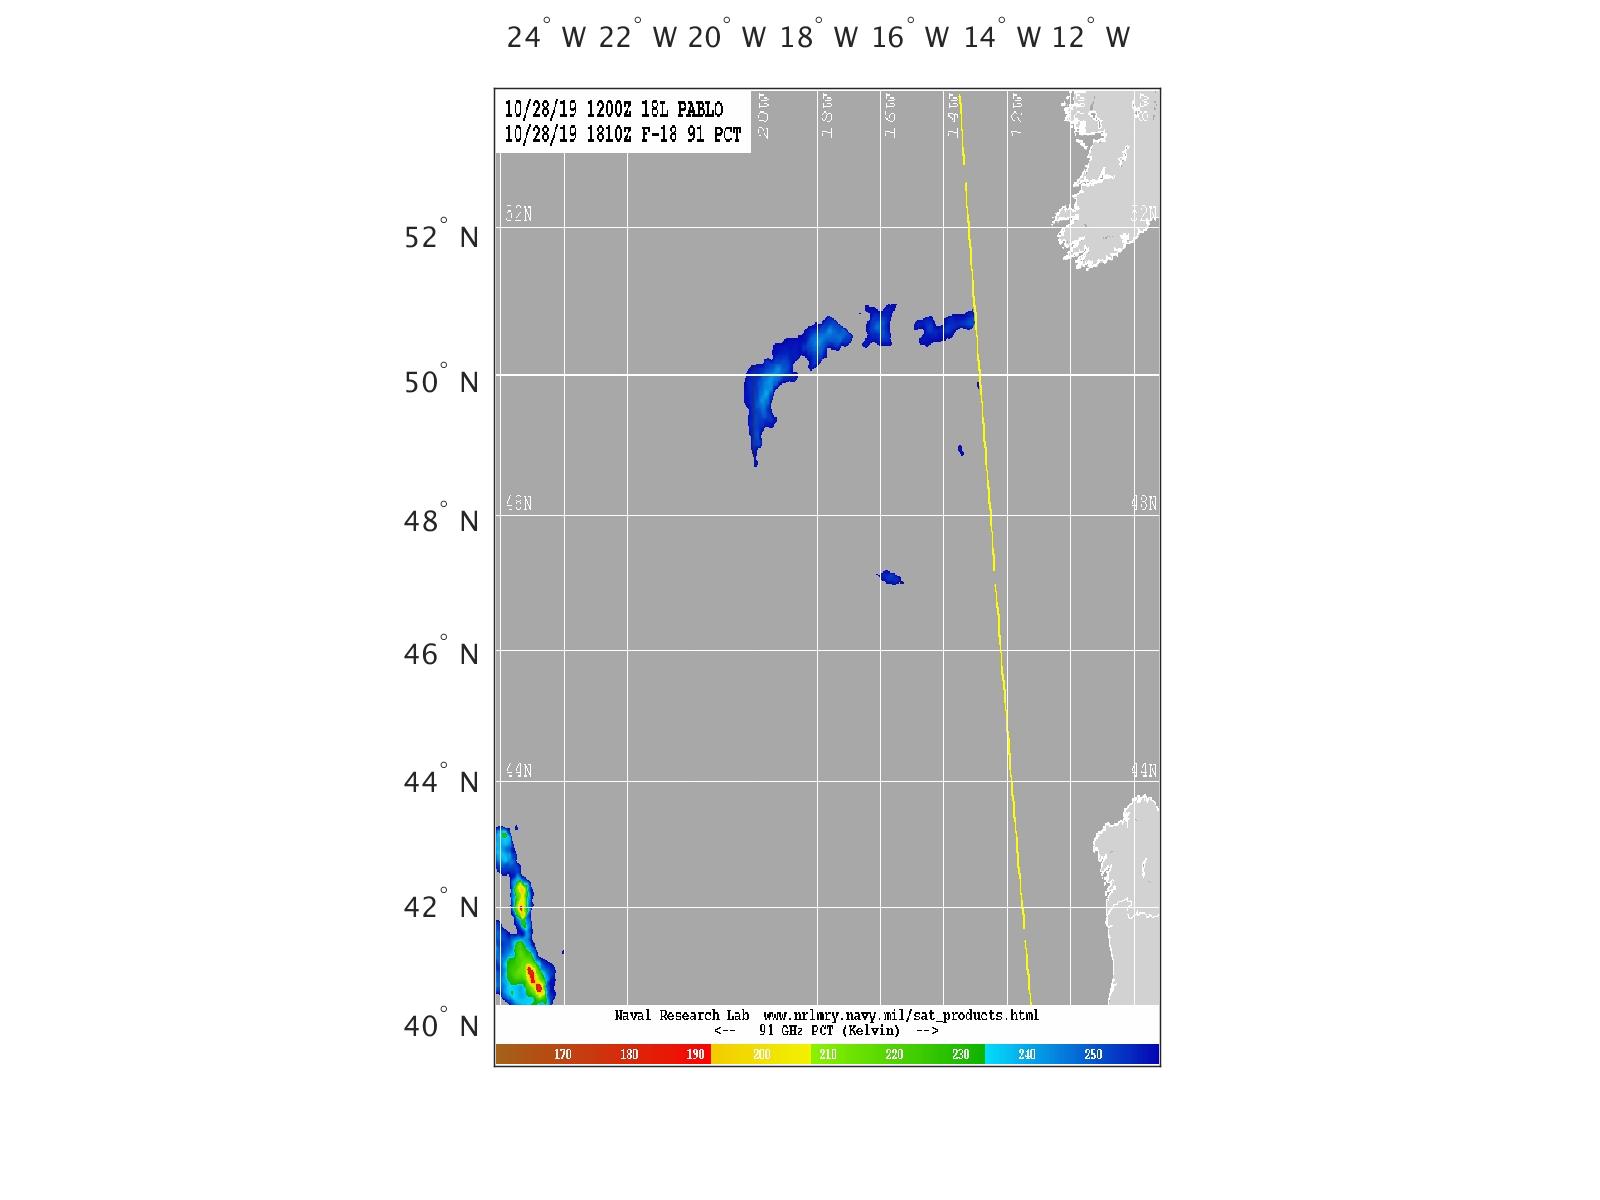
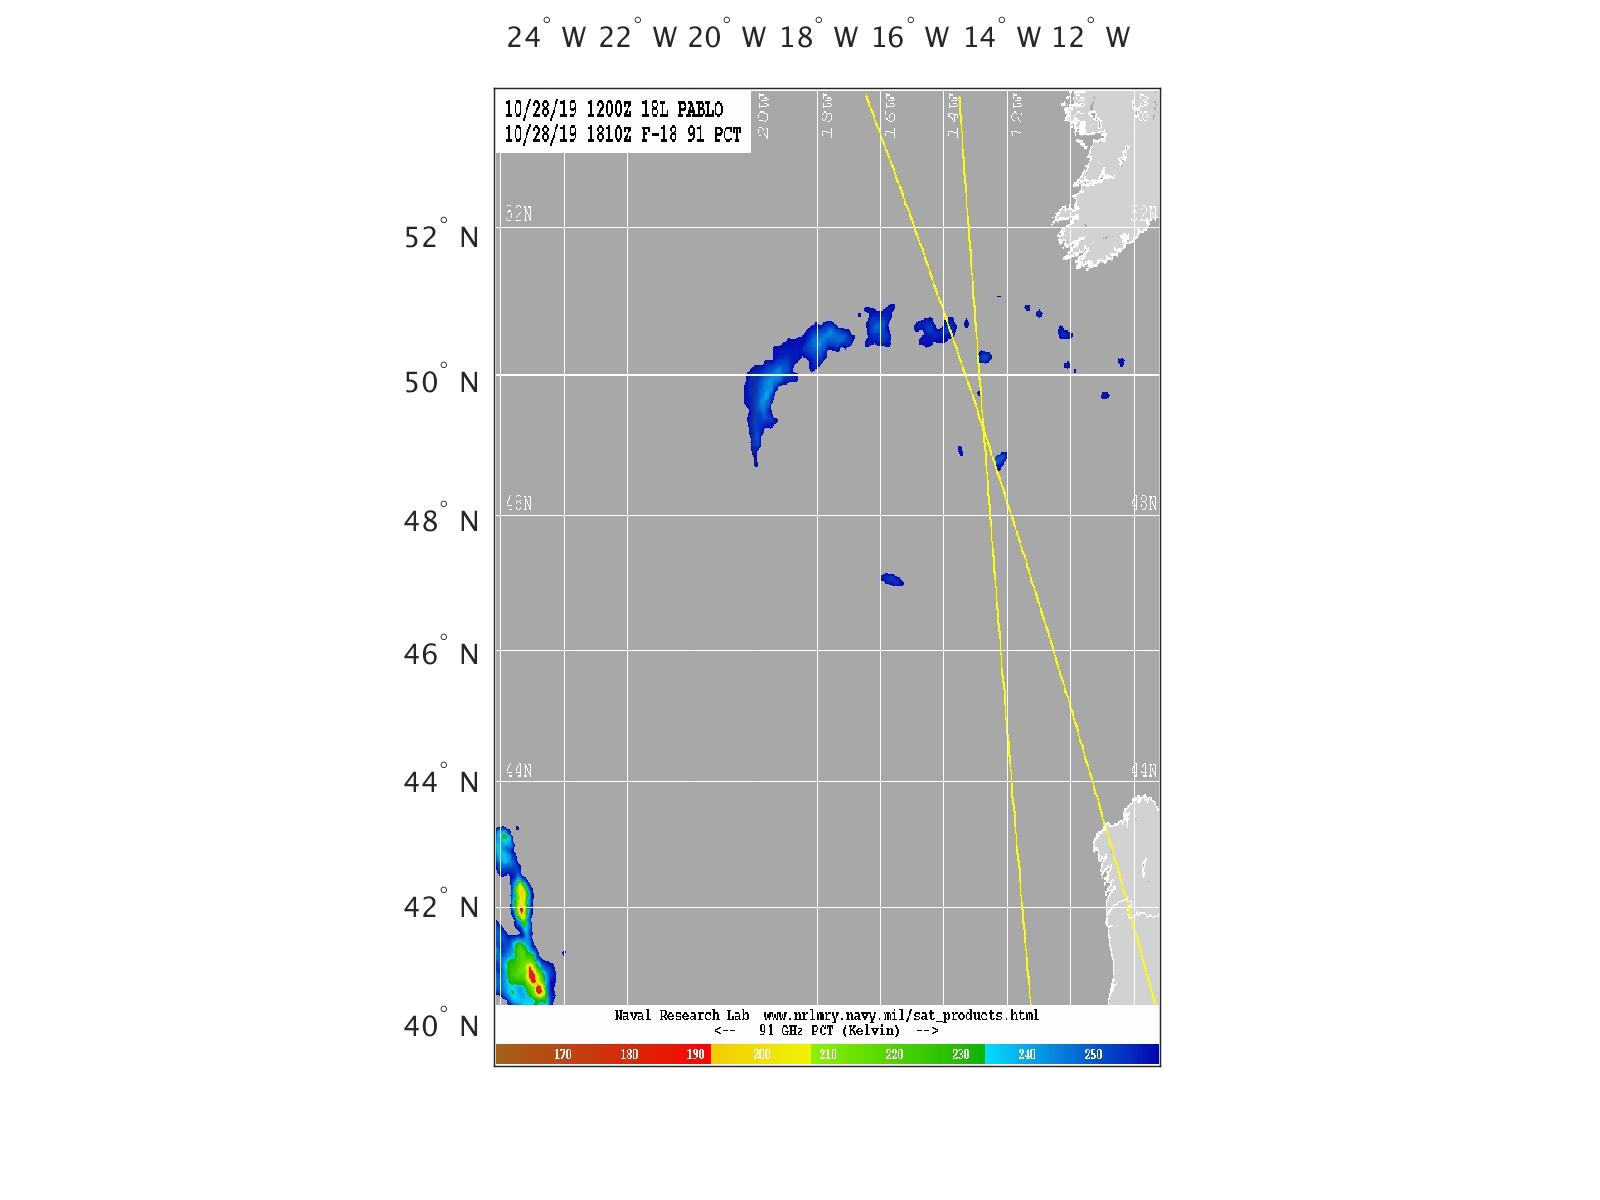
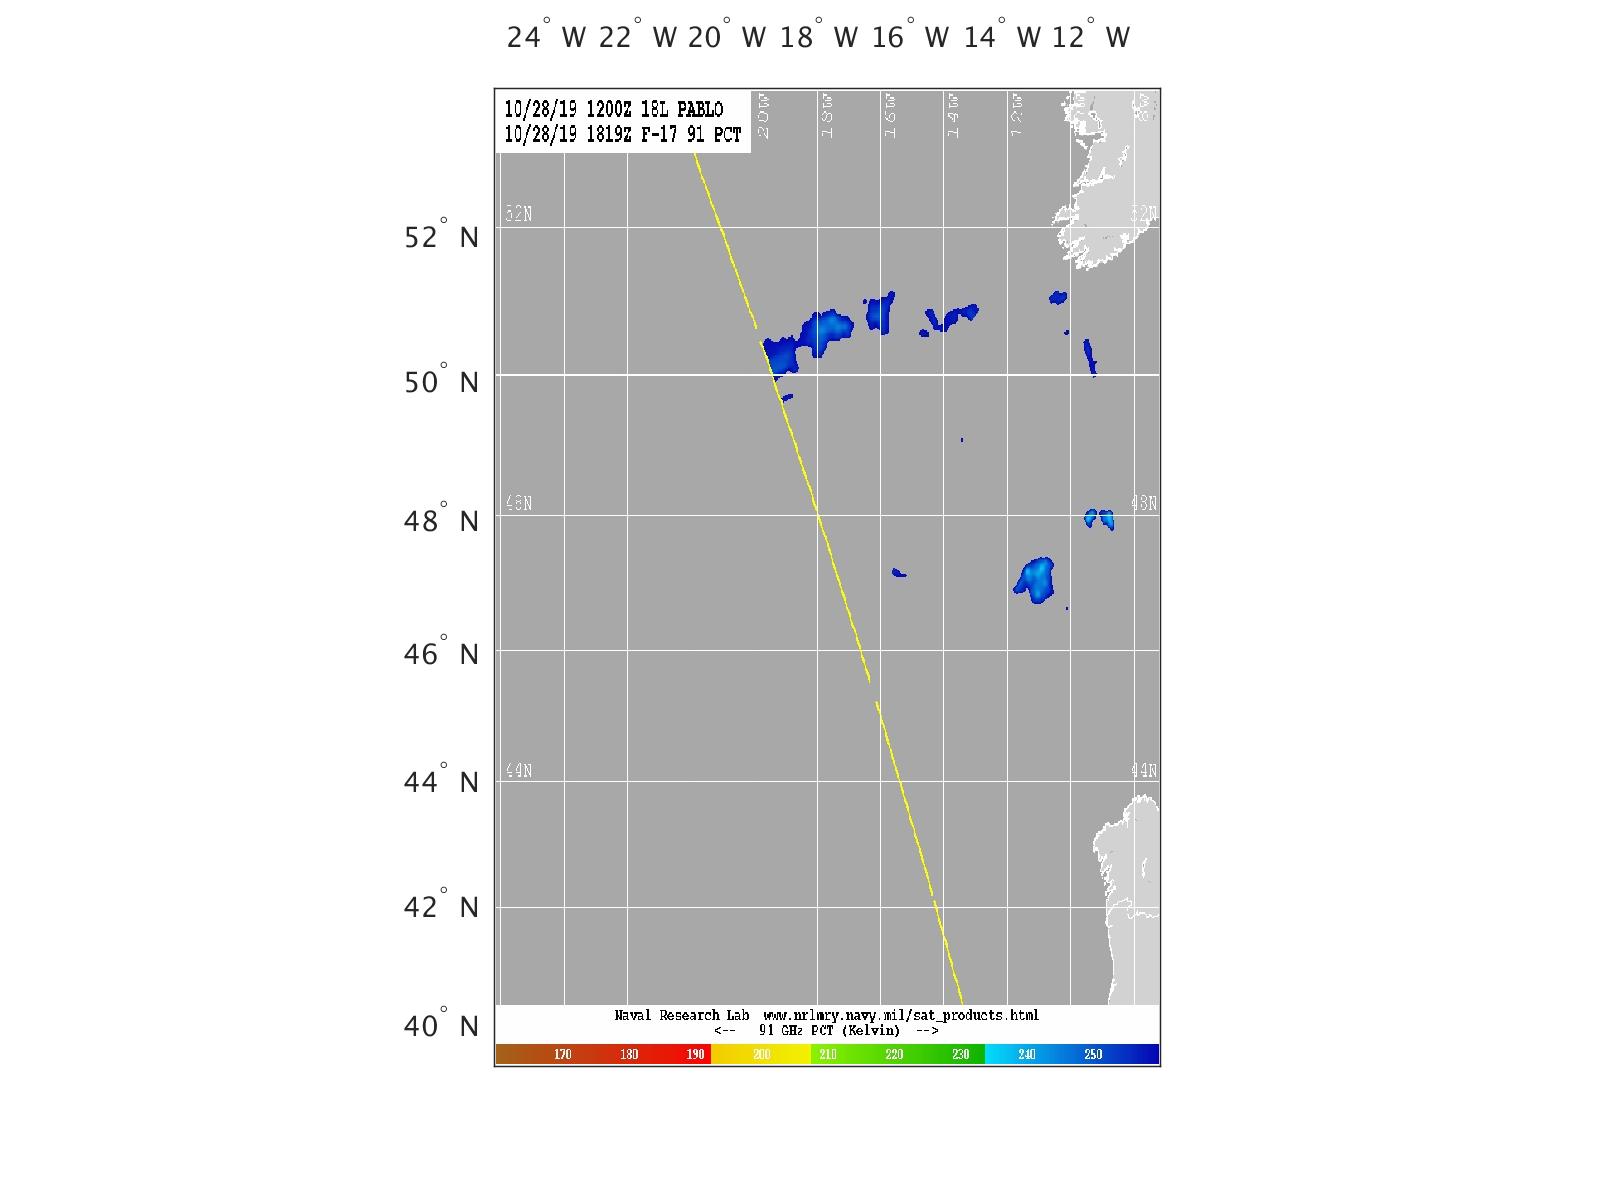
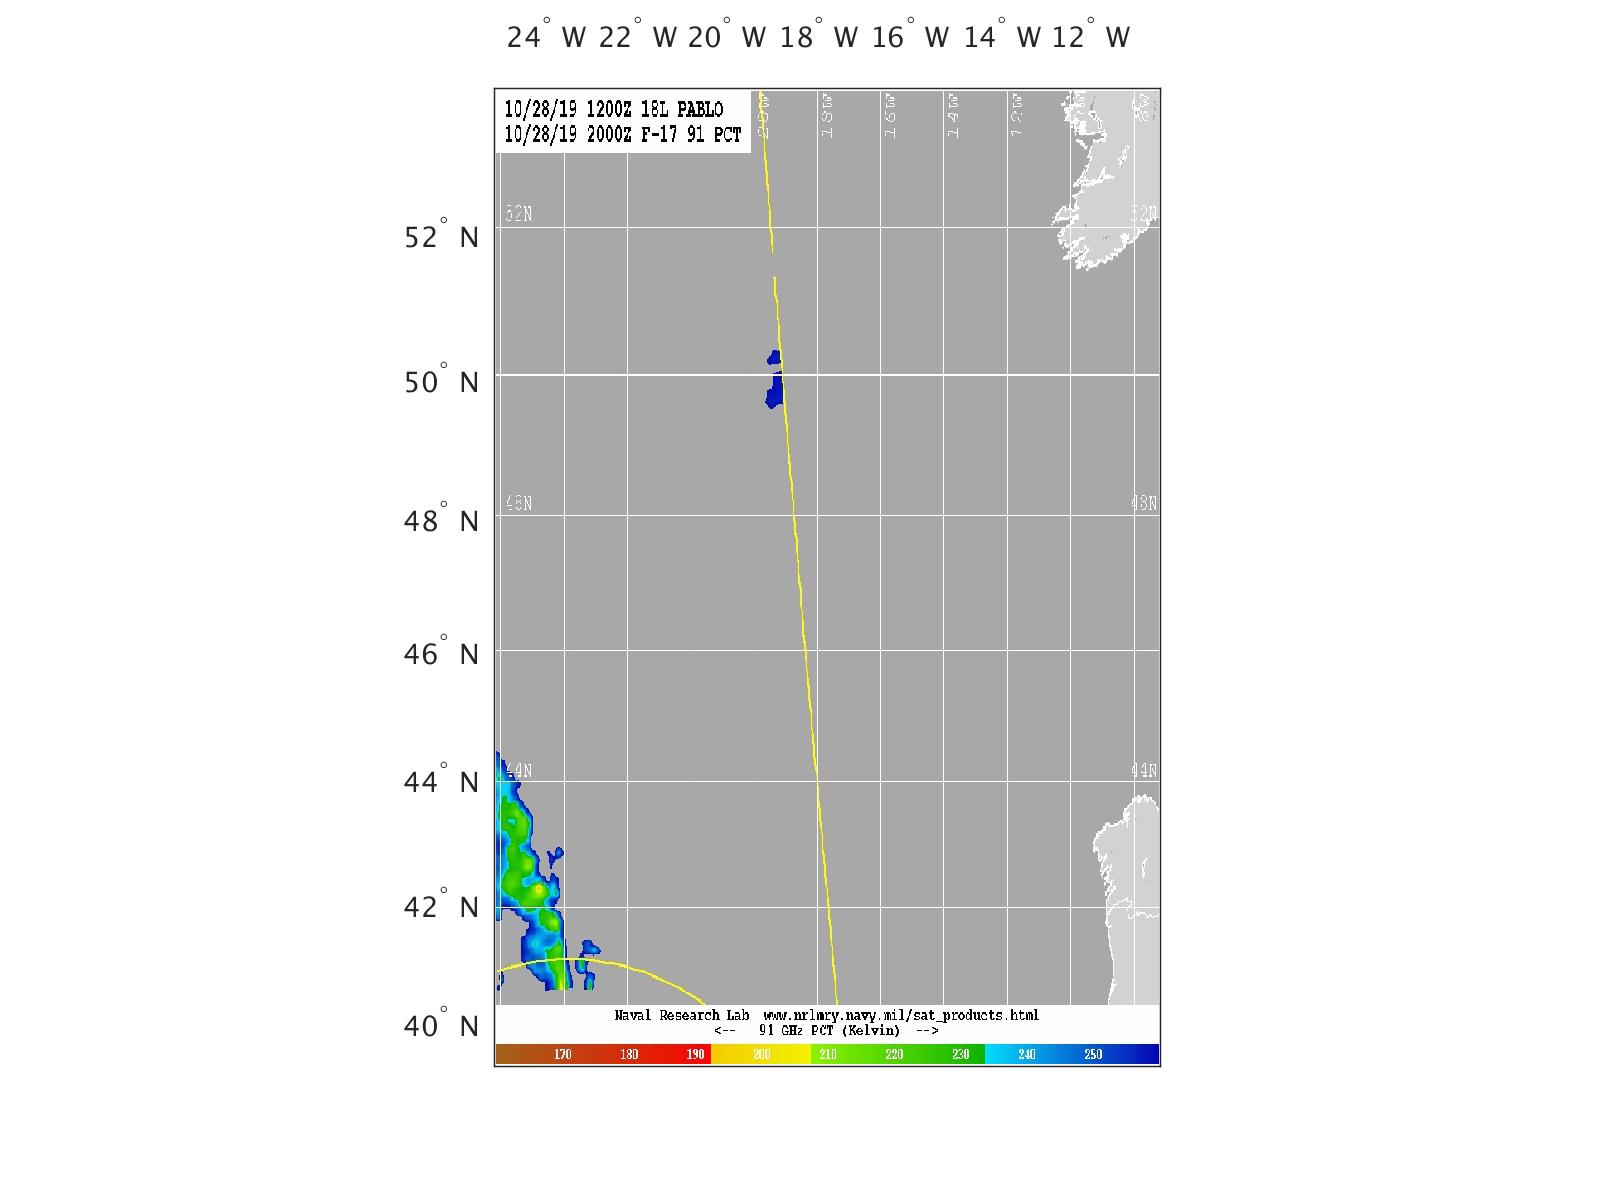
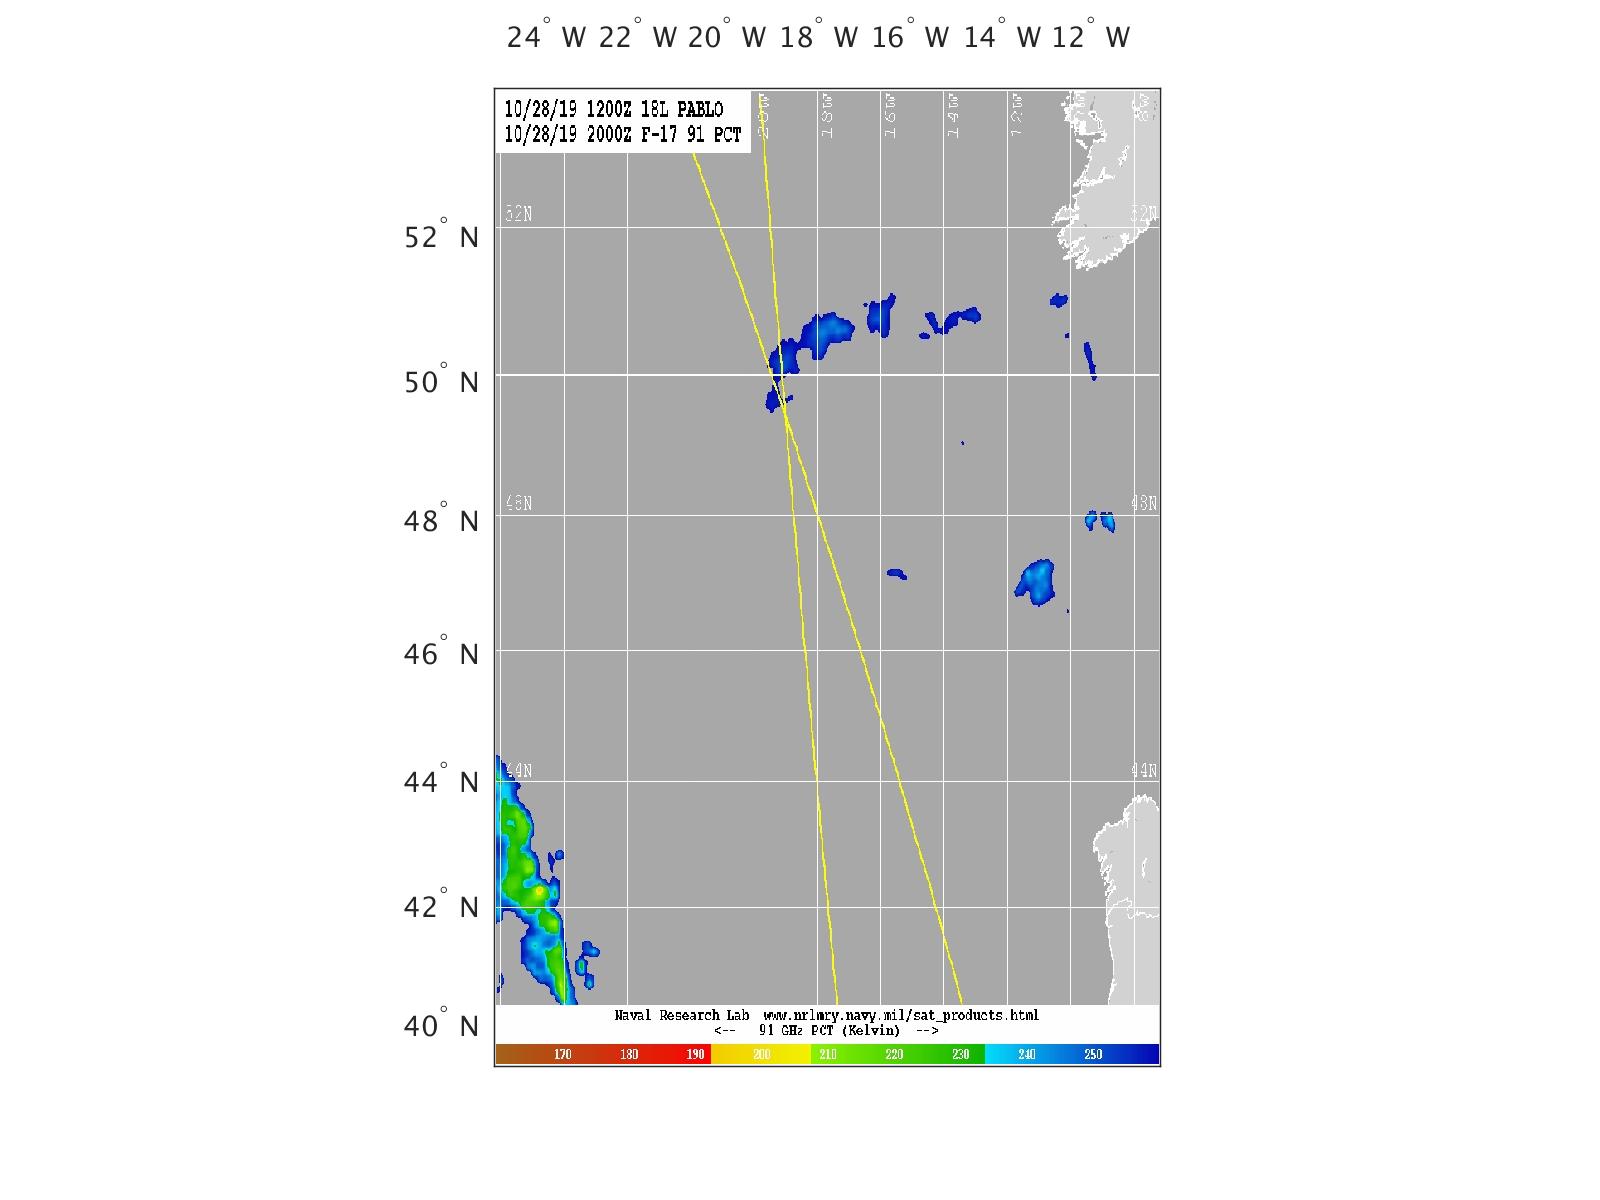
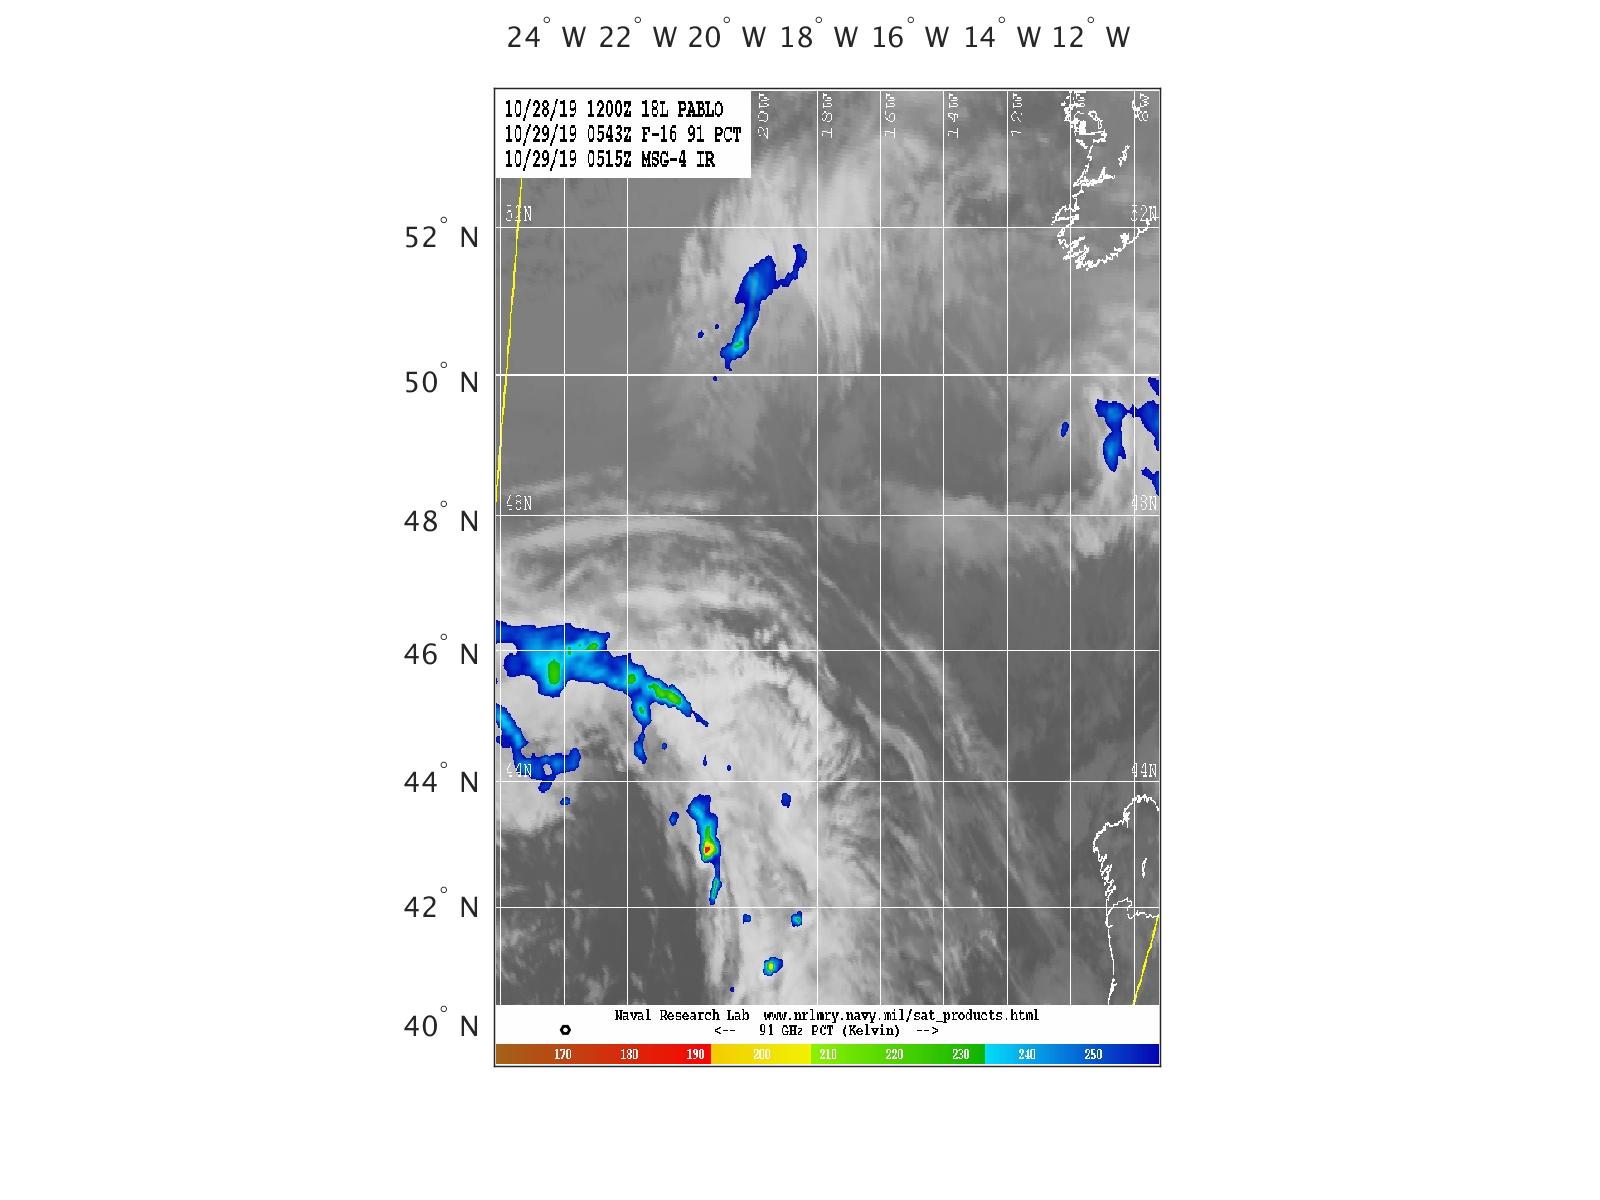
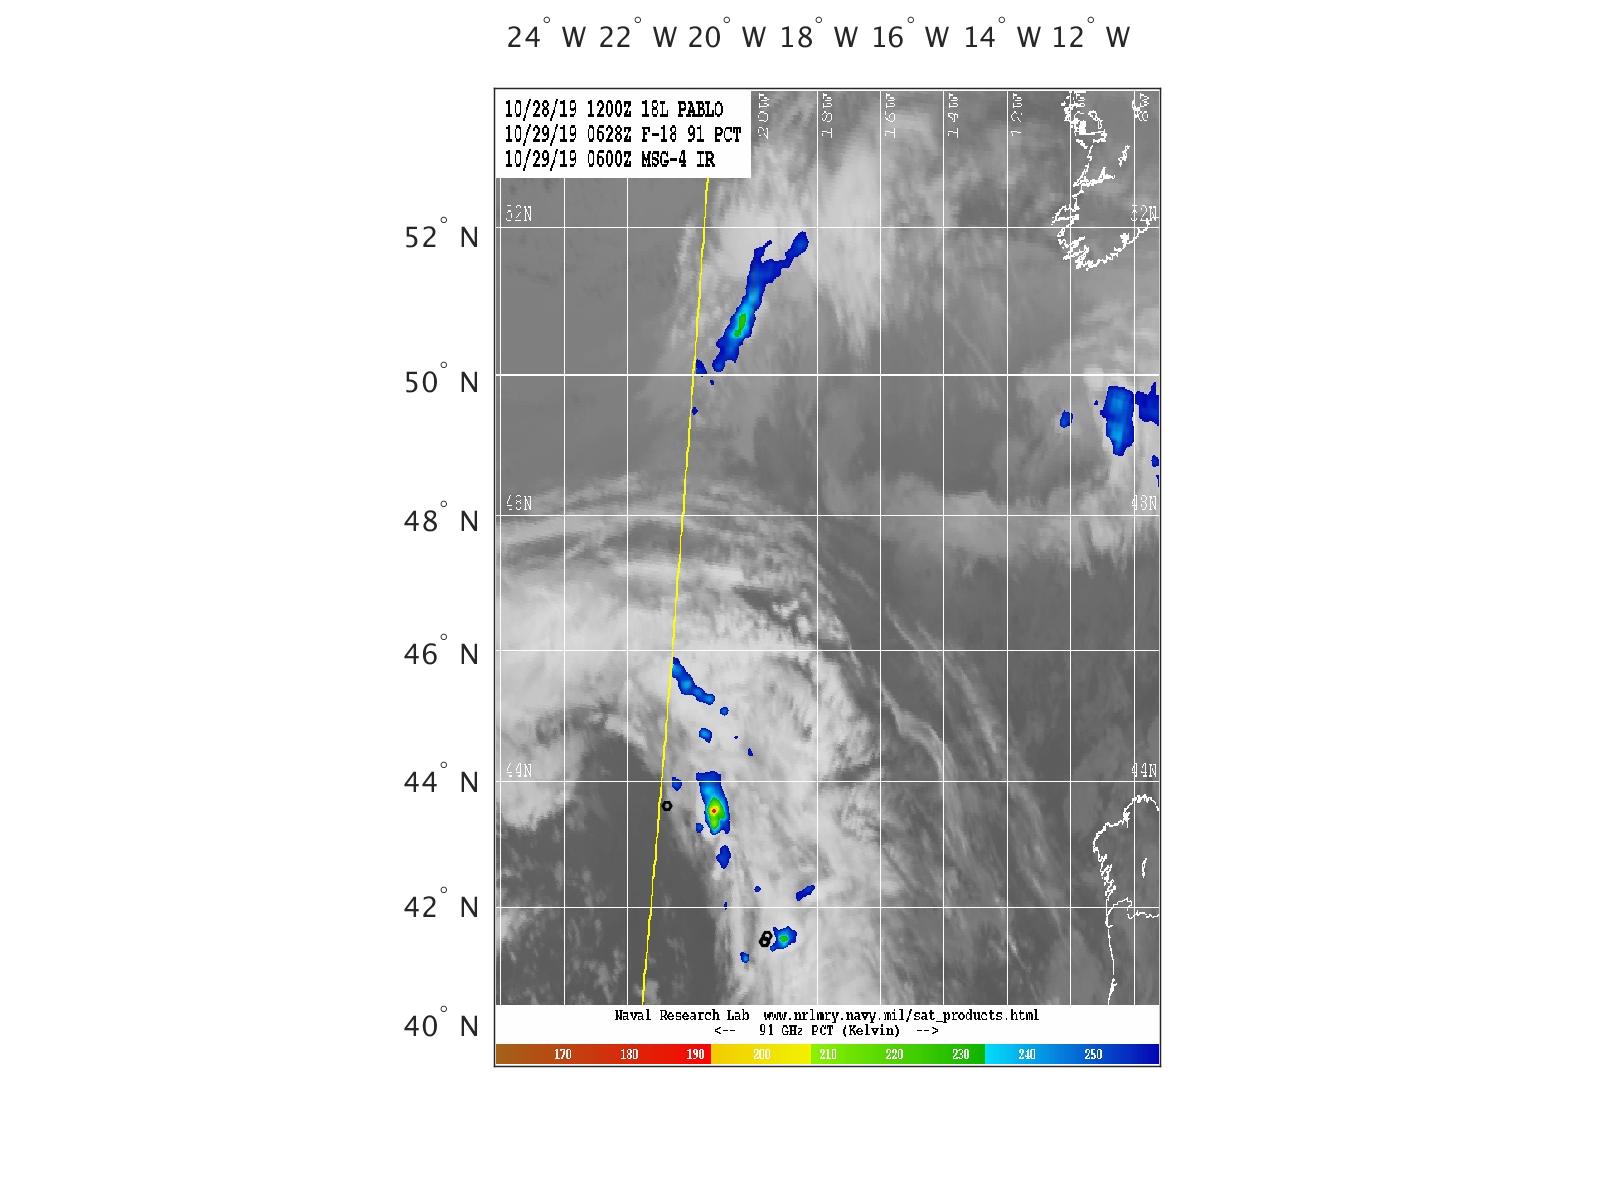
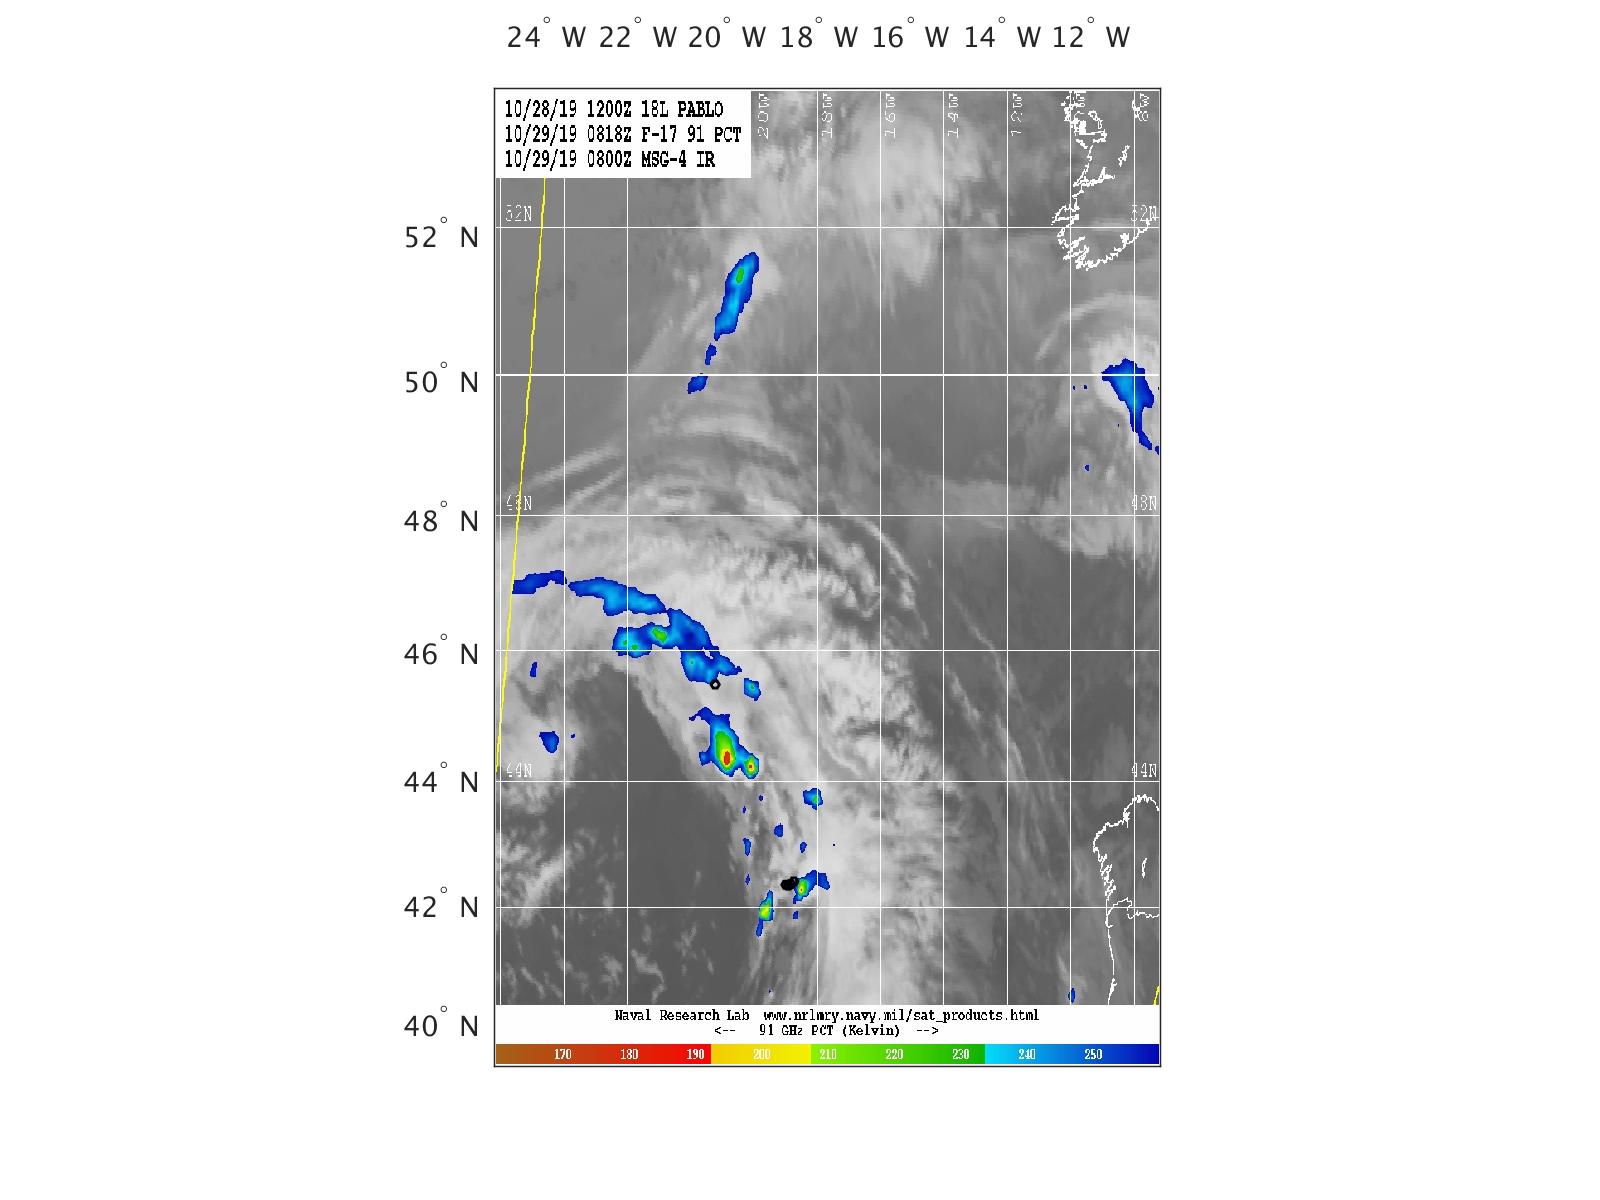
GMI 89 GHz PCT Satellite Overlay
Satellite images from the Naval Research Lab are overlaid with lightning strokes (shown as black circles) +/- 15 minutes of satellite image time. There may be no figures available to view if no satellite images are available.