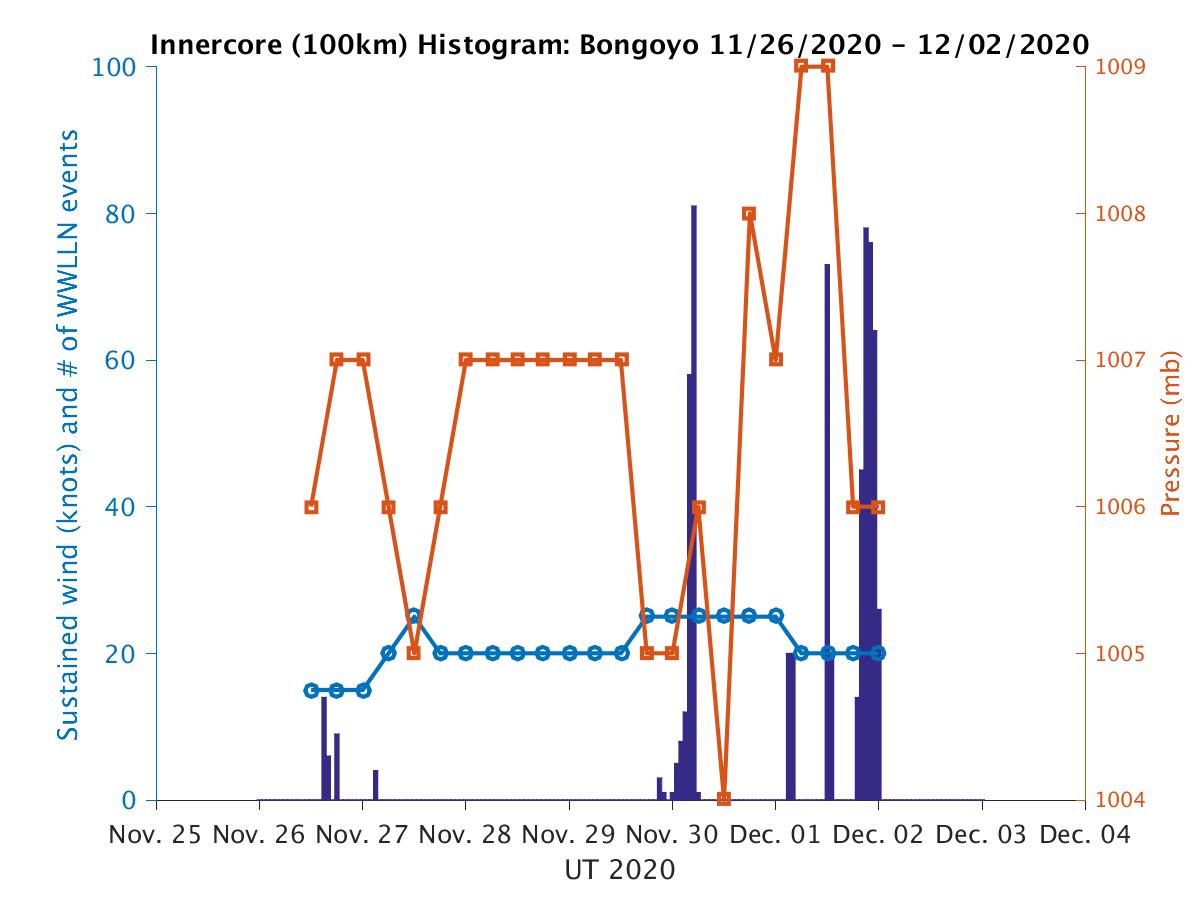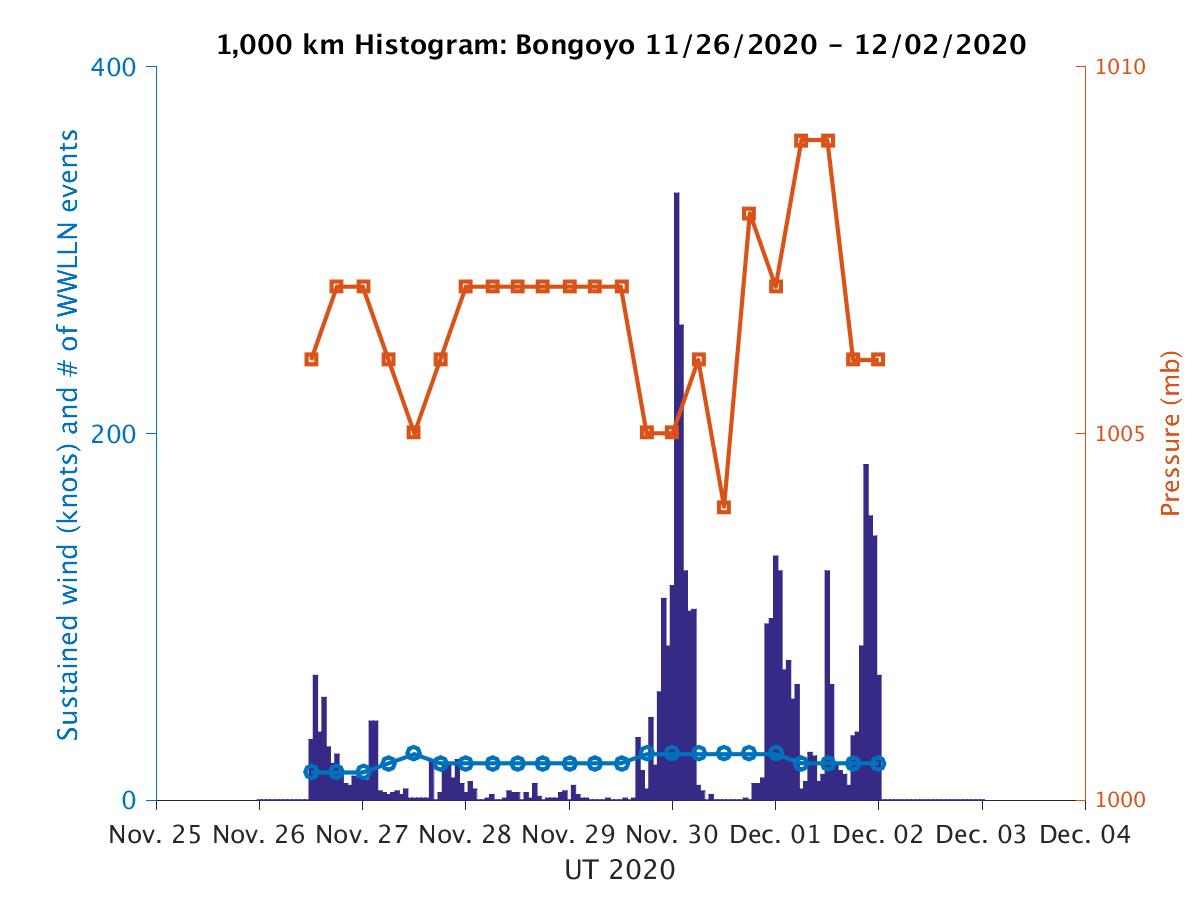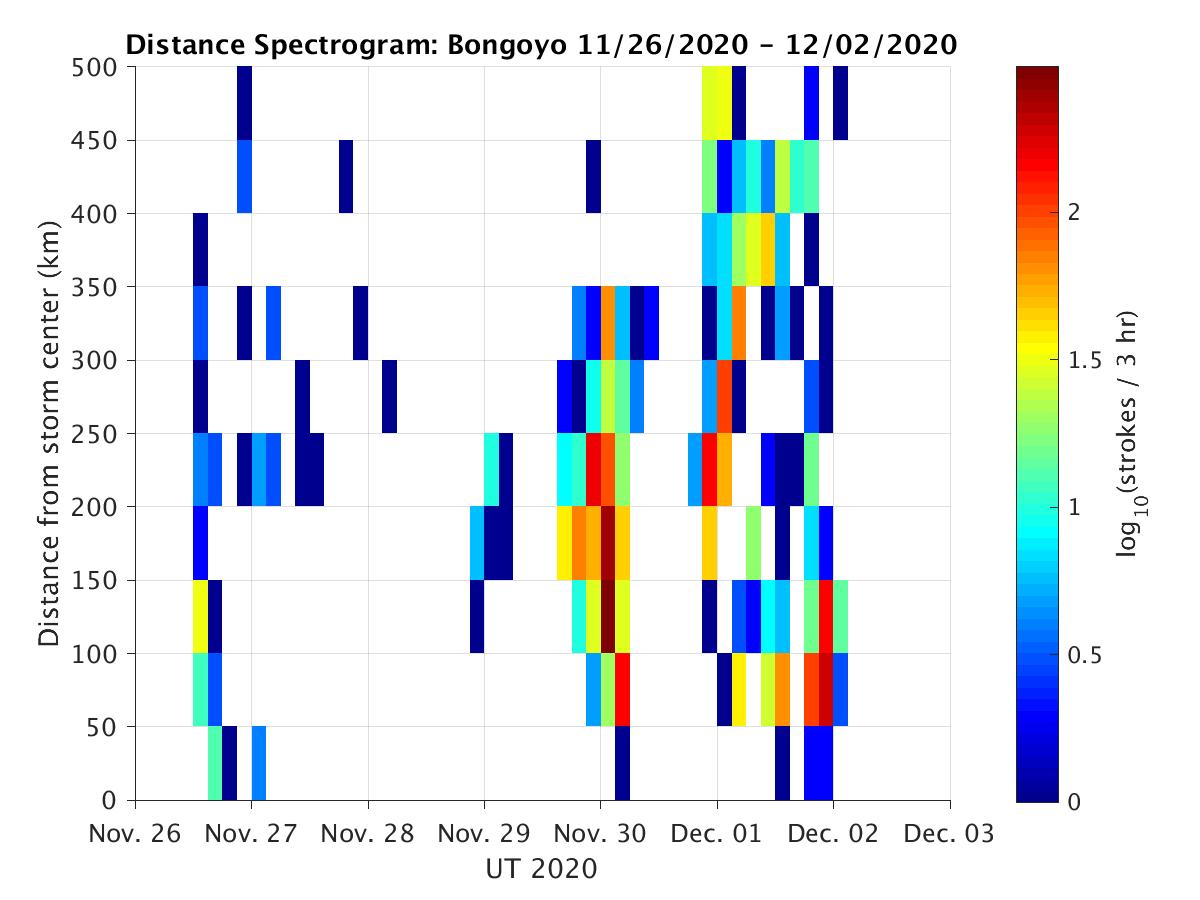
Lightning Histogram Plot
Three plots are created. The first is of wind speed, pressure, and a histogram of the number of lightning strokes per hour for lightning within 1000 km of the storm center. The second is the same, but only for lightning within 100 km of the storm center. The third plot is a spectrogram showing the number of lightning strokes per three hours binned by the radial distance from the storm center.