WWLLN
World Wide Lightning Location Network (wwlln.net)
SYSTEM MESSAGE:
Please find the latest full list of 2,200 articles referrinig to WWLLN, and 33 to 61 graduate theses
listed at http://wwlln.net/publications
NEW! PUBLIC ACCESS to TROPICAL CYCLONE MONITORING: wwlln.net/storms/
OTHER USEFUL LINKS
WWLLN Lightning Visualization will terminate in December 2019
WWLLN backup webserver http://dudwlln.otago.ac.nz/
Global Lightning Climatology with amazing movies!.
Volcano global monitor Explosive Ash Cloud Monitor, updated every minute.
[See great interview with Dr. Van Eaton (USGS) about ash cloud lightning.
https://physics.aps.org/articles/v13/44
and most importantly: WWLLN Publications: peer reviewed publications.
Google Earth overlay for 1 hour of global data ending 6 hours ago is found HERE .
DATA Availability: WWLLN archival data are copyrighted by the University of Washington
and are available to the public at nominal cost (see contact)
Contact Prof. Holzworth at bobholz@washington.edu
, Director of WWLLN, with any questions you may have.
|
|
|
|
|
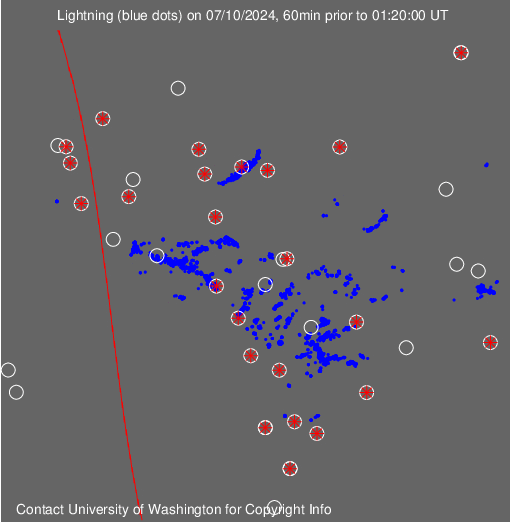
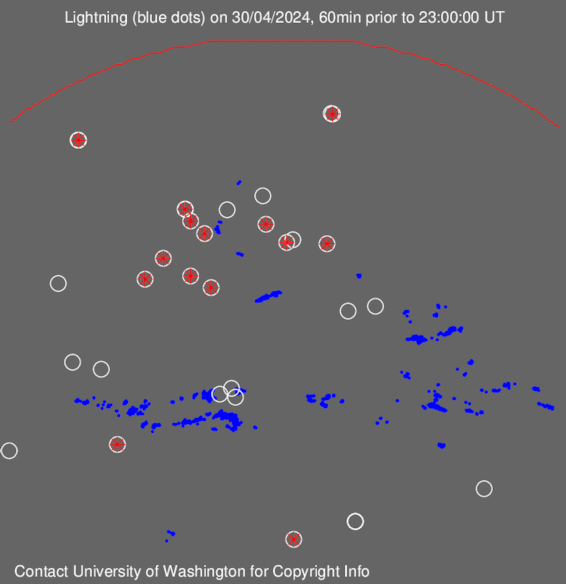
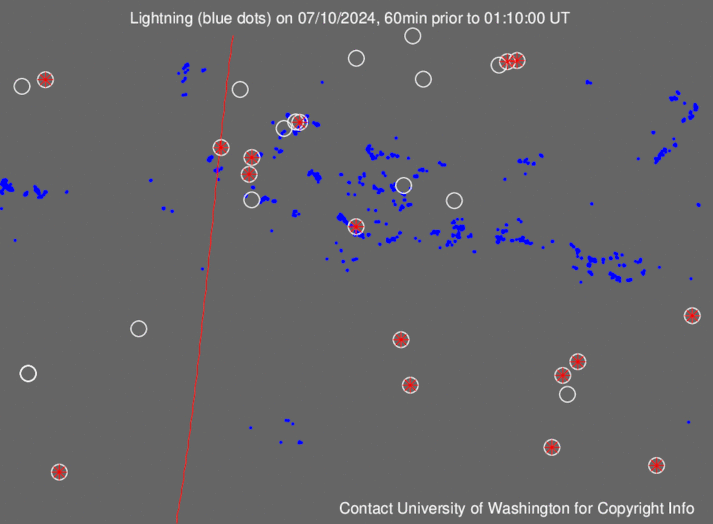
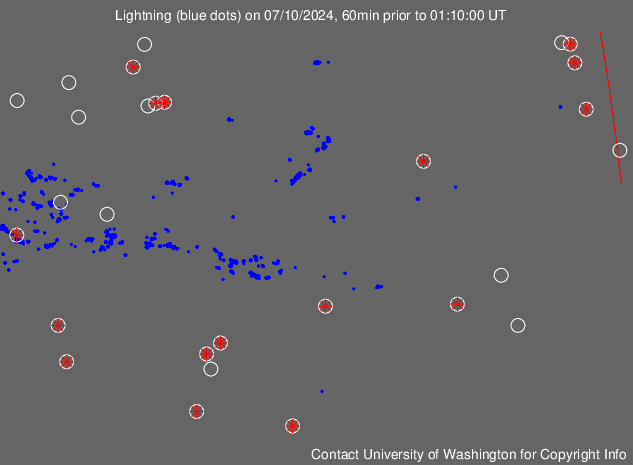
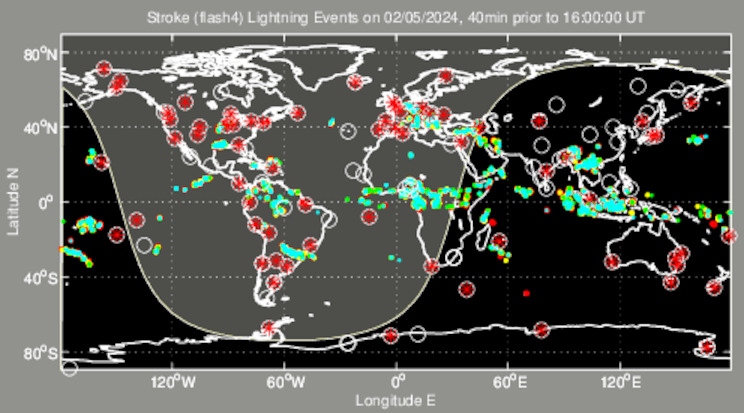
- click on image to get a bigger version -
(Notes: cloud data thanks to National Weather Service/Aviation Weather Center;
blue overlay dots are WWLLN Lightning; Red circles are WWLLN receivers; Red
line is the terminator)
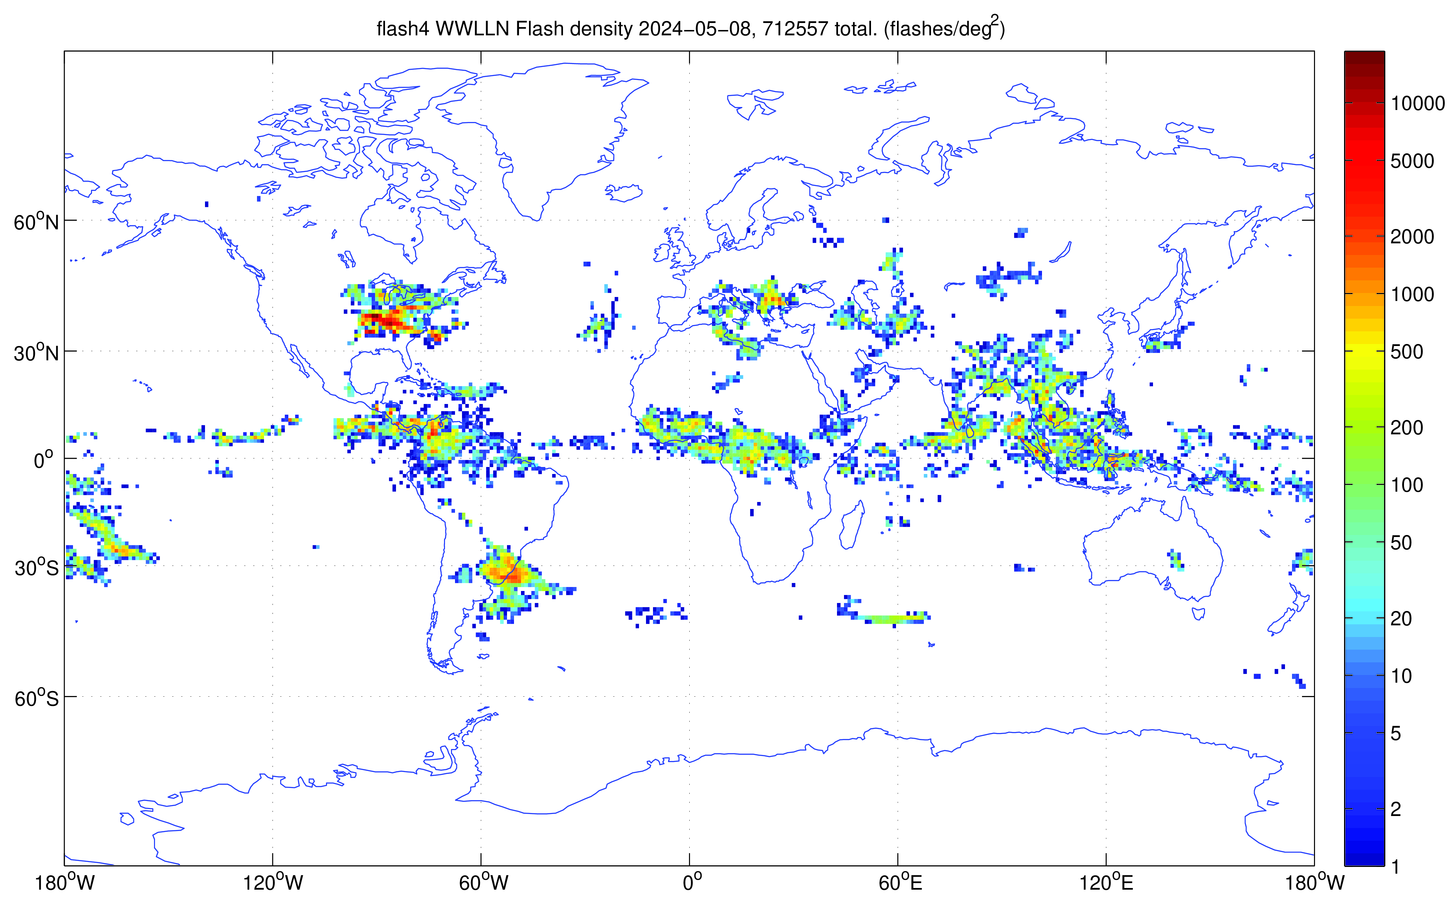
With our network of sferic sensors we are producing
regular maps of lightning activity over the entire Earth. Our map showing the
entire world uses coloured spots to indicate
lightning strokes (red stars inside an open circle are active WWLLN lightning
sensor locations). Click on the map for explanation.
|
|
The
WWLLN Management Team, lead by Prof Robert Holzworth of the
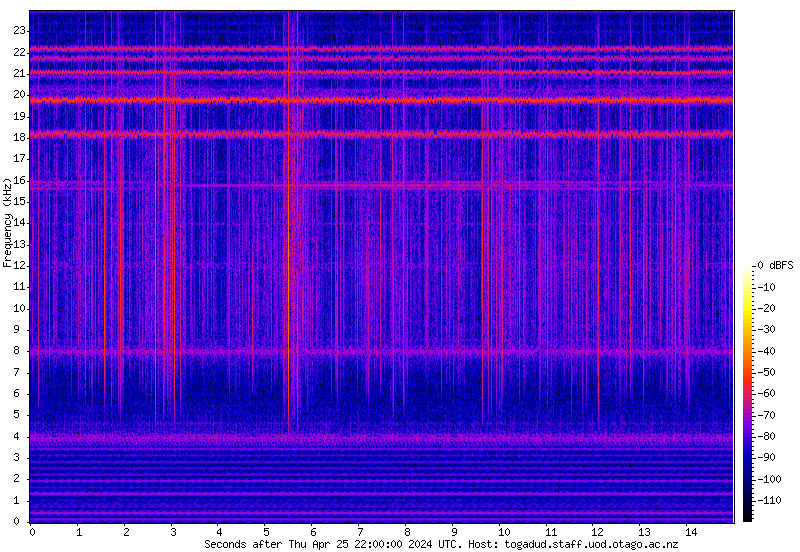
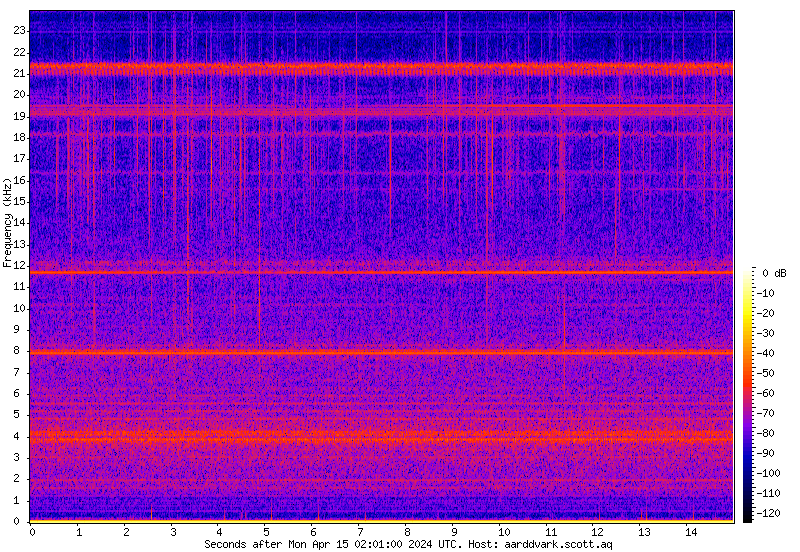
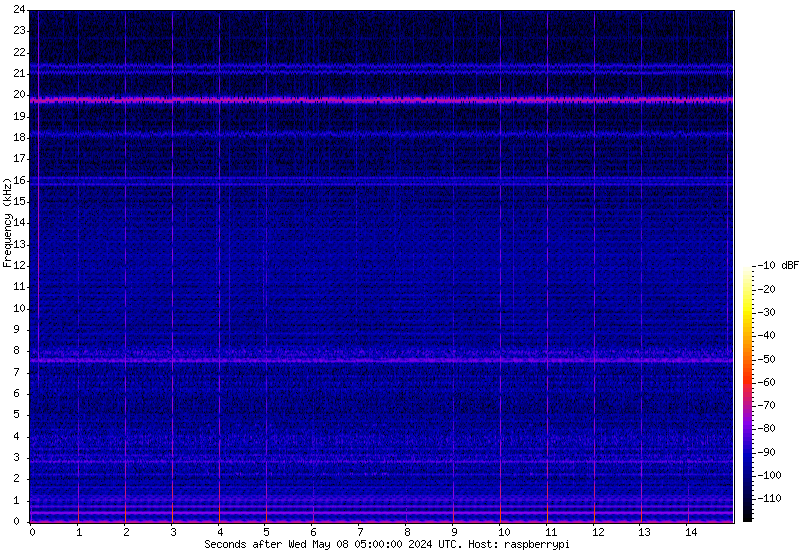
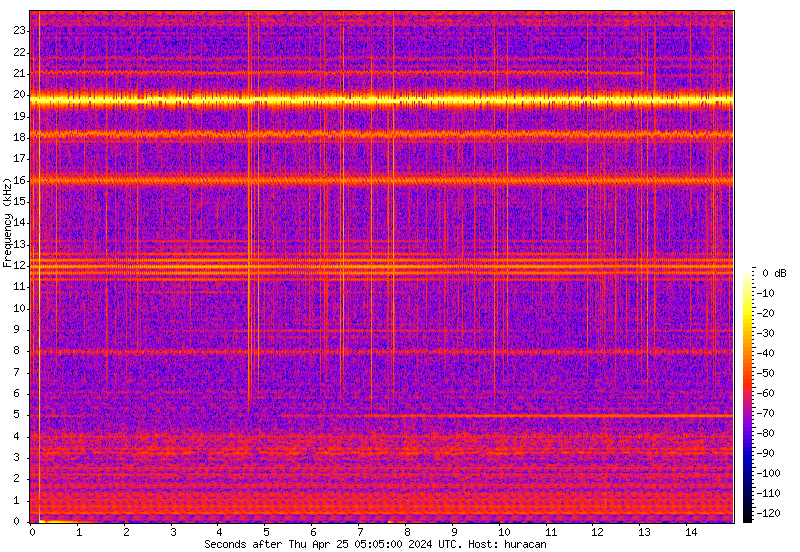
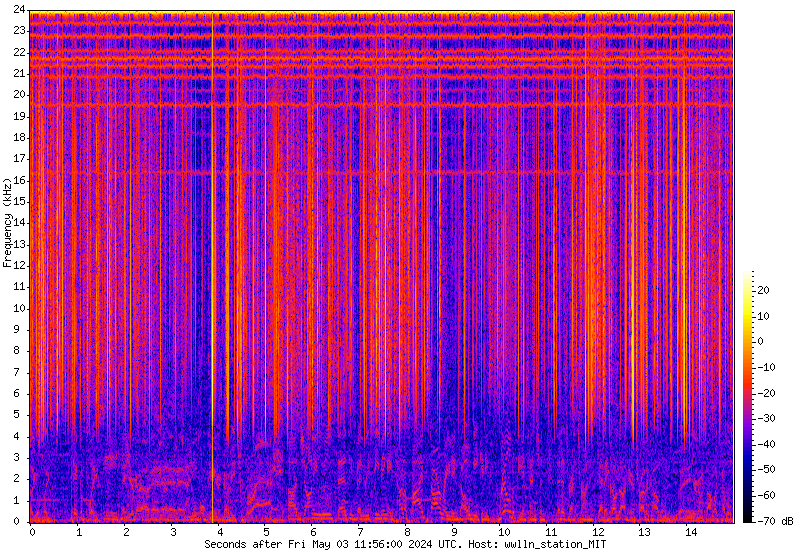
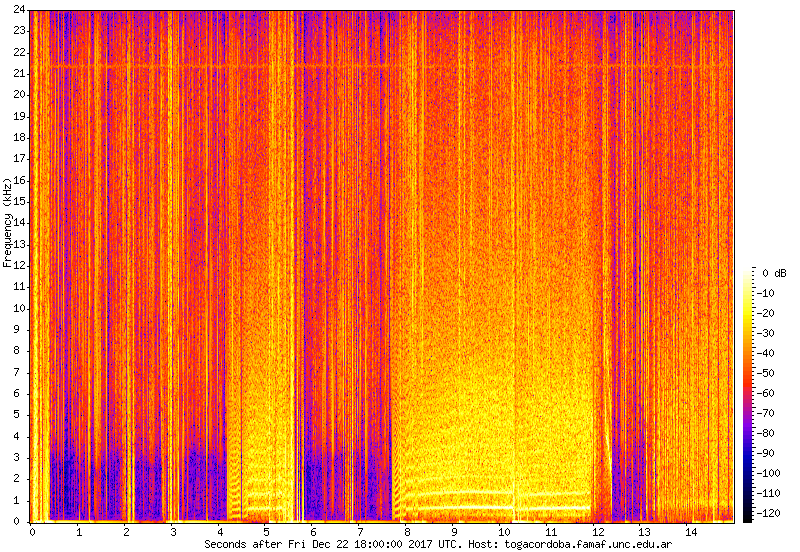
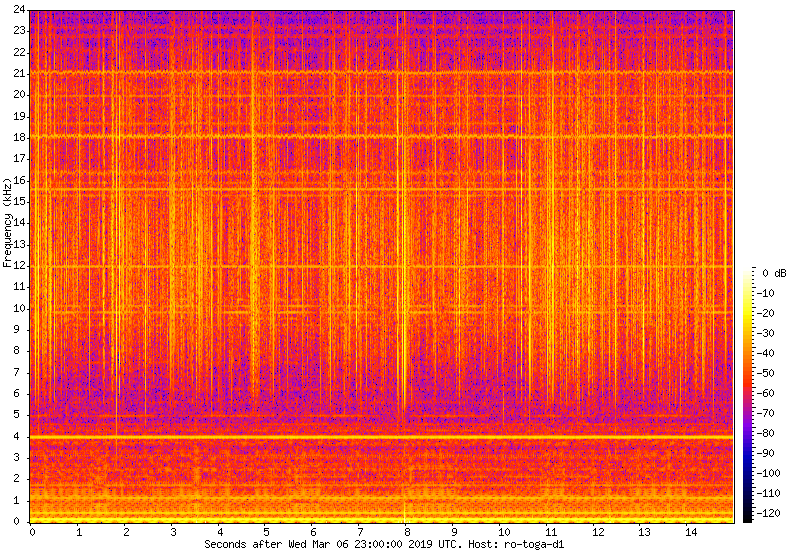
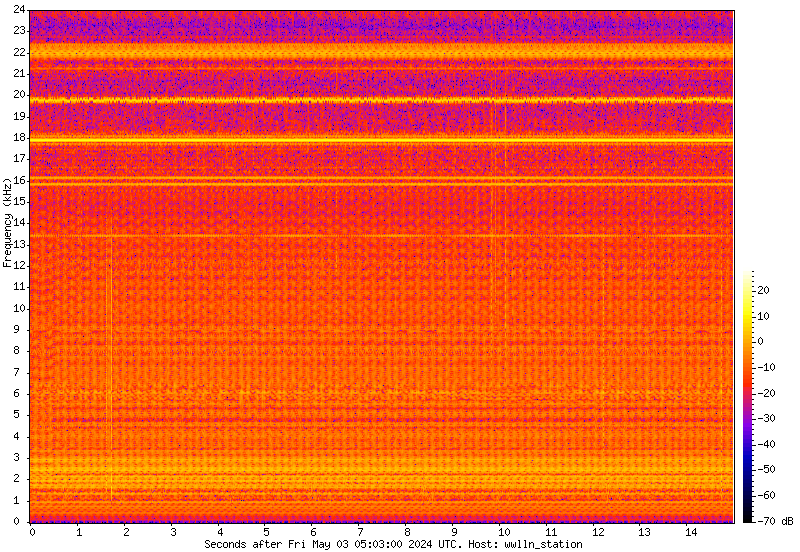
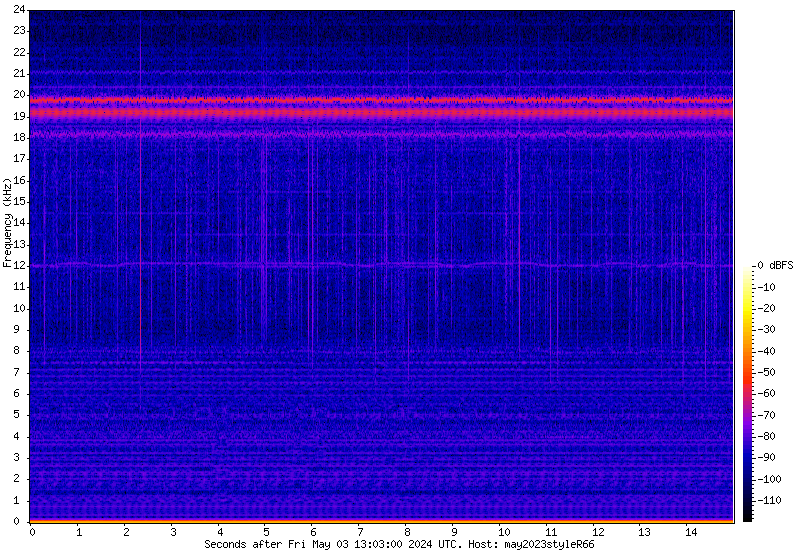
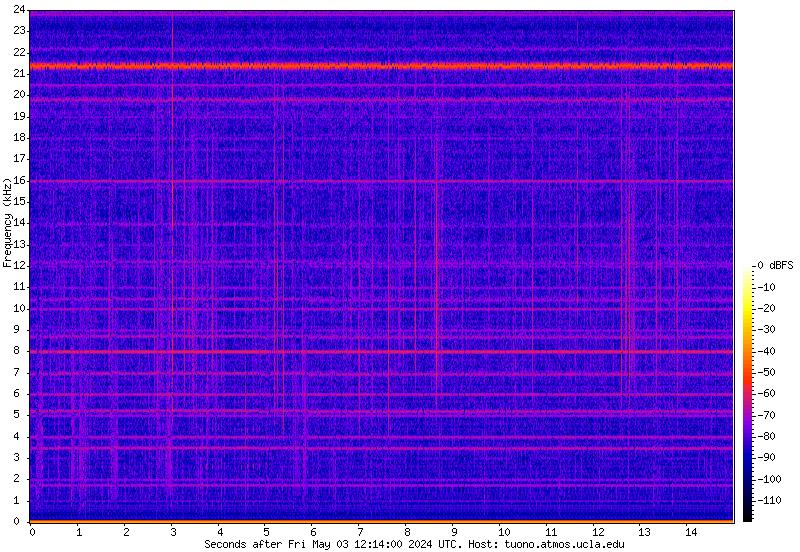
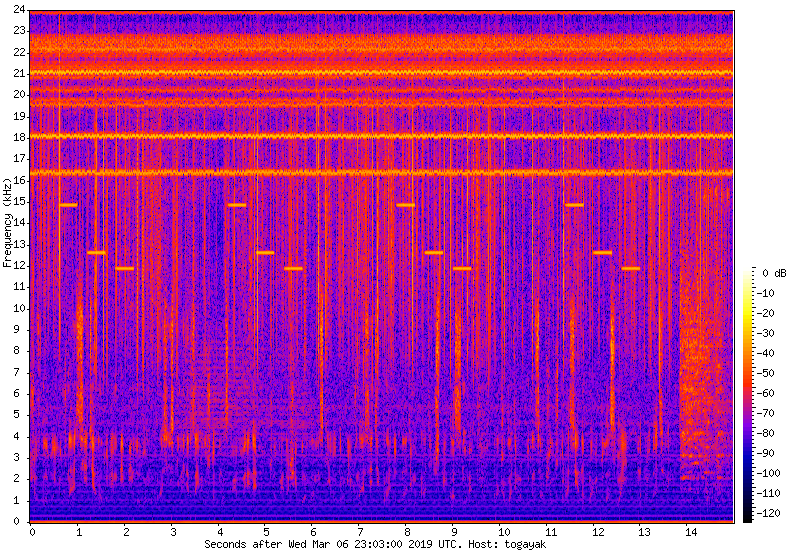
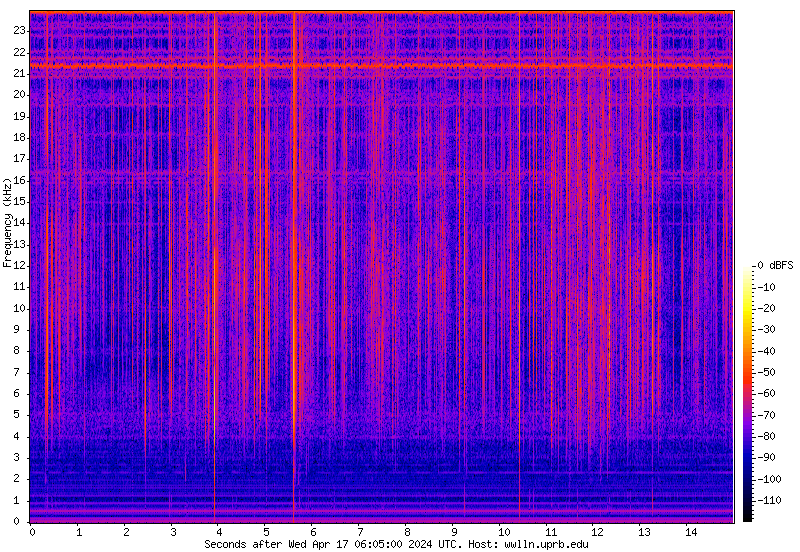
Wideband VLF spectrograms from all WWLLN stations
are available this link or by clicking on the station
name below.
We currently have over 70 sensors around the globe to detect sferic
activity in the VLF band, listed below in the order of their establishment:
|
University of Otago/Te Whare Wānanga o Otāgo ( |
||
|
|
||
|
|
||
|
|
||
|
Kindai University |
|
|
|
|
||
|
|
||
|
Massachusetts Institute of
Technology |
||
|
Durban and Hermanus and SANAE Base |
|
|
|
INPE (Brazilian National
Institute for Space Research) |
||
|
University of the South Pacific
( |
||
|
|
||
|
Universidad Nacional
Autonoma de Mexico |
||
|
Universite de la Polynesie Francaise |
||
|
|
||
|
|
||
|
|
||
|
Instituto Geofisico del Peru |
||
|
|
||
|
Universidad Nacional
de Cordoba ( |
||
|
SodankyaGeophysical Observatory, Sodankyla, |
||
|
|
||
|
British Antarctic Survey |
||
|
Cold and Arid Regions
Environmental and Engineering Research Insitute, |
||
|
British Geological Survey and
BAS |
||
|
Australian Antarctic Division |
||
|
Hermanus Magnetic Observatory and |
||
|
USGS/Magnetic Observatories ( |
||
|
Dept. of Atmospheric and Oceanic
Sciences ( |
||
|
Center for Geophysical Research
(CIGEFI), |
|
|
|
Yu.G. Shafer Institute of Cosmophysical
Research and Aeronomy |
|
|
|
|
|
|
|
Antarctica New Zealand, Host: U. Otago, Dunedin, NewZealand
|
|
|
|
Florida State University, Department of Meteorology |
|
|
|
Tripura University, Department of Physics, India |
|
|
|
Manaus |
INPA (Brazilian National Institute for Amazon Research) - LBA Program, Manaus, Brazil |
|
|
LaReunion |
Universite de la Reunion, La Reunion Island (Indian Ocean), France |
|
|
RioGallegos |
CONICET, RioGallegos, Argentina |
|
|
Maitri |
Antarctic station host NCAOR, Goa, India |
|
|
Chofu |
Univ. of Electro-Communications, Chofu-city, Tokyo, Japan |
|
|
Trelew |
Departamento de Fisica, Universidad Nacional de la Patagonia, Trelew, Argentina |
|
|
Dakar |
University Cheikh Anta Diop of Dakar (SENEGAL) |
|
|
Nigeria |
Ebonyi State University Abakaliki Nigeria |
|
|
Houghton |
Michigan Technological University(MTU), Houghton, Michigan |
|
|
Maceio |
Laboratório de Análise e Processamento de Imagens de Satélites (LAPIS)
|
|
|
Kamchatka |
Institute of Cosmophysical Research and Radio Wave Propagation, Russian Academy of Sciences |
|
|
Valparaiso |
Valparaiso University, Indiana |
|
|
MSSL |
Mullard Space Science Laboratory/UCL, Surrey, UK |
|
|
Valencia |
University of Valencia, Valencia, Spain |
|
|
La Paz-Bolivia` |
Laboratorio de Física de la Atmósfera, Instituto de Investigaciones Físicas, Universidad Mayor de San Andrés |
|
|
Vladivostok |
Institute of Cosmophysical Research and Radio Wave Propagation, Russian Academy of Sciences |
|
|
Gasu |
Gorno-Altaisk State University, Gorno-Altaisk, Russia |
|
|
|
||
|
Taiping Island |
|
|
|
Gijon |
|
|
|
Quito |
|
|
|
http://163.178.48.4/vlf.png |
http://163.178.48.4/vlf.png |
|
|
|
|
|
|
http://163.178.48.4/vlf.png |
http://163.178.48.4/vlf.png |
|
|
|
|
|
How it works
We welcome
offers of hosting a new WWLLN sensor to add to the list above. All hosts
receive all the world-wide data for their own research on monthly CDs. In
return, each host provides the computer and meets any local expenses like
power, Internet, and maintenance. However, do not think that a sensor on
your own campus is going to give you lightning location data on its own. Only
the whole network does that.
Each lightning stroke location requires the time of group arrival (TOGA) from a
least 5 WWLLN sensors. These sensors may be several thousand km distant from
the stroke. The geographical arrangement
of the sensors is important: a lightning stroke which is enclosed by sensors is
much more accurately located than one which is not so enclosed. Clearly a
uniform spacing of sensors around the Earth is the ideal. Since the Earth is
round, there are no edges: every lightning stroke is surrounded by sensors, but
not necessarily by the sensors which sense it. Typically only about 15 to 30%
of strokes detected by one sensor are detected by 5 or more. These
strokes are usually the stronger ones. Recent research indicates our detection
efficiency for strokes about 30 kA is approximately 30% globally.
To cover the whole world by sensors spaced uniformly about 1000 km apart would
require roughly 500 sensors. If spaced 3000 km apart, we would need
“only” around 50 to 60 sensors. Presently we have 40 WWLLN sensors,
and we are in the process of expanding to 60 sensors within the next year or
two.
More information
More information on the World Wide
Lightning Location network (WWLLN) is available from our publication list:
WWLLN Data available
WWLLN Monthly CDs containing all stroke locations over the whole
world for 1 month. These are mailed to subscribers each month, or they may opt
to download the data weekly. Archival data are available for sale from August 15,
2004 to the present. Our site hosts receive a free monthly subscription.
WWLLN Data are available via internet with cadence every 10 minutes for
research purposes from the University of Washington, or with a cadence of as
fast as every minute (i.e. in realtime) from our
commercial reseller. Contact Prof. Holzworth for more info.
Contact
for
all questions relating to WWLLN:
Prof Robert Holzworth, Earth and Space Sciences,
Webpage maintained by:
Craig J Rodger (
Robert Holzworth (
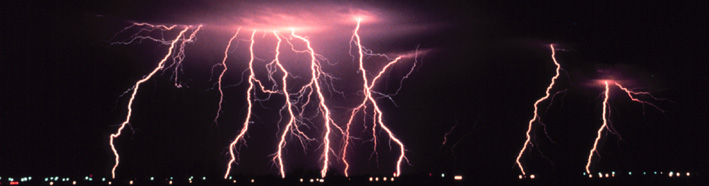
Lightning image thanks to photolib.noaa.gov
Web editing:
Bob Holzworth (bobholz@washington.edu)